


Abstract
Annexin V is a 36-kDa protein that binds with high affinity to phosphatidylserine lipids in the cell membrane. Because one of the earliest measurable events in apoptosis is the eversion of phosphatidylserine from the inner membrane leaflet to the outer cell surface, annexin V has proven useful for detecting the earliest stages of apoptosis. Methods: Annexin V was radiolabeled with 18F using N-succinimidyl-4-18F-fluorobenzoic acid chemistry, to a specific activity of 555–925 kBq/μg of protein. 18F-Annexin V (14.8–51.8 MBq) was administered intravenously to rats after pretreatment with cycloheximide (5 mg/kg) to induce liver apoptosis, and the injected rats were imaged by PET over 2 h. After imaging, rats were dissected and individual organs were weighed and counted. Results: Pretreatment of rats with cycloheximide resulted in a 3- to 9-fold increase in uptake of 18F-annexin V in the liver of treated animals at 2 h, compared with controls. By morphologic analysis, treated livers showed a 3- to 6-fold higher level of apoptosis than controls, with higher levels also seen with longer exposure to cycloheximide. Terminal deoxynucleotide end-labeling (TUNEL) assays performed on liver slices showed that cycloheximide induced a 5- to 8-fold increase in the number of TUNEL-positive nuclei. These TUNEL results correlated with the uptake of 18F-annexin V in dissected liver tissue, with an r2 value of 0.89. Biodistribution analysis of normal rats showed highest uptake of 18F-annexin V in the kidneys and urinary bladder, indicating rapid renal clearance of 18F-annexin V metabolites. Conclusion: The PET data, the organ-specific uptake data from dissection, and the morphologic and TUNEL measures of apoptosis together indicate that 18F-annexin V binds specifically to apoptotic tissues in this model of chemically induced apoptosis in rat liver. The short physical half-life of 18F-annexin V and the rapid clearance of its metabolites to the urinary system suggest that 18F-annexin V will be useful in early assessment of the clinical response to cancer therapy in individual patients.
Apoptosis plays an important role in the biology of cancer, both its etiology and its clinical treatment. Cells that are deficient in their apoptotic response can potentially become tumorigenic (1). Radiotherapy and chemotherapy generally kill tumor cells by inducing apoptosis (programmed cell death) (2). Thus, a probe that noninvasively measures apoptosis in cancer patients could have an important role in clinical oncology. A technetium-labeled probe for assessing apoptosis, 99mTc-annexin V, has already progressed to early clinical trials (3,4). Our laboratory is currently developing 18F-annexin V as a PET-based alternative for imaging apoptosis in cancer patients.
Annexin V is a 36-kDa protein that binds with high affinity (dissociation constant, ∼10 nmol/L) to phosphatidylserine, a phospholipid that is normally found only on the interior of the cell membrane but is redistributed to the exterior of the cell membrane in the early stages of apoptosis. The majority of cancer treatments kill tumor cells by causing DNA damage beyond the repair capability of the cell. This damage is sensed by a pathway that involves p53 and induces programmed cell death. Apoptosis is initiated by activation of the effector caspases that trigger a cascade of proteolysis that results in fragmentation of intracellular components. One of the earliest effects of caspase activation is the disruption of the translocase system that normally maintains phosphatidylserine on the inside of the cell membrane (5). Together with upregulation of a scramblase activity that occurs on caspase activation, this results in the rapid appearance of phosphatidylserine on the outer membrane leaflet, where it serves as a signal to phagocytic cells to engulf and digest the membrane-enclosed apoptotic bodies (5). The high-affinity binding of annexin V to externalized phosphatidylserine makes it a sensitive probe of the early phase of apoptosis. In the past decade, annexin V binding has become one of the standard measures of apoptosis in histopathology (6).
Because PET has higher resolution and is more quantitative than single-photon imaging with a technetium-labeled probe, our laboratory and others are developing 18F-annexin V as an imaging probe. We previously reported on the chemical synthesis of 18F-annexin V and its membrane-binding characteristics (7). Here we report the results of a series of studies using 18F-annexin V in an animal model of chemically induced apoptosis. Chemical induction of apoptosis was chosen for initial validation of this new radiopharmaceutical because it provides better experimental control than can be achieved with treated tumors. These in vivo studies demonstrated that the uptake of 18F-annexin V correlates with in vitro markers of apoptosis in rat liver. They further showed that 18F-annexin V and its metabolites clear rapidly from the body, principally by urinary excretion, so that the background uptake is sufficiently low to allow imaging within a relatively short time after administration of the radiotracer.
MATERIALS AND METHODS
Materials
Cycloheximide for induction of apoptosis was obtained from Sigma-Aldrich. The FragEL fluorescent DNA fragmentation detection kit from EMD Biosciences/Oncogene Research Products was used for the terminal deoxynucleotide end-labeling (TUNEL) assay. Red blood cells for the binding assay (4C Plus Cell Control) were obtained from Coulter Corp. Reagents for preparation of 18F-annexin V were described in our previous report (7). PD-10 columns (Sephadex G-25) were from Amersham.
Preparation of 18F-Annexin V
Recombinant human annexin V was produced by expression in Escherichia coli as previously described (8). Annexin V was radiolabeled via conjugation with N-succinimidyl-4-18F-fluorobenzoic acid, which reacts with free amino groups on the protein (7, 9). For the studies reported here, annexin V (typically 0.4–0.8 mg) was incubated with a 2- to 4-fold molar excess of 18F-N-succinimidyl-4-18F-fluorobenzoic acid at pH 8.5 for 15 min at room temperature, resulting in a specific activity of 555–925 kBq/mg protein at the time of injection (7). The labeled protein was purified by high-performance liquid chromatography over a silica-based size-exclusion column (BioSep SEC-S 2000; Phenomenex), eluted with sterile phosphate-buffered saline. Reanalysis of the purified 18F-annexin V on PD-10 gel-filtration columns showed that the high-performance liquid chromatography peak fraction had the same elution profile as unlabeled annexin V. No free fluoride was detected in the product. The biologic activity of each preparation of radiolabeled annexin V was verified in an assay evaluating binding to phosphatidylserine-expressing red blood cells as described previously (10). Typically, 85%–90% of the labeled protein was bound to the red blood cells in the presence of a 2.5 mmol/L concentration of Ca2+.
Animal Model of Apoptosis
Although there are several mouse models of apoptosis, including tumor-treatment models, the mouse is a small animal and some of the target organs challenge the resolution limits of PET. Furthermore, a tumor model will have background levels of apoptosis and is inherently more variable than a chemical model. For these reasons, we chose rats and a chemical model of liver apoptosis for these initial in vivo validation studies. Cycloheximide has been shown to induce apoptosis in rat liver in several in vivo studies (11–13) and was selected as the chemical agent to induce apoptosis. Sprague–Dawley male rats (160–350 g) were obtained from Animal Technologies, Ltd., and were housed according to the regulations of the University of Washington Institutional Animal Care and Use Committee. All animal procedures used in these studies were preapproved by that committee. Animals of the same approximate weight (within 10%) were used in each treatment group to eliminate age- or size-dependent differences in 18F-annexin V uptake. Previously published results have shown that administration of 1.5, 3, or 10 mg of cycloheximide per kilogram of body weight induced apoptosis in rat liver within 3 h, as measured by morphology (presence of apoptotic bodies) and by TUNEL assay (11,13). A pilot study in our laboratory indicated that cycloheximide, from 0.2 to 5 mg/kg, induced liver apoptosis in a dose-dependent manner. Younger (lower weight) animals were more susceptible to the effects of cycloheximide treatment than older animals, but the difference was not significant. In the present study, we chose to use a single dose of 5 mg/kg and administered the cycloheximide at differing times before radiotracer injection and imaging to provide a wide range of liver apoptosis. Rats were injected via the tail vein with the fluorinated radiotracer (except in a single study in which 2 rats were injected retroorbitally) and then imaged with PET for 2 h.
PET Imaging
The timeline for the PET studies was as follows: At 0 min, inject animals with anesthetic; after 10 min, inject animals with cycloheximide; wait 50–240 min; prepare tail vein catheters in anesthetized animals; begin imaging; inject 18F-annexin V into all animals within 1 min; image for 2 h total; at end of imaging, euthanize animals with anesthetic overdose; dissect animals; weigh and count organs; and fix liver samples for analysis.
Animals (a total of 20 over 7 separate imaging studies) were anesthetized for radiotracer administration by intraperitoneal injection using either a mix of ketamine and xylazine (60 mg/kg and 4.4 mg/kg, respectively) or pentobarbital alone (50 mg/kg). For some studies, anesthesia was maintained by periodic boosts (10%–20%) of ketamine and xylazine throughout the imaging session. For extended studies, a gas administration system was used, with anesthesia maintained by isoflurane at 0.6%–2%. PET image data were obtained using an Advance PET system (General Electric Medical Systems). Image data were collected for 2 h in 10-min time bins, starting immediately after tail-vein injection of 14.8–51.8 MBq of 18F-annexin V (specific activity of 555–925 kBq/μg protein at the time of injection). From 2 to 4 rats per study (at least 1 untreated animal and 1–3 cycloheximide-treated animals) were placed prone on an acrylic holder with isothermal pads to maintain body temperature (Braintree Scientific), and the level of anesthesia was maintained to ensure no movement of the animals other than respiration.
18F-Annexin V was injected via a previously placed 24-gauge tail vein catheter (BD Scientific). Syringes were weighed before and after injection, and a weighed sample of the injected dose was retained for quantitation. The catheter was flushed with 0.5 mL of sterile saline after injection of the radiopharmaceutical. At the end of the study, the animal’s tail was separated from the carcass, and the activity levels in the body and tail were separately measured in a dose calibrator to quantify the percentage of injected dose within the body. All of the reported biodistribution data have been normalized to the injected dose within the body, which for all injections was ≥88% of the dose.
Imaging data were collected in 2-dimensional mode and reconstructed using the attenuation-corrected ordered-subsets expectation maximization algorithm (2 iterations, 28 subsets) with a 4-mm gaussian postprocessing filter. The reconstructed imaging field of view was 15 cm. Images were analyzed using the Advance software (General Electric Medical Systems) and displayed on an imaging workstation. The selected regions of interest (ROIs) were manually delineated on the image screen and then transferred to all the image slices within a given imaging session. Time–activity curve data for each ROI (including heart, liver, kidney, and urinary bladder, and one encompassing the whole animal and adjacent pad) were then generated and analyzed for tissue uptake determination, expressed in units of kBq/cm3.
Upon completion of imaging, the rats were immediately euthanized with a lethal dose of either ketamine and xylazine or pentobarbital. Rat tissues were dissected, weighed, and then counted in a Cobra single-well γ-counter (Packard) with a 200-keV energy window centered on 511 keV. Weighed standards of the injected dose were also counted. Radiotracer biodistribution data were expressed in units of percentage injected dose per gram of tissue at the time of sacrifice for each animal. These data were also used to correct the kBq/cm3 time curve from the imaging data for partial-volume effects. Separate samples of liver were preserved overnight in formalin at 4°C and then embedded in paraffin to produce slides for subsequent histologic analysis of apoptosis (hematoxylin- and eosin [H&E]-stained morphology, TUNEL).
TUNEL Assay and Morphologic Analysis
Because our imaging studies were designed to determine the uptake and biodistribution of 18F-annexin V after chemically induced apoptosis, it was important to confirm apoptosis in the livers of treated rats by independent methods that provide quantitative results. Slices of fixed liver tissue were first stained with standard H&E for morphologic examination. Stained slides were scored for the presence of apoptotic bodies and pyknotic nuclei within hepatocytes, using a phase-contrast light microscope (Nikon Microphot SA). A second marker of apoptosis was scored by performing a TUNEL assay that measures DNA fragmentation, a characteristic feature of apoptosis. Terminal deoxynucleotide transferase adds labeled nucleotides to the 3′ termini at double-stranded breaks in the fragmented DNA. TUNEL assays were performed according to the manufacturer’s instructions, using the fluorescein-conjugated FragELkit (EMD Biosciences/Oncogene Research Products). Briefly, slices were freed of paraffin through xylene and graded EtOH washes and then incubated with proteinase K (EMD Biosciences) (2 mg/mL in 10 mmol/L Tris, pH 8.0). After proteinase digestion, the slides were equilibrated in pH 7.4 buffer, the terminal deoxynucleotide transferase enzyme (24 units) and proprietary FragEL labeling mix (EMD Biosciences) were added, and the slides were incubated at 37°C for 1 h in a humid chamber. Slides were scored for percentage of fluorescent nuclei per field using a Nikon Microphot-SA microscope with a 60× oil-immersion lens; 15–25 fields were counted per slide (500–1,000 cells total).
Dosimetry Calculations in Normal Rats
The time course biodistribution data were analyzed to estimate the radiation-absorbed dose associated with this imaging procedure for specific organs. To minimize partial-volume effects from PET, we drew individual ROIs over the central portion of each selected organ (except urinary bladder) on a transaxial section, so that only the central third of the organ image was measured. This was done by first drawing a full-organ ROI, counting the pixels, then shrinking the ROI symmetrically until it contained one third the number of pixels. This 33% ROI was used to generate time–activity curves in units of kBq/cm3 for each organ (except bladder) over each time bin in the 2-h imaging series. The uptake value from the final imaging time bin (1 h 50 m) for each organ was then compared with the uptake value from the γ-counting of the dissected tissue. For each tissue, the ratio of kBq/cm3 from imaging to kBq/g from ex vivo counting was used to adjust the image-based time–activity curve. The average value of this ratio (from 3 animals) varied between 0.47 and 1.86. In general, the smaller organs and those with lowest uptake deviated the most from a ratio of 1, presumably because of partial-volume effects.
Because the total volume of urine in the bladder is difficult to determine, and because most of the 18F-annexin V activity cleared to the bladder, whole-organ ROIs were drawn over the bladder to include all urine in the field of view. Drawing large ROIs for the bladder was possible because background tissue uptake in the immediate vicinity of the bladder was minimal. Also, by drawing large ROIs, we included any small amount of urine that leaked from the anesthetized rats. ROIs were drawn over all relevant transaxial slices within a given time bin and were then summed; this summed value was used in the urinary bladder time–activity curves presented here.
The values for each time bin were normalized to a 37-MBq injected dose and multiplied by the average weight for each organ for a standard 70-kg man. These numbers were integrated over time, using Simpson’s rule, to generate total activity per organ over the course of the imaging session, in kBq·h per organ. To obtain the most conservative estimate of absorbed dose, we extended the integrated values from the last time frame in this analysis using physical decay only, ignoring biologic clearance to the excretory system. The dosimetry calculation assumed that the urinary bladder was emptied to 25% of residual activity at 2 h after injection of the radiopharmaceutical. The set of organ-specific cumulative activity values was used in conjunction with human S-value tables from the MIRDOSE program to calculate rough estimates for radiation-absorbed dose in humans. Calculations were performed according to the standard MIRD schema (14), using stable values for 18F from the MIRDOSE3 program (15). Effective dose equivalent was determined using the method described in publication 53 of the International Commission on Radiological Protection (16).
RESULTS
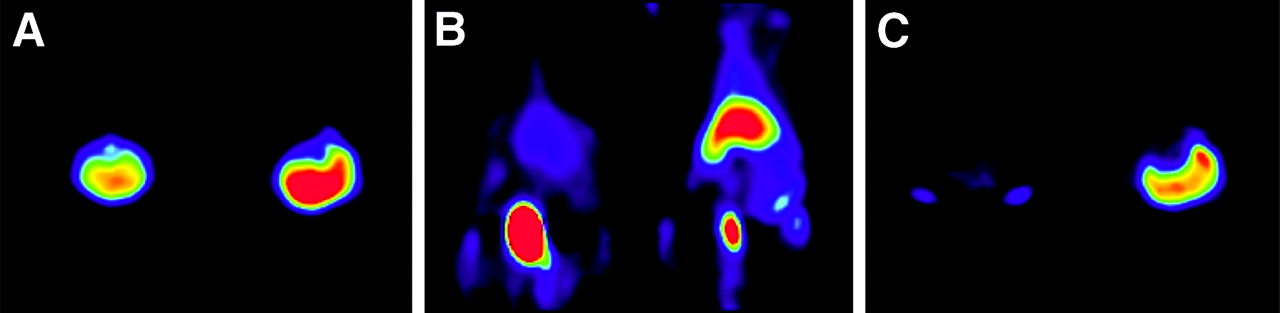
In 4 separate imaging studies, 12 rats were injected with cycloheximide (5 mg/kg) to induce apoptosis in the liver before imaging. After different pretreatment times with cycloheximide, inducing different levels of liver apoptosis, the rats were injected with 18F-annexin V and uptake of the radiotracer was quantitated by PET. In the first study, cycloheximide pretreatment was initiated 4 h before the injection of the radiopharmaceutical to ensure maximal induction of apoptosis before imaging. PET images from that study (Fig. 1) showed at all time points a greater uptake of 18F-annexin V in the liver of the treated animal than in the liver of the untreated control animal, and this difference in uptake increased with time.

PET images of normal and cycloheximide-treated rats. Four hours after injection of 5 mg of cycloheximide per kilogram (intraperitoneally) into treated rat, both animals were injected with approximately 51.8 MBq of 18F-annexin V (851 kBq/μg protein) and imaged for 2 h starting immediately after injection of radiotracer. In each panel, untreated animal is on left and treated animal is on right. All 3 false-color images were windowed using same logarithmic scale from 0 to 481 kBq/cm3. (A) Transverse image from 10-min time frame beginning at 0 min shows higher uptake in treated liver (R). (B) Coronal image from 10-min time frame beginning at 40 min; urinary bladder shows high uptake in lower abdomen. (C) Transverse image from 10-min time frame beginning at 1 h 30 min shows higher uptake in treated liver (R).
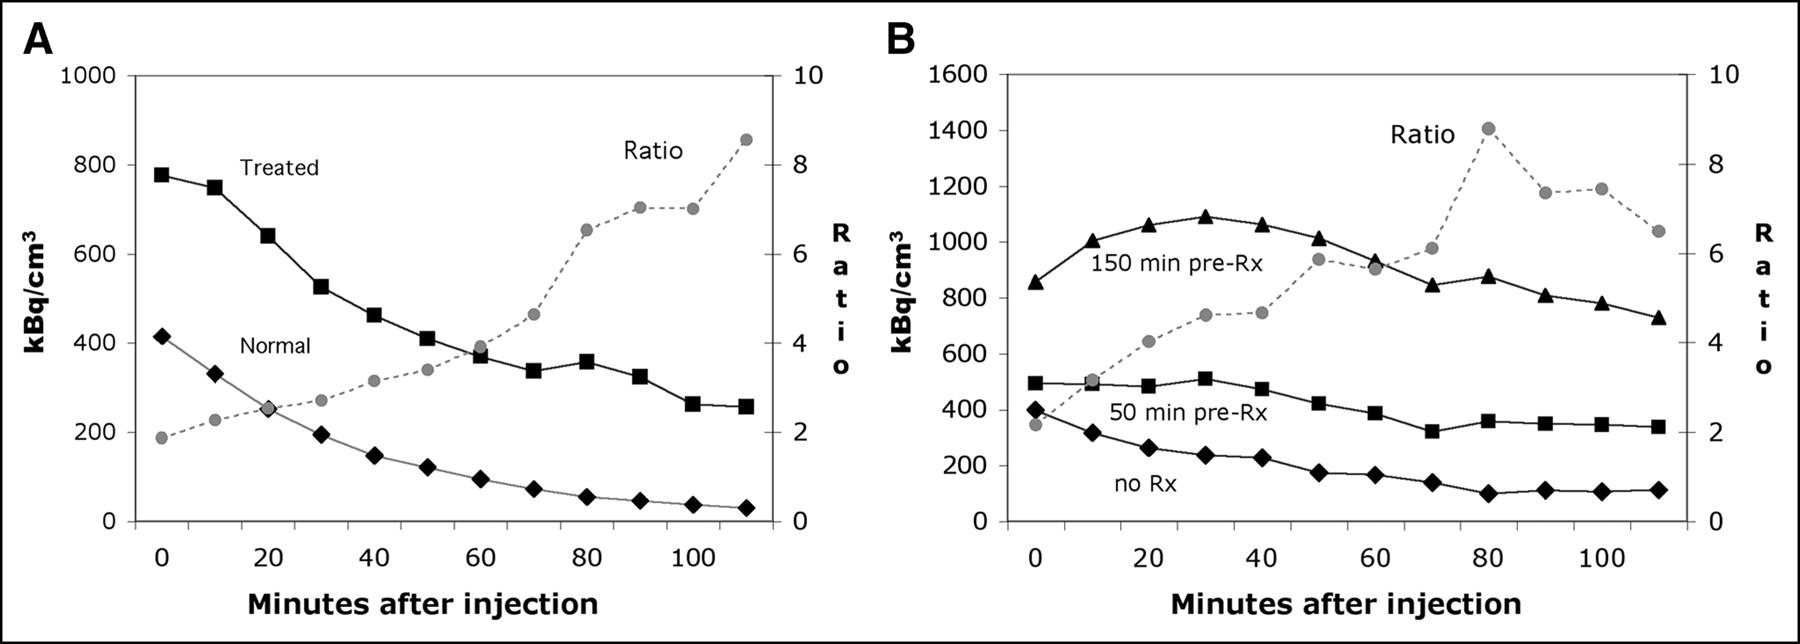
Figure 2A shows the time–activity curve for 18F-annexin V uptake, as well as the ratio of uptake (treated-to-untreated) from the imaging study represented in Figure 1. The ratio of 18F-annexin V uptake in treated versus untreated animals increased from 1.9 in the first time frame to 8.6 in the last frame. The time–activity curves from a similar study examining shorter cycloheximide pretreatments are shown in Figure 2B. These results again demonstrated increased 18F-annexin V uptake in the liver of treated rats, compared with the control. For the 50-min cycloheximide pretreatment, the ratio of 18F-annexin V uptake in the liver of the treated versus untreated rat increased from 1.25 to 3.0. For the 150-min pretreatment, the same ratio increased from 2.2 to a maximum of 8.8 in the 70-min time bin.

Time–activity curves for rat liver in 2 different imaging studies. (A) Time–activity curve is shown for liver of each animal imaged in Figure 1. Ratio of 18F-annexin V uptake in liver (treated over control) increased from 1.9 to 8.6 over course of imaging session. (B) Time–activity curves are shown for rat livers in second study, imaged after injection of approximately 44.4 MBq in each animal. Animals were untreated (no Rx), or pretreated for 50 and 150 min with cycloheximide before injection of radiotracer. Ratio of 18F-annexin V uptake in liver increased from 1.25 to 3.0 (50-min treatment) and from 2.2 to 6.5 (150-min treatment); only ratio line for 150-min treatment is shown.
To confirm the uptake of 18F-annexin V observed by PET, the imaged rats were dissected and the activity in the liver tissue was quantified by γ-counting. Comparison of 18F-annexin V activity in the liver at necropsy with the uptake displayed in the final frame of the imaging set indicated relatively close agreement between the uptake data (kBq/g) and the imaging data (kBq/cm3) after decay correction. The ratio of these 2 measures for 10 organs each from 3 animals averaged 0.98, with an SD of 0.51. Deviations from a value of 1.0 were due both to partial-volume effects and to the difficulties inherent in drawing accurate ROIs over organs of modest uptake in small animals. In general, organs of higher uptake showed less of this effect than organs of lower uptake. For example, the bladder and kidney (the organs of highest uptake) had average partial-volume corrections of 0.90 and 0.82, respectively, whereas lung and bone (tissues of lower density as well as lower uptake) had average corrections of 0.47 and 0.51, respectively. The value of this ratio for each individual organ allowed conversion of the kBq/cm3 inferred from imaging to the true kBq/g, which was used for calculating radiation-absorbed dose.
To confirm apoptosis in the cycloheximide-treated rats, we dissected the animals after PET and prepared liver sections for histologic examination. These liver sections showed increased apoptotic cell counts in animals that were exposed to cycloheximide for longer periods (Fig. 3A). The r2 value for the correlation between treatment time and percentage of apoptotic cells was 0.65; the error bars in the figure refer to separate fields scored in the same tissue section. Similarly, a smaller dose–response study, using the single treatment time of 3 h, found an increase in apoptosis with increasing concentrations of cycloheximide, with an r2 value of 0.87 (Fig. 3B). Although these graphs display linear regression lines, it is possible that the percentage of apoptotic cells in the liver approaches a plateau with either increased time or increased dose of cycloheximide treatment.

Correlation of apoptotic morphology and cycloheximide treatment conditions. (A) H&E-stained slides were made from paraffin blocks of liver samples from rats treated with cycloheximide (5 mg/kg) for times indicated. Slides were scored for percentage of apoptotic cells, scoring minimum of 15 fields per slide. Each data point represents single animal; error bars represent SD of mean value of all fields read from same slice. (B) H&E slides were similarly prepared and scored from rats treated for 90 min with the indicated concentrations of cycloheximide, before injection of 18F-annexin V. Because these rats were also imaged for 2 h after injection of radiotracer, total duration of exposure to cycloheximide was 210 min. Numbers of animals per data point were 4 for no Rx, 2 for 2 mg/kg, and 4 for 5 mg/kg; error bars refer to SD of mean values.
A more objective measure of apoptosis, the TUNEL assay, was also performed on liver slices. TUNEL quantitates the DNA breaks that are a characteristic feature of apoptosis (6). The TUNEL assay results for liver slices are presented in Figure 4; error bars refer to separate fields scored from the same liver slice. In all these studies, treatment with cycloheximide resulted in a significant increase in TUNEL-positive nuclei over the untreated control (P < 0.01). Additionally, longer treatment with cycloheximide generally resulted in an increased percentage of cells undergoing apoptosis. The lack of a significant difference in the size of the apoptotic cell population between the 2- and 4-h treatments (Fig. 4A) suggests that after 2 h, maximum apoptosis in the liver by cycloheximide was achieved. Similarly, Figure 4C indicates a negligible increase in TUNEL results between 90 and 150 min after injection of cycloheximide. This plateau effect is consistent with literature reports on the rate at which apoptosis progresses.
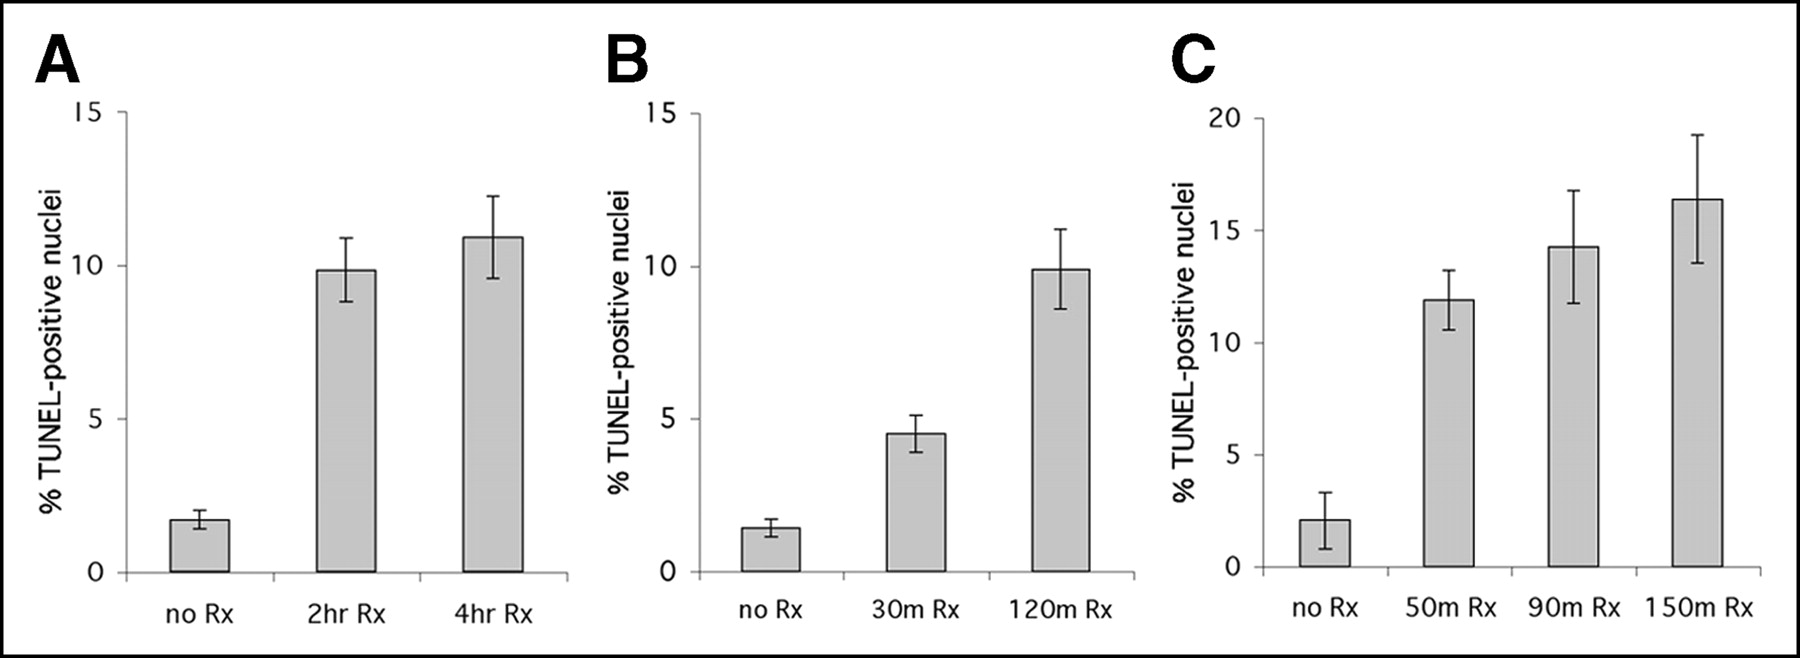
TUNEL assay of liver slices from 3 different imaging studies. Liver slices were subjected to TUNEL assay, and number of positive nuclei was counted (15–25 fields per slide). Untreated liver slices typically showed 1%–2% positive nuclei per field, whereas cycloheximide treatment resulted in 10%–16% positive nuclei. Panels show data from study in Figure 2A (2-h animal was not imaged) (A), data from separate study (B), and data from study in Figure 2B (90-min animal was not imaged) (C). Error bars refer to SD of mean.
A comparison of the TUNEL apoptosis results with 18F-annexin V uptake at the end of 120 min of imaging is shown in Figure 5. In the figure, each data point represents a single animal; the error bars in the x-axis reflect the SD for 15–20 fields reviewed for each liver specimen. This figure directly relates the in vivo measure of 18F-annexin V uptake (percentage injected dose per gram of liver tissue, y-axis) with an ex vivo measure of apoptosis (percentage of TUNEL positive nuclei per field, x-axis). A high correlation (r2 = 0.89) was found between the in vivo and ex vivo measurements.
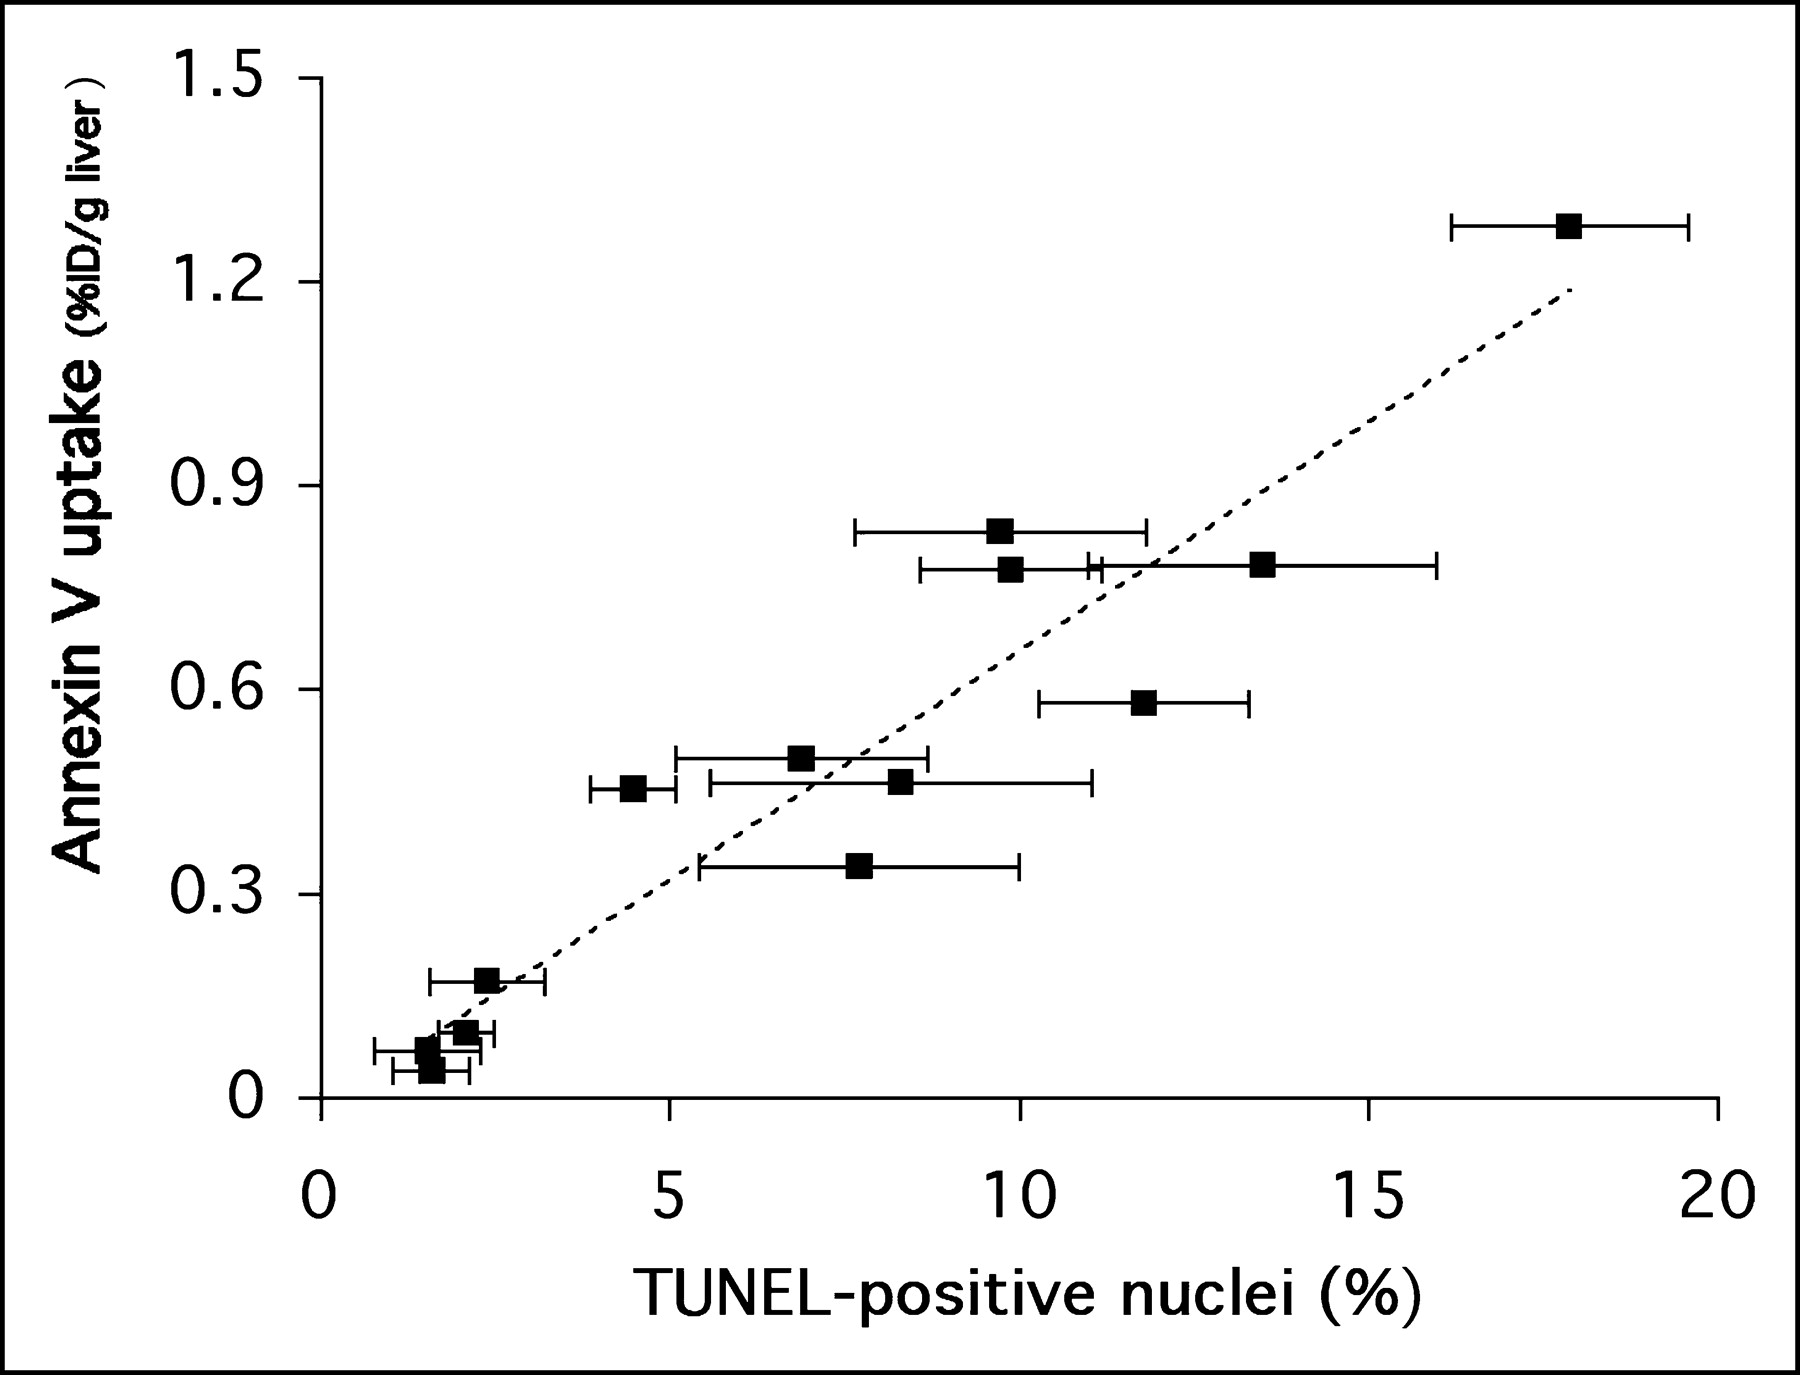
Regression analysis of 18F-annexin V uptake in liver tissue versus percentage of TUNEL-positive nuclei in liver tissue slices (r2 = 0.89). Analysis included data from the 3 studies presented in Figure 4, as well as other studies (n = 13 animals total; each data point represents 1 animal). Error bars refer to SD of mean for percentage of TUNEL-positive values.
The biodistribution of 18F-annexin V in untreated animals was also examined to determine background levels of uptake in normal rats. The levels of 18F-annexin V uptake in important internal organs of untreated rats after 2 h of PET imaging is shown in Table 1. The dominant organ of 18F uptake was the urinary bladder, with a level of activity per gram (in the urine) that was 15-fold higher than that of the kidney. After the bladder and kidneys, the organs of highest uptake were the lungs, liver, and spleen, whereas almost no 18F-annexin V was taken up by muscle, testes, or brain.
Biodistribution of 18F-Annexin V in Normal Rats
The kinetics of 18F-annexin V uptake in normal animals was also analyzed in detail. Figure 6 shows the time–activity curves for 4 different organs in normal rats during 2 h of PET data acquisition after injection of 18F-annexin V. The heart, liver, and kidney all showed high initial levels of 18F activity, representing early blood-pool distribution; the heart and liver had maximum activity levels in the 2-min time bin. Radioactivity cleared rapidly from the heart, with less than 7% of maximum still present 1 h after injection, and with a return to essentially background levels before 2 h. The liver and the kidney showed a more gradual loss of activity over time, but by 2 h activity in both organs had dropped to below 10% of maximum. The peak of activity in the kidney occurred at 10 min, at the same time that activity began to appear in the urine. After 1 h, activity in the kidney had decreased to 16% of maximum, and activity in the urine had risen to 87% of its eventual maximum. At the end of 2 h of imaging, nearly 70% of the injected dose of 18F-annexin V was found in the urine.

Time–activity curves of 18F-annexin V uptake in heart (A), liver (B), kidney (C), and urine/urinary bladder (D) in normal rats. Uptake is measured as radioactivity (in becquerels) per organ per kilobecquerel injected. These time–activity curves were generated from imaging study used to calculate dosimetry data in Table 2 and are based on ROIs drawn over most central (highest uptake) transaxial slice of organ in PET images, except for urinary bladder. Curves begin at time zero with injection of radiotracer. Data points represent values for each of 3 animals, and dotted line represents average of those values.
To translate the biodistribution data in rats into rough estimates of patient dose, a radiodosimetric analysis of 18F-annexin V was performed. This dosimetry analysis is presented in Table 2. These organ values were extrapolated from the data in Table 1 and Figure 6 to a 70-kg man, using the standard MIRD schema and S-tables (14–16). The dose values in Table 2 show that the organ receiving the highest radioactive dose in a human injected with 18F-annexin V would be the urinary bladder, followed by the kidneys, testes, spleen, and liver.
Radiation Dosimetry Comparisons
DISCUSSION
These results indicate that 18F-annexin V uptake in an in vivo model can accurately measure chemically induced apoptosis. The correlation of 18F-annexin V uptake with other measures of apoptosis (morphologic analysis and TUNEL staining) confirms that 18F-annexin V binds to liver tissue undergoing apoptosis. These results are similar to those published over the past several years for annexin V probes labeled with the single-photon emitter technetium (17–20). An inherent advantage of fluorine-labeled annexin over technetium-labeled annexin, however, is the higher spatial resolution and more accurate quantitation of PET compared with those of SPECT. A second advantage is the shorter half-life of 18F compared with that of 99mTc (1.83 vs. 6 h), which could result in lower overall doses to injected patients. Most important, the metabolized 18F-labeled probe is cleared more rapidly into the urine than are the several different 99mTc-labeled probes reported in the literature (4,17–22). Together, the rapid excretory clearance and short decay half-life of 18F-annexin V should result in a lower radiation dose to most internal organs than is the case with 99mTc-annexin V.
Several versions of 99mTc-annexin V have recently been investigated. A common characteristic reported for all 3 forms of 99mTc-annexin V is slow excretory clearance. The HYNIC (hydrazinonicotinamido) conjugated form of 99mTc-annexin V is the best characterized, and its biodistribution has been studied in both animals and humans. Two other conjugated forms have been studied in humans, those using bis(mercaptoacetyl)diaminopentanoyl (BTAP) conjugation and those using iminomercaptobutyryl (“i”) conjugation. In humans, 99mTc-i-annexin V remains in the kidney for a very long time, with uptake reaching a maximum at 2 h and staying at that level, decay corrected, for at least 24 h (21). 99mTc-BTAP-annexin V has maximal kidney uptake in patients at 2 h and decreases to <10% of maximum by 24 h (22). The HYNIC form shows maximal kidney uptake in patients at 4 h and decreases by only ∼15% at 24 h (4). In contrast, 18F-annexin V is rapidly cleared through the kidneys in normal rats: Within 2 h, kidney uptake has decreased to <6% of its maximum value (Fig. 6). A comparison of panels C and D in Figure 6 also makes clear that the 18F activity in the kidney passes directly into the urinary bladder.
The mechanism of this rapid urinary clearance of 18F-annexin V in rats has not yet been determined, but it is worth noting that a recent report on a radioiodinated version of annexin V in mice showed a similar pattern of rapid urinary clearance of the radiolabel (23). 124I-SIB-annexin V (derivatized with N-succinimidyl-3-iodobenzoic acid) was metabolized and excreted somewhat more rapidly than was 18F-annexin V, however. The percentage of injected dose found in the urine after 124I-SIB-annexin V injection reached its maximum by 30 min in mice (23), whereas in rats injected with 18F-annexin V the percentage in the urine was only half of maximum at that time (Fig. 6). Although a biologic difference between mice and rats cannot be ruled out, the likely explanation for this difference is the chemical bond strength of fluoride versus iodide. Whether the halide is fluorine or iodine, however, it is clear that the halogenated benzoic acid conjugate is preferred for metabolic removal and excretion over any of the forms of 99mTc-annexin V referred to here.
The kinetics of urinary accumulation of 99mTc-annexin V are not very detailed, but certain time point data have been published. In 2 human studies, excretion into the urine after 20 h was ∼21% of injected dose for the “i” conjugate (21) and ∼22% of injected dose after 24 h for the 1,2-BTAP conjugate (22). In 2 studies of the HYNIC conjugate in mice, <5% of the injected dose was found in the urine after 1 h (17,18). In a similar study in rats, ∼2% of the injected dose was in the urine after 1 h, increasing to only 3% at 3 h (20). In humans, 3% of the injected 99mTc-HYNIC-annexin V dose was in the urine after 3 h, with 23% in the urine after 24 h (4). Such slow accumulation of 99mTc-annexin V into the urine contrasts markedly with the bladder time–activity curve data for 18F-annexin V in rats: Nearly 70% of the injected dose was found in the urine after only 2 h (Fig. 6).
18F-Annexin V is cleared more rapidly from the liver in normal rats than is 99mTc-HYNIC-annexin V. In the rodent studies cited here, the normal liver in both mice and rats was reported to have 99mTc uptake of between 12% and 21.6% of the injected dose 1–3 h after injection of 99mTc-HYNIC-annexin V (17,18,20). On the other hand, 2 h after injection of 18F-annexin V into normal rats, the liver retained just over 1% of the injected dose (Table 1 and Fig. 6). The more rapid clearance of 18F-annexin V from both the kidneys and the liver suggests that it will be more useful than 99mTc-annexin V for imaging in the abdominal region. However, a recently developed version of 99mTc-annexin V has substantially circumvented this problem of slow clearance from the liver and kidney. Using protein engineering to create a novel conjugation site, the authors reported that 1 h after injection of 99mTc-117-annexin V in mice, 6.2% of the injected dose was in the kidney and 6% was in the liver; these values compare with 39.2% in the kidney and 16.6% in the liver after injection of the HYNIC conjugate in the same study (10). The data from the time–activity curves presented in Figure 6 show that these same values for 18F-annexin V were 3.3% and 4% for kidney and liver, respectively, in rats.
Thus, whereas initial uptake of 18F-annexin V by the liver and kidneys is high, precluding imaging in that region at early times, 18F-annexin V is cleared from these organs rapidly. Therefore, abdominal imaging of apoptosis should have substantially lower background activity with 18F-annexin V than with most forms of 99mTc-annexin V. (Although the uptake of 18F in the kidney has not been characterized, it is likely due to retention of small-molecular-weight peptide breakdown products in the proximal renal tubules (24,25) and possibly some intact 18F-annexin V.) The radiolabeled metabolites are excreted so rapidly into the urine that this uptake should not be a concern for imaging of organs near the kidneys. Because of the 36-kDa molecular weight of 18F-annexin V, it does not cross the blood–brain barrier and so will not be useful for measuring apoptosis occurring within the brain.
An inevitable result of rapid excretion via the kidneys is high accumulation of radiolabel in the urinary bladder. The dosimetry results in Table 2 indicate a high radiation-absorbed dose to the urinary bladder of a subject injected with 18F-annexin V, the result of the rapid and specifically renal excretion of 18F-annexin V. An important advantage to this rapid excretion rate is that the background levels of uptake in nonapoptotic tissues are lower than is the case with the 99mTc-labeled protein. A disadvantage of this concentrated uptake in the urinary bladder is that the patient receiving an injection of 18F-annexin V will likely have to be catheterized; on the other hand, removal of the radioactive urine has the benefit of lowering the overall radiation exposure to the patient. An 18F-fluoride bone scan also involves almost exclusively renal excretion (albeit with ∼50% retained in the skeleton), and patients are routinely catheterized for this procedure. For purposes of comparison, literature values for radiation doses from bone scan procedures (16) are included in Table 2. Finally, it should be noted that the dosimetry calculations in Table 1 are extrapolations to a 70-kg man from data obtained in 250-g male rats and so should be viewed as preliminary estimates. Human clinical studies will be needed to obtain accurate human dosimetry values.
Finally, the issue of apoptosis-specific binding needs to be addressed. The binding of 18F-annexin V in the cycloheximide-treatment model presented here is presumed to be due to apoptosis, for the reasons stated earlier in this discussion. Inspection of Figure 5 shows that the regression line passes through the origin; this is further evidence that annexin V binding in cycloheximide-treated liver tissue was specifically due to the exposure of phosphatidylserine by apoptosis. However, it should be noted that phosphatidylserine exposure is not exclusive to apoptosis, since necrotic cells can also display phosphatidylserine to the extracellular medium, after loss of membrane integrity. In necrosis, this process does not require energy and is not genetically programmed as it is in apoptosis, but the end result of phosphatidylserine presentation to the external medium can be the same. In vitro, it is possible to distinguish between normal, apoptotic, and necrotic cells by analyzing the “staining” pattern of 2 biochemical treatments, annexin binding and uptake of propidium iodide. Organic dyes such as propidium iodide are excluded by actively metabolizing cells with intact membranes. Apoptotic cells, which bind annexin V, do not stain with propidium iodide, since their cell membranes are still intact. Necrotic cells, on the other hand, stain with both annexin V and propidium iodide, whereas normal cells stain with neither. Because this type of analysis cannot be performed in vivo, the verification that annexin V uptake in vivo is due solely to apoptosis, with no contribution from necrosis, will require the assay of other apoptotic markers. For this reason, early clinical trials of 18F-annexin V should include biopsy of tissue samples that can be analyzed for phosphatidylserine-independent markers of apoptosis. Thus, we agree that 18F-annexin V uptake should ideally be referred to as a measure of cell death rather than of apoptosis per se, as was recently recommended in the interpretation of 124I-SIB-annexin V images (23).
CONCLUSION
Our laboratory is examining 18F-annexin V as a PET probe to quantify cell death in vivo. In a rat model of apoptosis, 18F-annexin V was rapidly cleared from the blood and excreted almost exclusively into the urine. Similar results were recently shown with 124I-SIB-annexin V in a mouse tumor model (23). This rapid clearance will result in high image contrast between healthy and dying tissues within 1 h after injection of 18F-annexin V. The ability to accurately measure internal levels of apoptosis noninvasively will be of significant clinical value in the treatment of cancer, as well as in other human diseases that result from abnormal levels of apoptosis. Before it progresses to human trials, it will be informative to use 18F-annexin V to measure the kinetics of apoptosis in in vivo animal models of tumor chemotherapy and immunotherapy.
Acknowledgments
This work was supported by grants CA42045 and S10 RR17229 from the National Institutes of Health. We thank Dr. Winfried Brenner for assistance with animal dissection, Lydia Yang for preparation of paraffin blocks and tissue slices, and Dr. Denny Liggit for assistance with morphologic analysis of apoptosis. Drs. Oliver Press and Ajay Gopal provided useful advice during these initial studies. We also thank Theseus Corp. for its encouragement of this project.
Footnotes
Received Sep. 27, 2004; revision accepted Dec. 8, 2004.
For correspondence or reprints contact: Kevin J. Yagle, PhD, Department of Radiology, Molecular Imaging Laboratory, UWMC Box 356004, University of Washington, Seattle, WA, 98195.
E-mail: kyagle{at}u.washington.edu
REFERENCES
In this issue


Jump to section
Related Articles
Cited By...
- Microglia Play an Active Role in Obesity-Associated Cognitive Decline
- The Use of Novel PET Tracers to Image Breast Cancer Biologic Processes Such as Proliferation, DNA Damage and Repair, and Angiogenesis
- Preclinical Kinetic Analysis of the Caspase-3/7 PET Tracer 18F-C-SNAT: Quantifying the Changes in Blood Flow and Tumor Retention After Chemotherapy
- Noninvasive Molecular Imaging of Apoptosis in a Mouse Model of Anthracycline-Induced Cardiotoxicity
- A Peptide-Based Positron Emission Tomography Probe for In Vivo Detection of Caspase Activity in Apoptotic Cells
- Biodistribution and Radiation Dosimetry of 18F-CP-18, a Potential Apoptosis Imaging Agent, as Determined from PET/CT Scans in Healthy Volunteers
- Apoptosis Imaging Probe Predicts Early Chemotherapy Response in Preclinical Models: A Comparative Study with 18F-FDG PET
- Hyperpolarized 13C MRI and PET: In Vivo Tumor Biochemistry
- 18F-ML-10, a PET Tracer for Apoptosis: First Human Study
- Evaluation of Chemotherapy Response in VX2 Rabbit Lung Cancer with 18F-Labeled C2A Domain of Synaptotagmin I
- In Vivo Molecular Imaging Analysis of a Nasal Vaccine That Induces Protective Immunity against Botulism in Nonhuman Primates
- Small-Molecule Biomarkers for Clinical PET Imaging of Apoptosis
- Application of PET/CT in the Development of Novel Anticancer Drugs
- Tumor-Specific Positron Emission Tomography Imaging in Patients: [18F] Fluorodeoxyglucose and Beyond
- Monitoring targeted therapy: is fluorodeoxylucose uptake a marker of early response?
- Positron Emission Tomography As an Imaging Biomarker
- The Progress and Promise of Molecular Imaging Probes in Oncologic Drug Development