


Abstract
In patients with non–insulin-dependent diabetes mellitus (NIDDM), FDG PET imaging is often problematic because of poor uptake of FDG. Different protocols have been used; however, these have not been directly compared in patients with NIDDM who have both coronary artery disease (CAD) and severe left ventricular (LV) dysfunction, for which defining viability is most relevant. The aim of this study was to better define the optimal means of FDG PET imaging, assessed by image quality and myocardial glucose utilization rate (rMGU), among 3 imaging protocols in patients with NIDDM, CAD, and severe LV dysfunction. Methods: Ten patients with NIDDM, CAD, and severe LV dysfunction (mean ejection fraction, 29.8% ± 7.1%) underwent dynamic FDG PET scanning using 3 different protocols: the standard protocol, consisting of oral glucose loading or a supplemental insulin bolus based on fasting glucose; the niacin protocol, consisting of pretreatment with niacin to lower free fatty acids; and the insulin clamp protocol, consisting of hyperinsulinemic euglycemic clamp. Image quality was satisfactory with at least 1 approach in 8 patients, who formed the primary analysis group. Results: Myocardium–to–blood-pool ratios were significantly higher with the insulin clamp (standard, 1.7 ± 1.2; niacin, 1.6 ± 1.0; insulin clamp, 3.4 ± 2.5 [P < 0.05 vs. standard and niacin]). Values for rMGU were higher with the insulin clamp (standard, 0.11 ± 0.07 μmol/g/min; niacin, 0.12 ± 0.11 μmol/g/min; insulin clamping, 0.22 ± 0.12 μmol/g/min [P = 0.004 vs. standard and 0.07 vs. niacin]). Conclusion: The hyperinsulinemic euglycemic clamp yielded the highest FDG PET image quality and the highest rMGU in a comparison with the standard and niacin protocols in this difficult group of patients with NIDDM, CAD, and severe LV dysfunction. The hyperinsulinemic euglycemic clamp may be the preferred method for FDG PET viability imaging in this population. Larger clinical trials are needed to assess whether accuracy is greater with this approach.
Cardiac 18F-FDG PET imaging is a useful diagnostic tool in the assessment of myocardial viability (1–4) and can influence decision making in patients with reduced left ventricular (LV) function (5). However, FDG PET imaging in patients with non–insulin-dependent diabetes mellitus (NIDDM) is problematic because of poor uptake of FDG (6,7).
In the past, FDG PET studies often excluded patients with diabetes or included very few such patients (2–4,7–10). Protocols applying standard oral glucose loading have yielded poorer image quality and a lower rate of myocardial glucose utilization (rMGU) in patients with NIDDM than in nondiabetic patients (6,11).
Approaches to improve on standard protocols have included the use of the hyperinsulinemic euglycemic clamp and the use of nicotinic acid or its derivative (6,8–11). Although studies have evaluated 1 or 2 of these 3 protocols in patients with and without coronary artery disease (CAD) and with or without diabetes (6,8–11), the 3 approaches (standard, insulin clamp, and nicotinic acid) have not been directly compared in the same study, nor have they been compared in patients with CAD and NIDDM who have severe LV dysfunction, for which viability definition is most relevant.
The objective of this study was to compare image quality as assessed by the myocardium–to–blood-pool activity ratio (M/B) and to compare the rMGU between 3 imaging protocols: oral glucose loading (the standard protocol), lowering free fatty acids using nicotinic acid (the niacin protocol), and the hyperinsulinemic euglycemic clamp (the insulin clamp protocol) in patients with CAD, NIDDM, and severe LV dysfunction. This comparison would help determine the optimal approach for imaging this difficult group of patients.
MATERIALS AND METHODS
Patients
Ten patients (8 men, 2 women; mean age ± SD, 59 ± 8 y) participated in the study. All had NIDDM; CAD, with >50% stenosis as determined by angiography; and severe LV dysfunction, which was defined as an LV ejection fraction < 40% (LV ejection fraction range, 15%–38%; mean LV ejection fraction, 29.8% ± 7.1%) as determined by radionuclide angiography. Four of the 10 patients had undergone previous coronary artery bypass grafting. All patients were receiving oral hypoglycemic agents; no patients were receiving insulin. The mean duration of diabetes mellitus was 10.9 ± 8.0 y. Data on other end-organ complications of diabetes were available for 9 of the 10 patients. Four patients had a history of retinopathy, and 3 had an elevated level of creatinine (>120 μmol/L). The mean body mass index was 29.1 ± 2.7 kg/m2.
The project was approved by the research ethics committee at the Ottawa Civic Hospital for the University of Ottawa Heart Institute (Ottawa, Ontario, Canada). Informed consent was obtained from each patient as a prerequisite to inclusion in the study.
Sestamibi SPECT and FDG PET Imaging Protocol
For evaluation of myocardial perfusion, the patients underwent 99mTc-sestamibi (99mTc-MIBI) SPECT imaging at rest. 99mTc-MIBI (740 MBq [20 mCi]) was administered intravenously. One hour later, each patient was positioned supine under a SPECT camera (ZLC 3700 Digitrac; Siemens Medical Systems, Hoffman Estates, IL) equipped with a high-resolution collimator. The camera was rotated clockwise through 180°, starting at a −45° right anterior oblique angle and using 25 s per view, 64 views, and a 64 × 64 word matrix. MIBI projection data were then reconstructed into transaxial views by applying a Butterworth filter with a cutoff frequency of 0.66 Nyquist and a filter order of 5.0. Transaxial views were then transferred to the PET system for analysis.
Each patient underwent FDG PET imaging using the 3 different protocols. All 3 protocols were performed in the morning after an overnight fast. The scans were obtained in a random order within a 2-wk period. The patients took their oral hypoglycemic medications on the morning of the test.
Standard Protocol.
An oral glucose load and insulin boluses were administered according to the fasting plasma glucose level using a standard protocol (12). For a fasting plasma glucose level < 7 mmol/L, 25 g oral glucose solution (Glucodex; Rougier Inc., Chambly, Quebec, Canada) without intravenous insulin were given; for a 7–11 mmol/L fasting plasma glucose level, 5 IU intravenous insulin were given; and for a fasting plasma glucose level > 11 mmol/L, 10 IU intravenous insulin were given. The plasma glucose level was measured again after 15 min, and insulin was administered accordingly: For <8 mmol/L, no insulin was administered; for 8–11 mmol/L, 5 IU intravenous insulin were administered; and for >11 mmol/L, 10 IU intravenous insulin were administered (12). FDG was injected within 1 h of the oral glucose load (12).
Hyperinsulinemic Euglycemic Clamp.
A standard approach to the hyperinsulinemic euglycemic clamp was used (13). After patients had fasted overnight, a 20-gauge polyethylene cannula was inserted into a superficial vein of their forearm for infusion of glucose and insulin. A second cannula was threaded retrogradely into the superficial vein of the hand on the opposite arm, which had been arterialized using a heating pad set at 50°C. Sixty minutes before the anticipated FDG administration, a primed constant insulin infusion (40 mU/min/m2 of body surface area) was started. The patients’ arterial blood glucose levels were checked every 5 min from the retrograde cannula. Glucose infusion rates were adjusted accordingly, with an aim of maintaining baseline glucose levels (13). Once steady state was achieved, as indicated by 3 consecutive blood glucose values that were within ±5% of one another, FDG was administered.
Niacin.
Each patient received 250 mg niacin orally at 60, 30, and 1 min before FDG injection, as described by Stone et al. (9). The patients also received 650 mg acetylsalicylic acid 15 min before the first niacin dose to reduce flushing and the vasodilatory effect of niacin (9).
Image Acquisition.
During the initial phase of each protocol, the patients were positioned in a whole-body ECAT ART PET camera (Siemens/CTI PET Systems, Knoxville, TN). A 30-min transmission image was acquired for attenuation correction.
FDG in the amount of 60–100 MBq was administered, and 70 min of dynamic imaging followed. Thirty-six frames were obtained (12 × 10 s, 6 × 20 s, 6 × 60 s, and 12 × 300 s). Forty-seven tomographic images were reconstructed at each time point. Images were reconstructed with a Hann filter of 0.35 cycles per pixel, resulting in a spatial resolution of 12 mm in all 3 dimensions.
Blood Glucose, Insulin, and Free Fatty Acid
Blood glucose, insulin, and free fatty acid were sampled at −60, −1, 10, 25, 40, 55, and 70 min, with 0 min being the point of FDG injection. For analysis, the time points were designated as fasting (−60 min), pre-FDG (−1 min), and post-FDG (mean of samples obtained after imaging).
Data Analysis
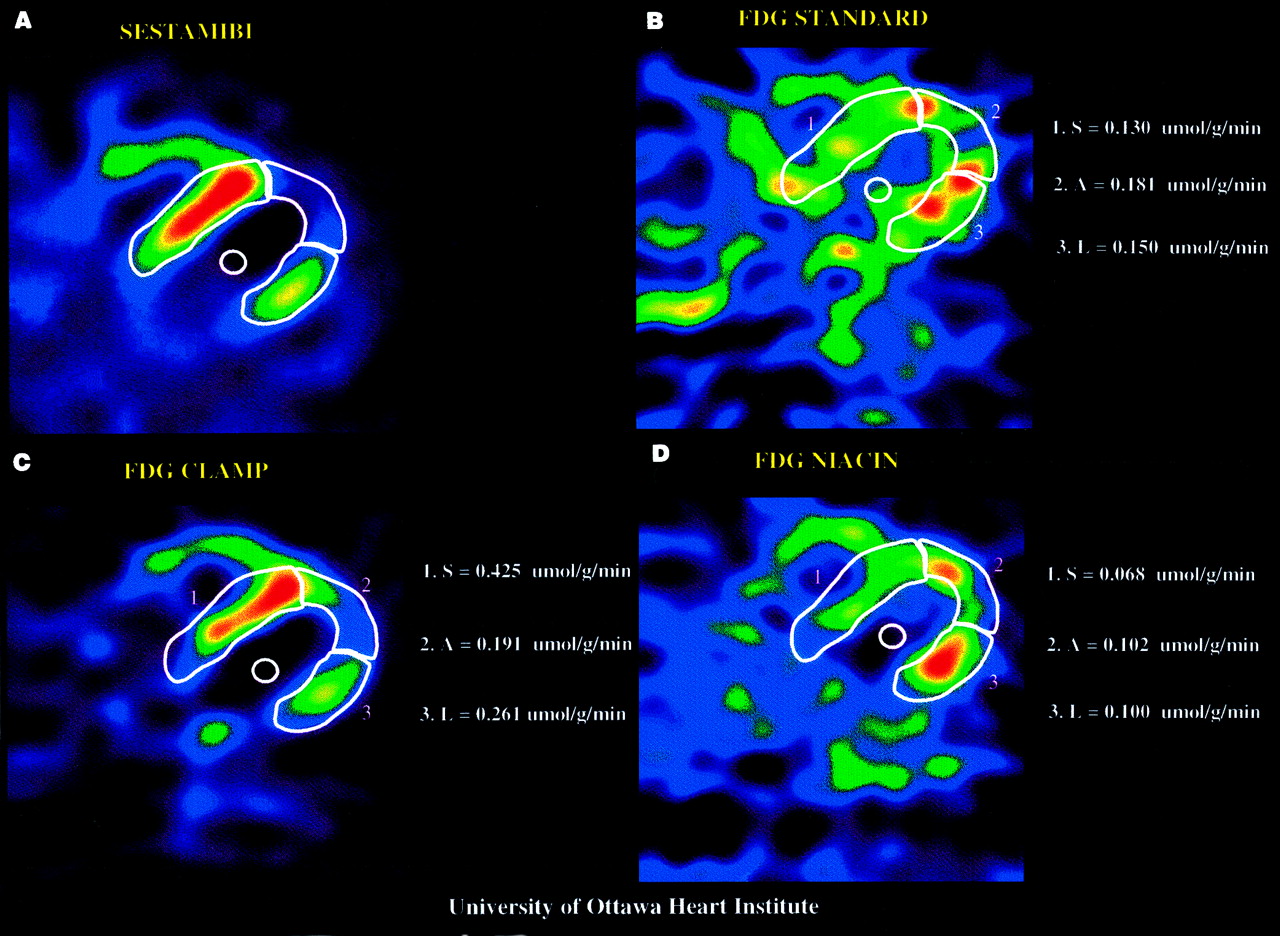
The data were analyzed with blinding of the clinical data and the imaging approach. For each patient, midventricular transaxial slices from the last time frame of the 3 FDG PET images and the MIBI SPECT perfusion image were visually aligned for direct comparison (Fig. 1).

Representative midventricular transaxial images obtained with MIBI SPECT perfusion imaging (upper left) and with standard (upper right), insulin clamp (lower left), and niacin (lower right) FDG PET protocols. Each image is normalized to its own maximum. Segmental ROIs on septum (1), apex (2), and lateral wall (3) of perfusion image have been applied to FDG images. Septum was considered to have normal perfusion. rMGU values for each segment are shown at right of image. FDG insulin clamp yielded highest regional rMGUs.
Region-of-interest (ROI) analysis of both perfusion SPECT and 18F-FDG PET images was performed using PET ECAT, version 7.0, analysis software. ROIs were defined for the LV myocardium and the LV blood pool on the perfusion image as previously described (14). These ROIs were then applied to the last time frame on each of the 3 FDG PET images at the corresponding midventricular transaxial plane.
When FDG uptake was poor with 1 or 2 of the 3 approaches, locating the appropriate plane on the FDG PET image was more difficult. In these cases, the early frames of the dynamic sequence were used to define the plane with the LV cavity shape that best corresponded to the appropriate myocardium ROI from the perfusion image. The LV myocardium ROI and blood-pool ROI defined from the perfusion image were then applied to the last time frame of the corresponding FDG PET images. When FDG uptake was poor with all 3 FDG images, this approach was still applied but was considered less reliable and the patients were excluded from the primary analysis.
Image Quality (M/B).
The last 6 frames of dynamic FDG imaging were summed for image quality analysis. The uptake, in mean counts, was determined for LV myocardium and blood-pool ROIs. The M/B was then calculated. Images were considered good, adequate, or poor when M/Bs were >1.5, 1.1–1.5, or <1.1, respectively.
Rate of Myocardial FDG Uptake and Glucose Utilization.
The rate of myocardial FDG uptake (K) was calculated using the graphic analysis of Patlak and Blasberg (15). This mathematic model uses the tissue time–activity curves to determine a combined rate constant, K, for FDG myocardial entry and phosphorylation (15). This approach defines the relationship between myocardial activity (Cm(t)) corrected for blood-pool activity (Cb(t)) and the relationship between the integral of Cb(t) from time 0 to a time “t” corrected for the blood activity at that time t (∫Cbdt/Cb(t)). This relationship becomes linear after equilibration of tissue FDG (approximately 5 min). K is the slope of the linear portion of this relationship. To determine the rMGU, K was multiplied by the mean of 5 blood glucose samples taken after FDG injection and divided by the lumped constant (LC) (a value of 0.67 was used for LC): rMGU = (K × [Glu])/LC (15).
Regional Analysis.
Moderate and severe perfusion defects were identified visually on the transaxial MIBI SPECT perfusion images. Myocardial ROIs were defined over normal perfusion zones, over moderate defects, and over severe defects (Fig. 1). Depending on the number and extent of perfusion defects, 3 or 4 myocardial ROIs were defined for each patient. (In total, 29 segments were defined among the 8 patients with at least 1 interpretable FDG image.) Myocardial MIBI uptake was expressed as a percentage of the uptake in the segment with maximal perfusion for a given patient. These regions were then applied over each of the 3 FDG PET images. The regional rMGU was determined and compared between segments with maximal perfusion (80%–100% uptake [n = 14]), a moderate perfusion defect (50%–79% [n = 9]), and a severe perfusion defect (<50% [n = 6]).
Statistical Analysis.
ANOVA was performed on M/B and rMGU and on glucose, free fatty acid, and insulin profiles. For the segmental analysis, the 3 approaches were compared at each level of perfusion, also using ANOVA. When a difference was detected by ANOVA, paired t testing was used to compare individual imaging protocols. When probability values were between 0.025 and 0.05, the Fisher least significant difference (LSD) test was also applied as a test for multiple comparisons. All results are expressed as mean ± SD.
RESULTS
Among the 10 patients enrolled, 2 had poor FDG uptake with all 3 approaches and were therefore excluded from the primary analysis of data.
Glucose, Insulin, and Free Fatty Acid
Fasting plasma glucose levels were similar with the 3 protocols: 7.6 ± 2.9 mmol/L (standard), 6.8 ± 2.4 mmol/L (niacin), and 8.3 ± 3.5 mmol/L (insulin clamp) (P = not statistically significant [NS]). No significant change in glucose levels was seen after FDG injection with any of the 3 protocols (Fig. 2A).

Glucose (A), free fatty acid (FFA) (B), and insulin (C) profiles under fasting conditions (black bars) and before (white bars) and after (hatched bars) FDG administration. Free fatty acid: *P < 0.02. Insulin: *P ≤ 0.05 vs. fasting; †P < 0.001 vs. fasting.
Fasting free fatty acid levels were also similar. As expected, free fatty acid levels decreased significantly with both the niacin protocol (from 142 ± 74 μg/mL at baseline [fasting] to 35 ± 8 μg/mL after FDG [P < 0.01]) and the insulin clamp protocol (from 123 ± 45 μg/mL at baseline [fasting] to 36 ± 14 μg/mL after FDG [P < 0.01]) but not with the standard protocol (from 107 ± 26 to 94 ± 49 μg/mL [P = NS]) (Fig. 2B).
Insulin levels increased with the insulin clamp protocol (from 135 ± 89 pmol/L at baseline [fasting] to 523 ± 104 pmol/L before FDG to 625 ± 167 pmol/L after FDG [P < 0.001 for baseline vs. before and after FDG]), whereas with the standard and niacin protocols, the respective insulin levels showed only minor changes or trends (81 ± 40, 181 ± 113, and 116 ± 58 pmol/L with the standard protocol [P = 0.024 for baseline vs. before FDG] and 112 ± 81, 191 ± 160, and 139 ± 101 pmol/L with the niacin protocol [P = 0.05 for baseline vs. before FDG]) (Fig. 2C).
Image Quality (M/B)
M/B was significantly higher with the insulin clamp (3.4 ± 2.5) than with either the standard (1.7 ± 1.2) or the niacin (1.6 ± 1.0) protocol (P = 0.034 vs. standard and 0.021 vs. niacin; with LSD test, P = 0.047 and 0.044, respectively). Of the 8 patients with at least 1 interpretable image, the number of patients with good-quality images (M/B > 1.5) for the clamp, standard, and niacin was 6, 2, and 4, respectively; adequate-quality images (M/B = 1.1–1.5) were obtained for 2, 4, and 0 patients, respectively; and poor-quality images (M/B < 1.1) were obtained for 0, 2, and 4 patients, respectively.
rMGU
Whole-myocardium rMGUs were significantly higher with the insulin clamp (0.22 ± 0.12 μmol/g/min) than with the standard protocol (0.11 ± 0.07 μmol/g/min [P = 0.004]) and showed a trend toward statistical significance when compared with the niacin protocol (0.12 ± 0.11 μmol/g/min [P = 0.07]).
Regional rMGU
Regional rMGU was significantly higher with the insulin clamp (0.25 ± 0.16 μmol/g/min in regions with maximal perfusion [80%–100%]) than with either the standard (0.11 ± 0.09 μmol/g/min) or the niacin (0.13 ± 0.11 μmol/g/min) protocol (P = 0.002 vs. standard and 0.035 vs. niacin; with LSD test, P = 0.006 and 0.042, respectively). In segments with moderate and severe perfusion defects, no statistically significant differences were detected among the 3 protocols (Fig. 3).
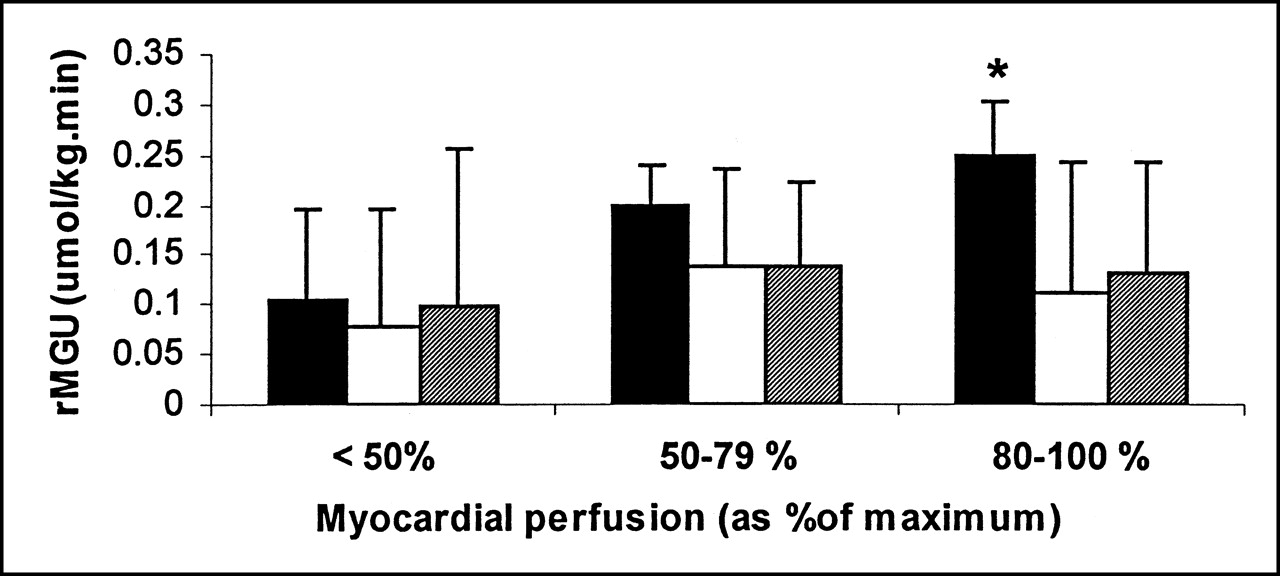
Comparison of rMGU among 3 protocols (insulin clamp [black bars], standard [white bars], and niacin [hatched bars]) for segments of different myocardial perfusion. *P < 0.05 for insulin clamp vs. niacin and standard protocols.
DISCUSSION
The hyperinsulinemic euglycemic clamp protocol produced a significantly higher M/B than did either the standard or the niacin protocol in this study of patients with NIDDM, CAD, and severe LV dysfunction. The insulin clamp also produced a significantly higher rMGU than did the standard protocol and showed a trend toward statistical significance compared with the niacin protocol. Furthermore, the insulin clamp protocol showed a significantly increased rMGU in segments with maximal perfusion compared with the standard and niacin protocols.
Previous studies of nondiabetic patients have shown that FDG PET imaging using any of the 3 protocols can yield interpretable images (7,9,10,16,17). However, the insulin clamp approach yielded images that had increased M/B and rMGU compared with images after standard oral glucose loading (8). More recently, fatty acid–lowering protocols using nicotinic acid derivatives yielded M/Bs and rMGUs similar to those of the insulin clamp protocol (10,18).
In patients with NIDDM, standard oral glucose loading protocols have led to suboptimal images (6,7). The insulin clamp, on the other hand, produced images that were better in terms of M/B and rMGU (11) but were still inferior to images of nondiabetic patients (6). A study by Knuuti et al. (10) compared fatty acid lowering using the nicotinic acid derivative acipimox with the insulin clamp in 7 patients. That study found that in patients with NIDDM and CAD, M/Bs were comparable (9.2 ± 3.5 for insulin clamp vs. 6.4 ± 4.1 for acipimox), as was rMGU (0.74 ± 0.32 μmol/g/min for insulin clamp vs. 0.57 ± 0.27 μmol/g/min for acipimox). However, the patients had only mild LV dysfunction (mean LV ejection fraction, 49%). In the current study, the mean ejection fraction was much lower at 29.8% ± 7.1%. Knuuti et al. also used the nicotinic acid derivative acipimox as their fatty acid–lowering agent, in contrast to the niacin that was used in the current study. The differences in the rMGUs and M/Bs between the current study and that of Knuuti et al. most likely reflect differences in patient population, including different severities of LV dysfunction, with associated myocardial perfusion and metabolism abnormalities, and, possibly, different levels of insulin resistance.
A study by Ohtake et al. (11), involving 8 patients with NIDDM but no CAD, found that the insulin clamp produced better M/Bs (9.3 ± 3.3 vs. 1.9 ± 1.3) and rMGUs (0.42 ± 0.12 μmol/min/g vs. 0.27 ± 0.17 μmol/min/g) than did a standard oral glucose loading protocol. Our results show that this finding also applies to patients with CAD and LV dysfunction.
The results obtained from regional rMGU analysis indicate that FDG uptake in maximally perfused myocardium is particularly enhanced by the clamp protocol, compared with the niacin and standard protocols. However, in the regions of lowest perfusion, which may contain a mixture of ischemic and scar tissue, the difference in rMGU between the 3 protocols was not significant. Similar preliminary findings have been reported by Gerber et al. (19), who compared fasting and insulin clamp protocols in nondiabetic patients. One possible explanation for this difference in glucose utilization may be the increase in recruitment of glucose transporter (GLUT)-4, which has been shown to be sensitive to insulin (20). It is possible that this increase does not occur to the same degree in hypoperfused tissue. Alteration in GLUT-1 and GLUT-4 expression has been proposed for hibernating tissue (21,22). Alternatively, the responsiveness of GLUT-4 to insulin suggested in previous studies of ischemia (23) may be altered in diabetic myocardium. Tissue differences in the responsiveness of hexokinase to the lipolytic effects of insulin (18,24,25) may play a role, but this possibility is less likely because a similar effect was not observed with niacin, which also lowered free fatty acids. This hypothesis of altered regional responsiveness in diabetes requires further study at the tissue level.
The observations of the current study have potential clinical implications. The clamp approach may allow interpretation of images that were of poor quality from the standard approach. In addition, tissue characterization on image interpretation may be altered because FDG uptake is generally normalized to the region with maximal perfusion and the insulin clamp appears to preferentially enhance FDG uptake in the normal zone. To address this possibility further, we reviewed the 15 moderate-to-severe perfusion defects. Among these, 4 regions (27%) were from poor-quality scans with the standard protocol but not with the clamp protocol (3 matches and 1 mismatch). Among the 11 remaining regions, 2 with a predominate match using the clamp were a mismatch by the standard protocol. Two other regions were a partial mismatch (mixture of scar and hibernating tissue) using the clamp and a mismatch by the standard protocol. Thus, the insulin clamp affected interpretability in 4 (27%) of 15 regions and, among interpretable hypoperfused segments, had at least a partial impact on tissue characterization in 4 (36%) of 11. The improvement in image quality and uptake of FDG with the insulin clamp favors the clamp approach. However, patients were not necessarily candidates for revascularization. Therefore, the study could not evaluate the accuracy of the different FDG imaging protocols for predicting LV recovery. Further clinical studies evaluating accuracy on a larger scale are required.
One limitation of this study was the small sample size, although it was comparable to the number of patients included in 2 previous studies evaluating FDG in diabetic patients (10,11). The sample size was sufficient to show significant differences with the insulin clamp approach. Two patients were excluded from analysis because of poor FDG uptake with all 3 techniques. The first of these patients had a moderate inferolateral wall perfusion defect. The second had large anteroseptal and inferolateral perfusion defects. These patients had no particular distinguishing parameters, except that one patient had had diabetes for 22 y and the other patient had an elevated blood glucose level at fasting and during insulin clamp (13.8 and 13.6 mmol/L, respectively), along with a post-FDG fatty acid level (63 μg/mL) that was higher than that of the other patients (36 ± 14 μg/mL) despite a 5-fold increase in insulin. Because exclusion of these patients may bias the results in favor of 1 technique, we did a secondary analysis that included the best possible data from all 10 patients. The statistically significant differences were similar both for M/B and for rMGU, supporting the suggestion that the clamp approach yields improved image quality. However, these 2 patients showed that even with the clamp technique, FDG imaging in such patients can be challenging. Whether a combined approach of using a nicotinic acid derivative with insulin can further enhance image quality in such patients requires further study.
This study included only patients with type II diabetes (NIDDM), for which insulin resistance plays a predominant role. Patients with type I diabetes mellitus, however, have an insulin deficit. With the different imaging approaches, they may show results different from those of patients with type II diabetes.
The calculation of rMGU was based on the use of an LC of 0.67 (26). Recent data suggest that in a nonsteady state, determination of rMGU may be less accurate because of varying LCs (27,28). Botker et al. (28) suggested that at insulin levels < 100 pmol/L, LC increased linearly with increases in insulin levels. LC decreased when insulin levels were >100 pmol/L. In this study, with the insulin clamp, insulin levels reached 625 ± 167 pmol/L, and thus, this group may have a lower LC than do the other groups. Therefore, our results may underestimate the true difference in rMGU between the insulin clamp protocol and the other 2 protocols. However, the variability in LC has not been well evaluated in patients with significant coronary disease and diabetes. Thus, a fixed-LC approach was used in the current study, as had been applied in previous studies (6,8,9,10,11). The rMGU reflects glucose utilization, which in turn reflects FDG uptake. The image quality data, measured as M/B, also support the greater FDG uptake and rMGU observed with the insulin clamp.
This study used PET imaging. Recently, interest has been increasing in the use of SPECT for cardiac FDG imaging (29–32). However, SPECT imaging does not currently allow quantification of the rates of FDG and glucose utilization. Furthermore, in general, positron imaging has a lower count sensitivity with SPECT than with PET, potentially creating difficulties for imaging diabetic patients (33). The insulin clamp protocol will likely enhance FDG uptake and, hence, image quality with SPECT as well.
CONCLUSION
The hyperinsulinemic euglycemic insulin clamp protocol yielded better image quality and higher rates of FDG uptake and rMGU than did a standard protocol and a niacin-enhanced protocol in patients with NIDDM, CAD, and severe LV dysfunction. The insulin clamp protocol may be the method of choice for detecting myocardial viability in this difficult patient population. Further clinical studies on a larger scale are needed to evaluate whether predictive accuracy is also better with the insulin clamp than with other protocols.
Acknowledgments
The authors thank May Aung, Nathalie Levesque, Barb Aubrey, and Deborah Gauthier for technical and nursing assistance; Dr. Karen Gulenchyn for help in reviewing the manuscript; and Sherri Nipius for secretarial assistance. This study was supported in part by the Heart and Stroke Foundation of Ontario (including grants B3008 and T3570), by the Canadian Institute for Health Research, and by the University of Ottawa Bachelor of Medical Sciences Program.
Footnotes
Received Jan. 25, 2001; revision accepted Aug. 20, 2001.
For correspondence or reprints contact: Rob S.B. Beanlands, MD, University of Ottawa Heart Institute, H149-40 Ruskin St., Ottawa, Ontario K1Y 4W7, Canada.
REFERENCES
In this issue


Jump to section
Related Articles
Cited By...
- Preclinical Evaluation of Biopolymer-Delivered Circulating Angiogenic Cells in a Swine Model of Hibernating Myocardium
- Relation Between Right Ventricular Function and Increased Right Ventricular [18F]Fluorodeoxyglucose Accumulation in Patients With Heart Failure
- 18F-FDG PET Imaging of Myocardial Viability in an Experienced Center with Access to 18F-FDG and Integration with Clinical Management Teams: The Ottawa-FIVE Substudy of the PARR 2 Trial
- In Vivo Assessment of Myocardial Glucose Uptake by Positron Emission Tomography in Adults With the PRKAG2 Cardiac Syndrome
- Increasing Benefit From Revascularization Is Associated With Increasing Amounts of Myocardial Hibernation: A Substudy of the PARR-2 Trial
- F-18-Fluorodeoxyglucose Positron Emission Tomography Imaging-Assisted Management of Patients With Severe Left Ventricular Dysfunction and Suspected Coronary Disease: A Randomized, Controlled Trial (PARR-2)
- Is Septal Glucose Metabolism Altered in Patients with Left Bundle Branch Block and Ischemic Cardiomyopathy?
- Effect of Diabetes Mellitus on Myocardial 18F-FDG SPECT Using Acipimox for the Assessment of Myocardial Viability
- Positron emission tomography and recovery following revascularization (PARR-1): the importance of scar and the development of a prediction rule for the degree of recovery of left ventricular function