


Abstract
The purpose of this study was to compare the diagnostic efficacy of attenuation-corrected and nonattenuation-corrected whole-body 18F-fluorordeoxyglucose (FDG) PET images to determine an adequate method that can semiquantitatively evaluate nonattenuation-corrected images. Methods: Whole-body PET studies were performed in 24 fasting patients with various tumors (lung cancers, n = 18; mediastinal tumors, n = 4; breast cancers, n = 2) 30–40 min after a bolus injection of 18F-FDG. Transmission scans followed emission data acquisition. Reconstructed attenuation-corrected and uncorrected images were displayed simultaneously and the relative FDG uptake in lesions and corresponding background areas was evaluated by the region of interest method. Both types of images were also compared with X-CT scans and conventional nuclear medicine scans for diagnostic efficacy. Results: Attenuation-corrected and uncorrected images were found to be equally sensitive for detecting lesions. There was a strong linear correlation between lesion-to-background (L/B) ratios calculated on attenuation-corrected and uncorrected images (r = 0.98; p < 0.001). Significant differences in L/B ratios between attenuation-corrected and uncorrected images were present in only 6 of 55 lesions (11%). Standardized uptake ratios (SURs) in attenuation-uncorrected images did not correlate with SURs in attenuation-corrected images nor with L/B ratios in uncorrected images. Conclusion: The efficacy of attenuation-uncorrected FDG PET images in evaluating tumors is similar to that using attenuation-corrected images. Uncorrected images provide not only clinically useful but also quantitative information equivalent to that provided by attenuation-corrected images. However the L/B ratio is the only available index that can be used for quantification of uncorrected images.
The use of 18F-fluorodeoxyglucose (FDG) and PET scanners for qualitative and quantitative evaluation of tumor metabolism is currently the fastest growing area in clinical PET (1). Various levels of sophistication have been used to evaluate increased glycolysis in tumors and to differentiate malignant from benign diseases (2). While absolute quantification of glycolysis in tumors might not be necessary for an accurate diagnosis of malignant lesions, the extra time required for transmission scans to correct the images for attenuation might be an undue burden on machines and cumbersome for already exhausted cancer patients. The time factor becomes even more important for patients when whole-body PET scanning is used in oncology (3).
Qualitative analyses augmented by simple semiquantitative techniques, such as the lesion-to-background (L/B) ratio, might be satisfactory in clinical tumor imaging (4–5). This concept obviates the need for attenuation correction. In this study, we compared attenuation-corrected and uncorrected whole-body FDG PET images for benign and malignant lesions. Both types of images from the same patient were displayed simultaneously and measurement of radioactivity uptake was performed using the region of interest (ROI) method. L/B ratios were calculated after visual analysis of all images.
MATERIALS AND METHODS
Patients
Twenty-four patients (mean age 64.0 yr ± 8.5), including 18 patients with lung cancer, 4 with mediastinal tumors and 2 with breast cancer, were studied with 18F-FDG PET imaging. All patients had a complete radiological diagnostic work-up before PET studies were performed. Histological confirmation of the diagnosis was performed on all patients. The study was approved by the Ethics Committee for Clinical Research of Tohoku University, and informed consent was obtained from each patient.
PET Imaging
FDG was prepared using an automated synthesis system, and quality assurance tests were performed as described previously (6). The patient’s blood glucose level was measured after fasting for 5 hr. This was followed by the injection of a bolus dose of 288.6 ± 76.2 MBq 18F-FDG while the patient sat in a comfortable chair in a quiet room. During the time between injection and scanning, the patient was asked to remain still to minimize FDG consumption of the striated muscles. All patients were asked to void just before scanning.
Whole-body PET scans were performed using a Shimadzu SET2400W (Kyoto, Japan) PET scanner (axial resolution in the center of field 3.9 mm FWHM, field of view Z axis 20 cm) by the multiple bed-position technique. The software was set to provide up to seven bed increments (5-min emission scan per bed position). Emission scans commenced from the lower end of the femur and gradually proceeded upward toward the vertex, 30–40 min after injection of the radiopharmaceutical. Transmission scanning with an external source (370 MBq 68Ge68Ga ) was performed after emission scans (7).
Data Analysis
PET images were reconstructed using measured attenuation, dead time and decay correction factors. Attenuation-uncorrected images also were reconstructed for comparison. Both types of images were documented using a standard laser printer after appropriate windowing and leveling. A lesion was defined as a focus of increased FDG uptake above the intensity of the surrounding activity, excluding the renal pelvis, urinary bladder and myocardium. A lesion with intense FDG uptake (comparable to that of physiologically high FDG uptake in the brain) and nodular in appearance was considered malignant. Lesions with FDG uptake comparable to the contralateral side or surrounding blood activity were considered benign. PET images were analyzed and compared with conventional images and histological diagnosis, retrospectively. For semiquantitative analysis, both types of images were displayed simultaneously on the computer monitor and circular or elliptical ROIs were marked on the primary and metastatic lesions already defined by conventional imaging. The highest point of radioactivity was included in these ROIs. Background counts were evaluated by ROIs drawn on contralateral body areas. When a contralateral area for mirror imaging was not available, the uptake activity in the thigh or shoulder muscles was used as the background. FDG uptake and background counts were evaluated on individual images. We also calculated the L/B ratio using average counts per pixel for all the regions marked by ROIs and compared these ratios for both types of images. The standardized uptake ratio (SUR) was calculated according to the following formula (8):
Statistical Analysis
Evaluation of the relationship between two parameters was assessed using linear regression analysis. A p < 0.05 denoted the presence of a statistically significant difference.
RESULTS
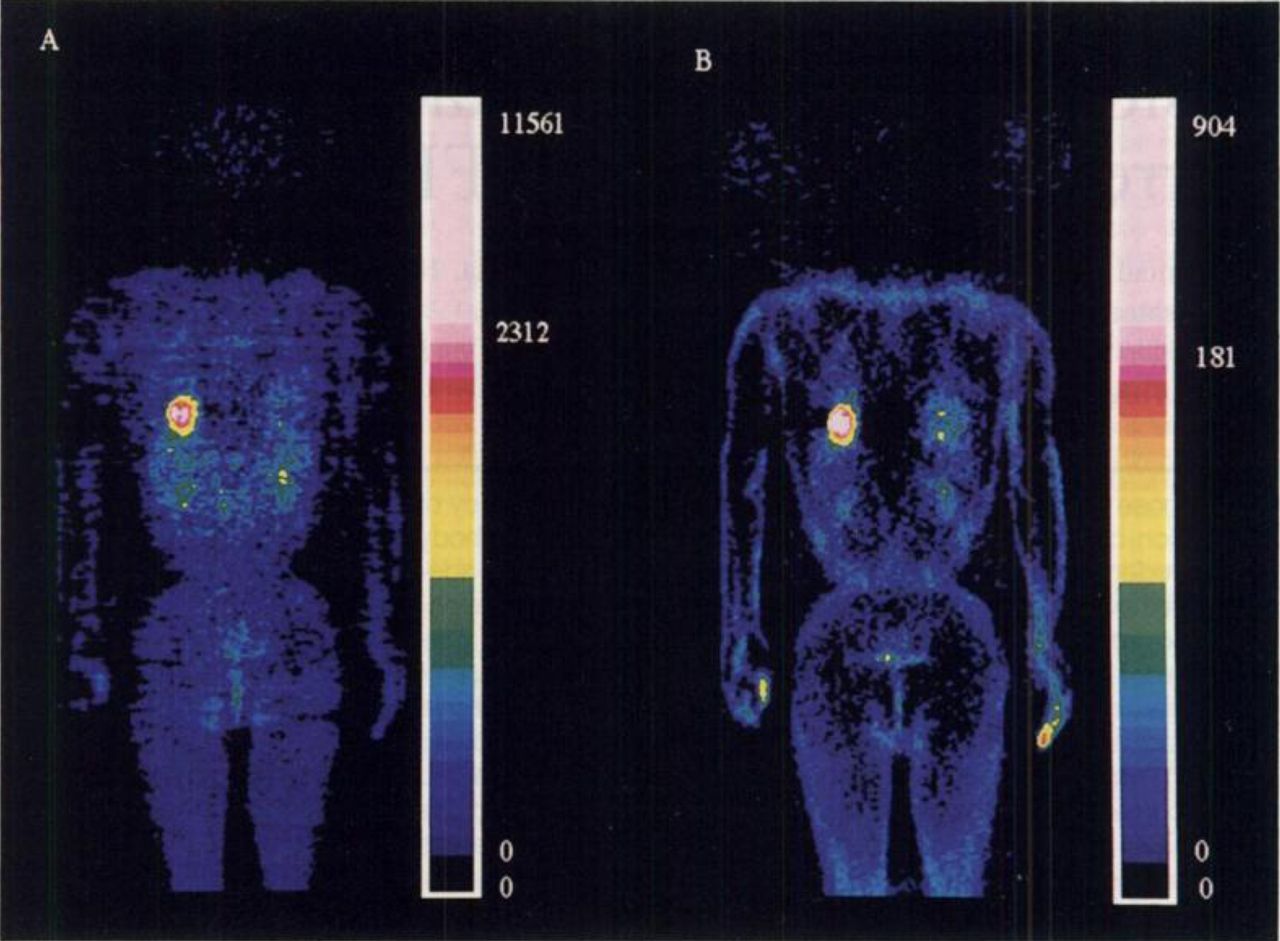
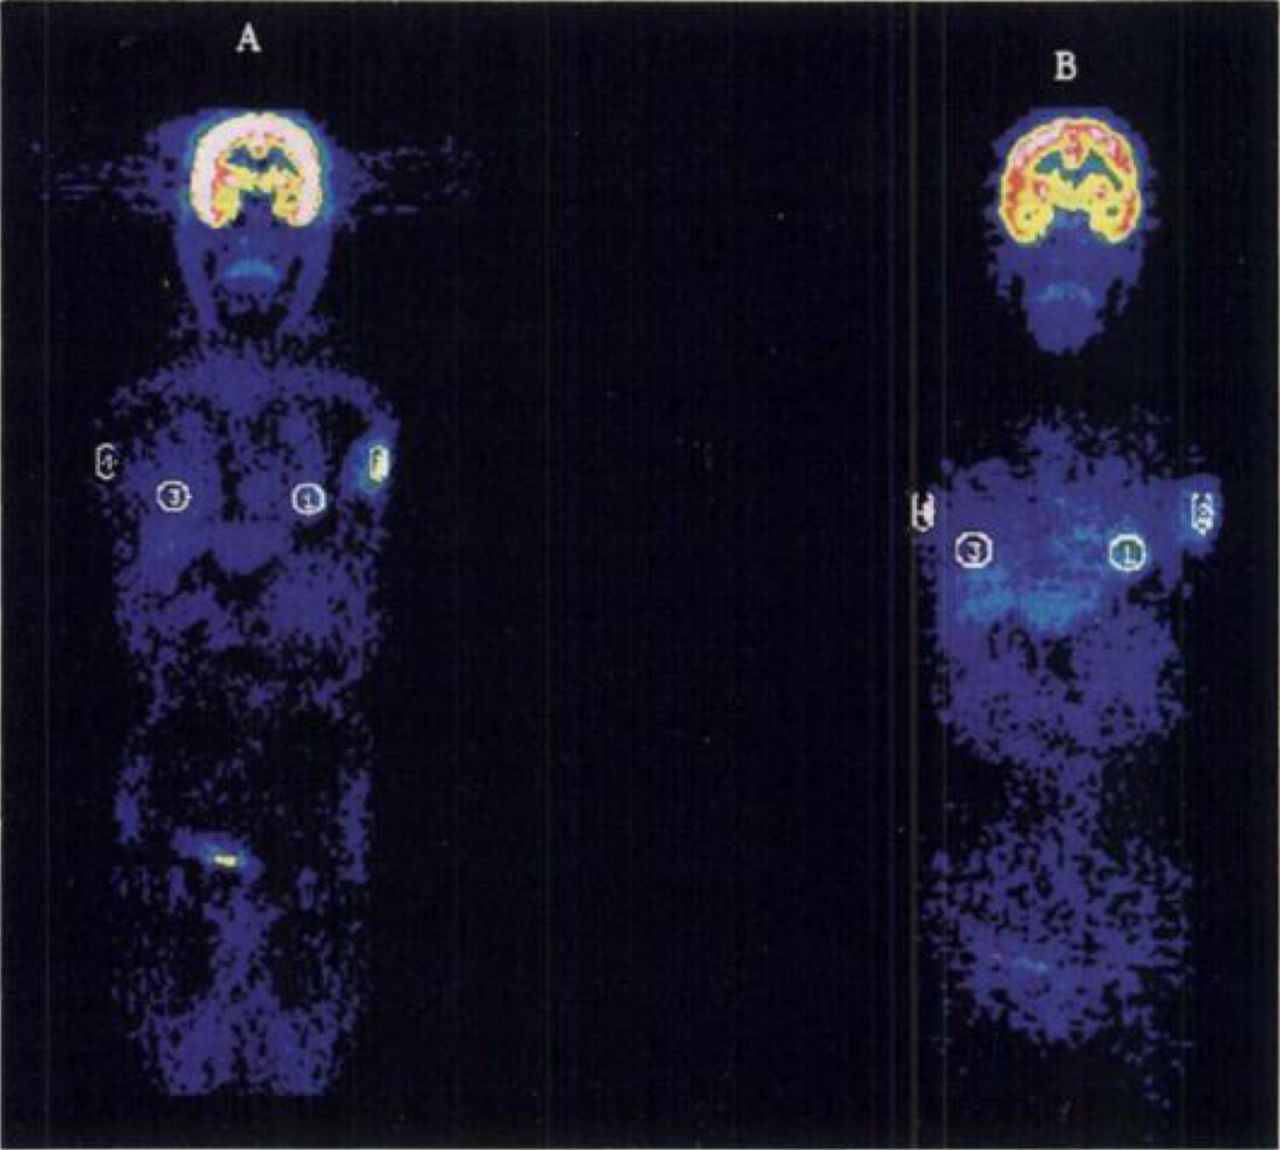
All lesions visible on CT scans and conventional nuclear medicine scintigrams examined in this study were detected on both attenuation-corrected and uncorrected FDG whole-body PET images. Figure 1 shows 18F-FDG uptake in a primary adenocarcinoma in the lower lobe of the right lung. The uncorrected image (Fig. 1B) shows a higher uptake in peripheral areas of the body (skin and muscles). Figure 2 shows an ROI marked on the primary lesion (left breast), secondary lesion (left axilla) and corresponding background areas. A patient with a mediastinal mass diagnosed on mediastinoscopy as sclerosing mediastinitis showed false-positive FDG uptake on both the corrected and uncorrected images

PET scan of patient with adenocarcinoma before treatment. PET scanning was performed 30 min after injection of 347 MBq 18F-FDG. Blood glucose level was 80 mg/dl. (A) Attenuation-corrected image; (B) attenuation-uncorrected image.

Patient with post-treatment left-sided breast cancer with recurrence in left axilla. PET scan was performed 30 min after injection of 263 MBq 18F-FDG. Blood glucose level was 86 mg/dl. (A) Attenuation-corrected image; (B) attenuation-uncorrected image. ROI is marked on left breast region and left axilla.
Table 1 summarizes the type of lesions and their respective L/B ratios on both types of images. Of 55 lesions, 40 (72.7%) had a comparatively higher L/B ratio on uncorrected images, with a mean difference of 4.5 ± 4.1%. In the remaining 15 lesions (27%), the L/B ratio on attenuation images was higher than that on uncorrected images, with a mean difference of 18 ± 12.9%. In only 6 of 55 lesions (11%) was the difference between L/B ratios calculated on attenuation-corrected and uncorrected images more than 14% [according to Weber's law, the human eye can discriminate differences in intensity only when it is more than 14% (9)]. Table 2 lists the different tumors examined in this study according to their location.
Diagnosis, Mode of Therapy, Blood Glucose Level, Location of Lesion and Lesion-to-Background (L/B) Ratios
Distribution of Lesions Based on Location
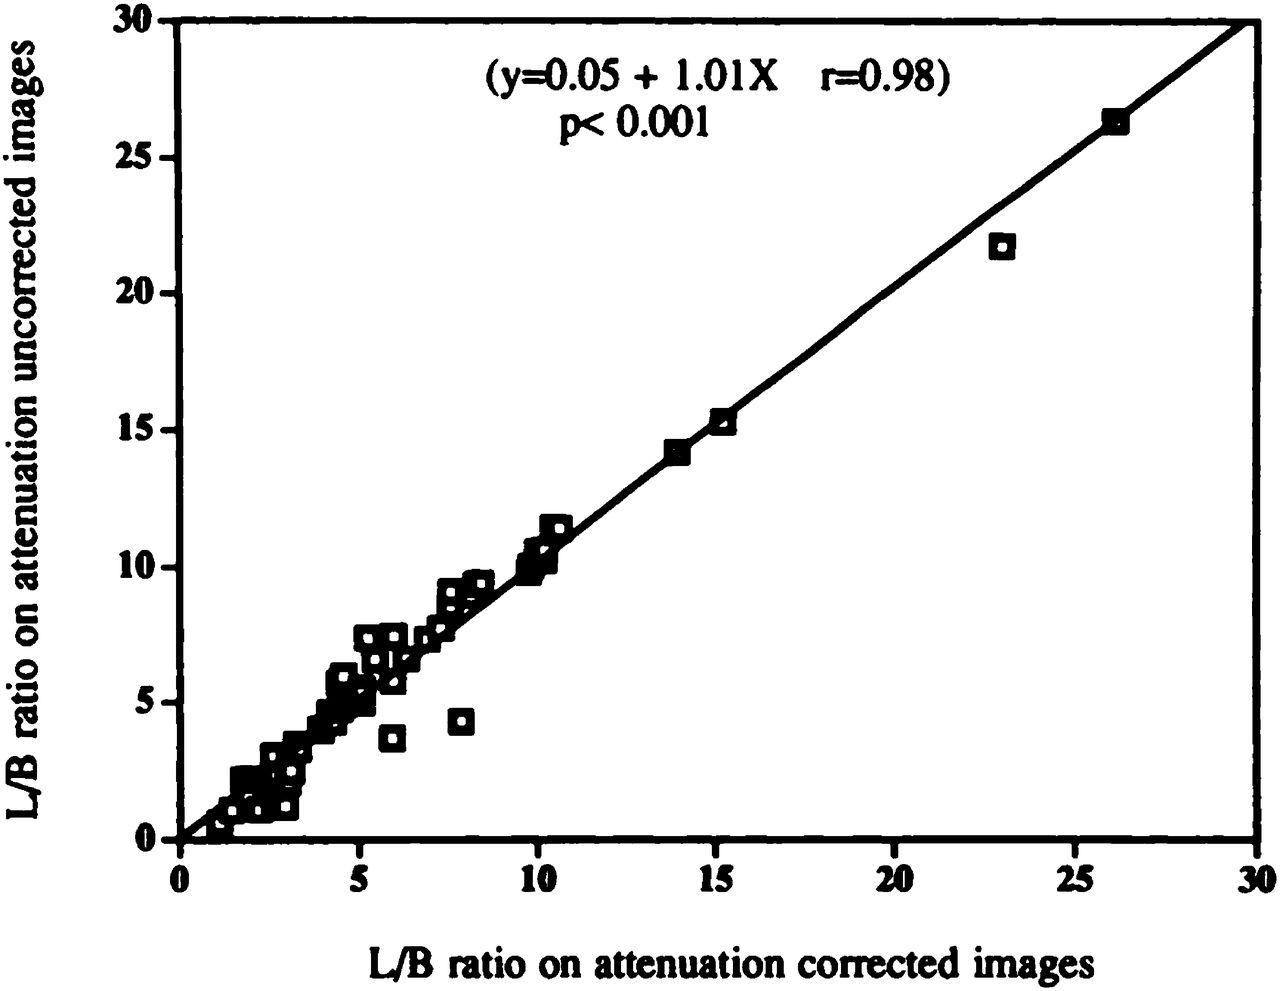
We next examined the relationship between the L/B ratio calculated on both types of images (Fig. 3). There was a strong correlation between the ratios on two types of images (r = 0.98, p < 0.001). Examination of the relationship between SUR values calculated on attenuation-corrected and uncorrected images showed a lack of a significant correlation (Fig. 4). Figure 5 depicts a plot of SUR values and L/B ratios calculated on attenuation-uncorrected images, showing no relationship between the two parameters (r = 0.2).

Plot between L/B ratios calculated on attenuation-corrected and uncorrected images.
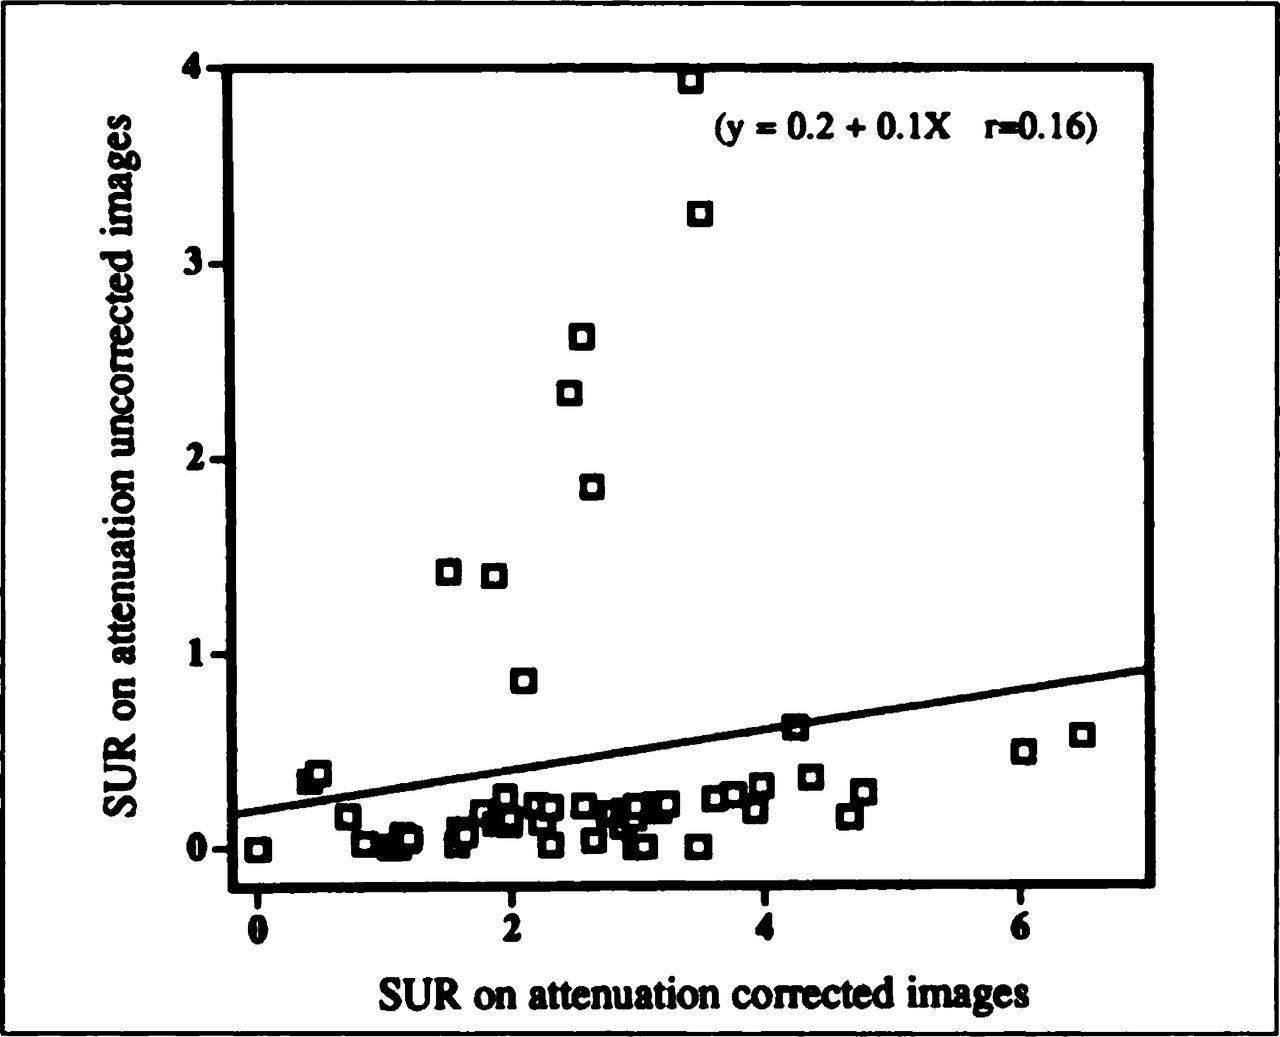
Plot between SUR values calculated on attenuation-corrected and uncorrected images.
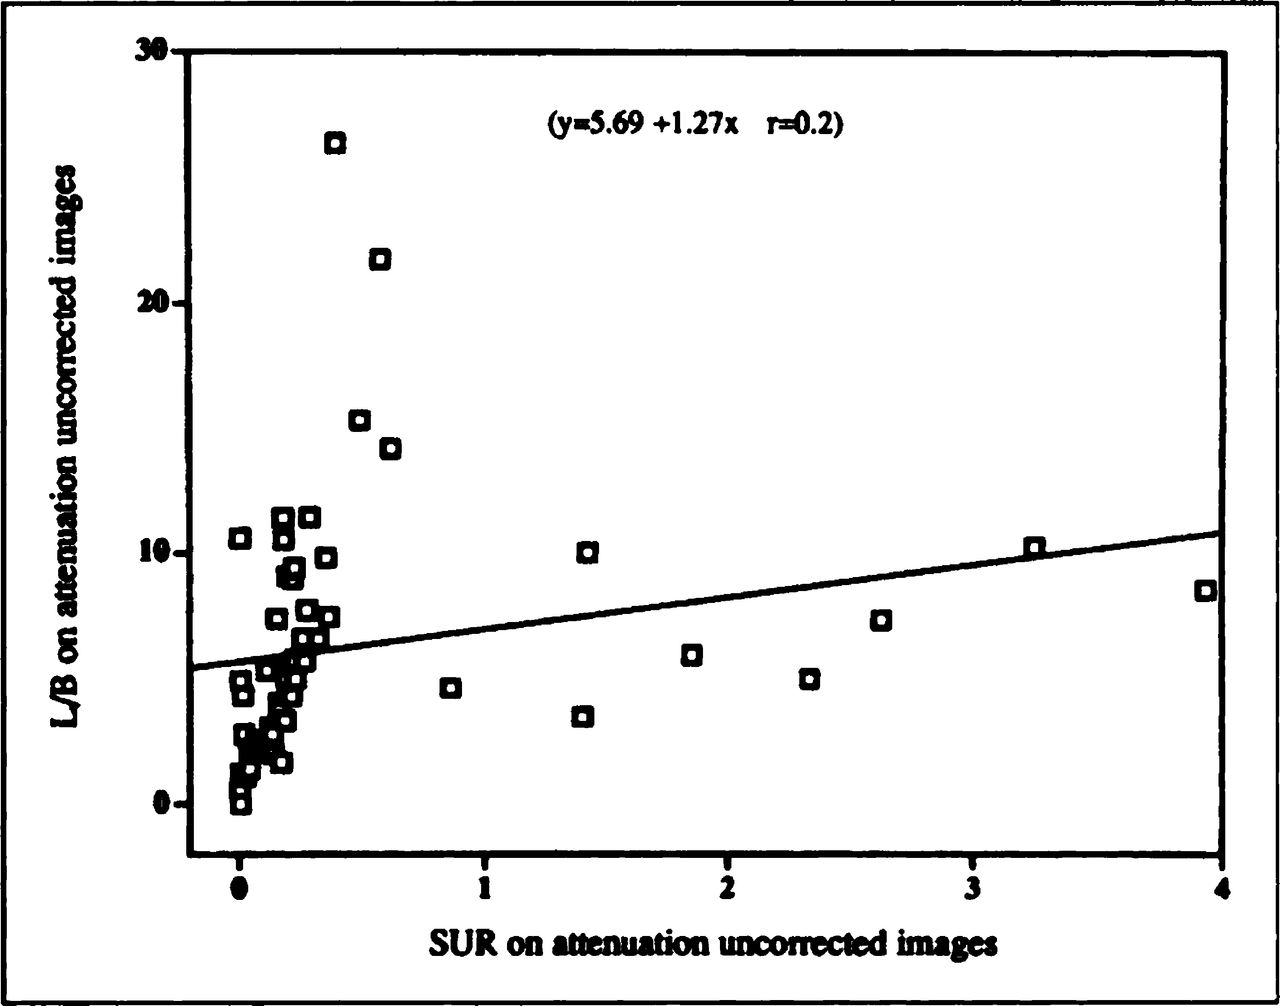
Plot between SUR values and L/B ratios calculated on attenuation-uncorrected images.
DISCUSSION
In this study, we compared the diagnostic efficacy and L/B ratios of attenuation-corrected and uncorrected images using the ROI method. Our results showed equal diagnostic efficacies of both images in oncological studies. All lesions detected by X-CT scans and scintigrams also were detected on both attenuation-corrected and uncorrected FDG whole-body PET scans. The diagnostic efficacy of uncorrected images was similar to that of attenuation-corrected images.
In ROI analysis, average counts per pixel were used for L/B calculations because this is less sensitive to high-frequency noise and provides better results than maximum pixel values (10). In addition, in a series of preliminary experiments, we evaluated {L−B}/{L + B} ratios in all lesions and found no significant difference between these ratios and the simple L/B ratio (data not shown). ROI analysis also showed that attenuation-corrected images were similar to uncorrected images. L/B ratios of primary and secondary lesions on both types of images were similar with the exception of only 6 of 55 lesions. In about 89% of the lesions, the differences in L/B ratio between attenuation-corrected and uncorrected images were less than the perceivable limits of the human eye. Those 6 lesions with significant difference in L/B ratio on attenuation corrected and uncorrected images were detectable without any difficulty on hard copies of both types of images.
In general, uncorrected images showed a higher L/B ratio in 73% of lesions while attenuation-corrected images showed a higher L/B ratio in 15 lesions, with 11 of these lesions having an L/B ratio in the benign range (L/B ratio less than 3.1). Of the remaining 4 malignant lesions, 3 were located in the lungs and 1 in the mediastinum (Table 2). This finding clearly suggests that at least with a known pulmonary primary lesion, uncorrected images could suffice for staging. Moreover, benign lesions had comparatively higher L/B ratios on attenuation-corrected images. On uncorrected images, these benign lesions appeared to be more similar to normal tissue. Uncorrected images may prove even more helpful in routine clinical practice in differentiating between benign and malignant lesions. Certain artifacts introduced during transmission-based correction of PET images also can be avoided. Moreover, using this method PET protocols become simpler and more practical in routine practice.
The cumulative data in this study showed a strong correlation between L/B ratios calculated on attenuation-corrected and uncorrected images (Fig. 3). However, there was no correlation between SUR values calculated on both types of images. This is probably due to the fact that the background activity, an important variable in these calculations, is not considered in SUR calculations. Moreover, absolute counts are required for the original definition of SUR. For the same reasons, SUR and L/B values calculated on uncorrected images also did not show a significant correlation (Fig. 5). This indicates that the L/B ratio is the only index that can be used for semiquantitative evaluation of uncorrected images.
Our results confirmed that the attenuation correction required for quantitative studies is not essential for qualitative imaging in PET oncological studies. Thus, qualitative or semiquantitative evaluation of nonattenuation-corrected images seems to be sufficient for the effective use of whole-body FDG PET scans in diagnosing malignant and benign lesions. However, recognition of the artifactual enhancement of body surface and certain organs such as the liver is essential.
CONCLUSION
We have demonstrated that attenuation-uncorrected images provide not only clinically useful but also as much quantitative information as attenuation-corrected images. With the exception of certain areas of special artifacts (e.g., body surface), most tumors can be evaluated semiquantitatively on uncorrected images with an accuracy similar to that of attenuation-corrected images.
Acknowledgments
We thank the staff of the Cyclotron Radioisotope Center and the Institute of Development, Aging and Cancer, Tohoku University, particularly Mr. Watanuki and Mr. Miyake, for their PET operation and excellent technical assistance. This work was supported by Grants-in-Aid Nos. 06454320 and 09470195 for Cancer Research from the Ministry of Education, Science, Sports and Culture, Japan.
- © 1998 by the Society of Nuclear Medicine and Molecular Imaging, Inc.
REFERENCES
- 1.
- 2.
- 3.
- 4.
- 5.
- 6.
- 7.
- 8.
- 9.
- 10.
- Received for publication July 16, 1997.
- Accepted for publication October 15, 1997.
In this issue


Jump to section
Related Articles
Cited By...
- Metabolic significance of the pattern, intensity and kinetics of 18F-FDG uptake in malignant pleural mesothelioma
- An Analytic Study of the Effects of Attenuation on Tumor Detection in Whole-Body PET Oncology Imaging
- Reducing Loss of Image Quality Because of the Attenuation Artifact in Uncorrected PET Whole-Body Images
- FDG uptake in the morphologically normal thymus: comparison of FDG positron emission tomography andCT
- Assessment of Malignancy in Pulmonary Lesions: FDG Dual-Head Coincidence Gamma Camera Imaging in Association with Serum Tumor Marker Measurement