


Abstract
Monoclonal antibodies (mAbs) against programmed cell death 1 (PD-1), such as nivolumab and pembrolizumab, are associated with high response rates in patients with relapsed or refractory classic Hodgkin lymphoma (HL). To date, no prognostic factor for overall survival (OS) has been established with these agents in HL. We examined whether the first early response assessment evaluated using 18F-FDG PET/CT may be associated with OS in this setting. Methods: This retrospective study included 45 patients from 34 institutions. In a masked, centralized review, 3 independent radiologists classified PET/CT scans obtained at a median of 2.0 mo (interquartile range, 1.7–3.7 mo) after nivolumab initiation using existing criteria (i.e., 2014 Lugano classification and 2016 LYRIC). Patients were classified according to 4 possible response categories: complete metabolic response (CMR), partial metabolic response (PMR), no metabolic response (NMR), or progressive metabolic disease (PMD). Because the OS of patients with NMR and PMR was similar, they were grouped together. OS was estimated using the Kaplan–Meier method and compared between groups using log-rank testing. Results: Eleven patients (24%) died after a median follow-up of 21.2 mo. The classification was identical between Lugano and LYRIC because all 16 progression events classified as indeterminate response per LYRIC were confirmed on subsequent evaluations. Both Lugano and LYRIC classified patients as CMR in 13 cases (29%), PMD in 16 (36%), NMR in 4 (9%), and PMR in 12 (27%). The 2-y OS probability was significantly different in patients with PMD (0.53; 95% confidence interval [95%CI], 0.32–0.87), NMR or PMR (0.80; 95%CI, 0.63–1.00), and CMR (1.00; 95%CI, 1.00–1.00) in the overall population (P = 0.02, 45 patients), as well as according to a landmark analysis at 3 mo (P = 0.05, 32 patients). Conclusion: In relapsed or refractory HL patients treated with anti-PD-1 mAbs, the first early PET/CT assessment using either Lugano or LYRIC predicted OS and allowed early risk stratification, suggesting that PET/CT might be used to develop risk-adapted strategies.
Immune checkpoint inhibition with monoclonal antibodies (mAbs) against programmed cell death 1 (PD-1) has shown promising results in patients with relapsed or refractory (R/R) Hodgkin lymphoma (HL), and 2 agents (nivolumab and pembrolizumab) are approved in this setting (1,2). Although anti-PD-1 mAbs provide high overall response rates, most of those responses are partial, and disease in most patients eventually progresses (3–7). Nevertheless, a subset of patients may experience prolonged remissions even after anti-PD-1 discontinuation (8). Although the type of best radiographic response may be associated with the duration of response (9,10), no clear prognostic factor for OS, radiographic or otherwise, has yet emerged (3,4). In addition, a prior study of PET/CT found that new imaging patterns of response and progression, such as transient progressions and indeterminate responses (IRs), were observed in up to one third of R/R HL patients treated with anti-PD-1 mAbs (11,12), further calling into question the relevance of conventional radiographic response categories.
There is controversy about the accuracy of PET/CT in assessing response when immunologic agents are used, and some authors have suggested that PET/CT should not be used in HL outside a clinical trial. A core concept of response evaluation using PET/CT is that patients with HL and a complete metabolic response (CMR) on PET/CT to chemotherapy are likely to have a durable remission and potentially be cured. Even the ability of CMR to measure response and predict clinical benefit is currently contested (13). In an analysis of patients with HL treated with nivolumab, the progression-free survival (PFS) and overall survival (OS) of patients with a partial metabolic response (PMR) was only slightly inferior to those of patients with CMR, suggesting that attainment of CMR is not a critical parameter in the new era of immunotherapy (3).
In HL patients treated with cytotoxic chemotherapies, interim PET/CT closely correlates with outcome and is commonly used to guide response-adapted treatment strategies. These strategies may benefit patients either by improving the efficacy of the treatments (through early treatment escalation) or by decreasing the toxicity (through treatment deescalation) (14–16). Whether early PET/CT can also predict outcome in HL patients treated with anti-PD-1 mAbs remains to be determined (17–21). If it can, it might be used to define the therapeutic duration or regimen, such as by identifying patients requiring consolidation or by reinforcing the treatment with other agents to deepen responses and ultimately convert PMR to CMR (3,4). Consequently, we evaluated the prognostic value of early PET/CT response evaluation in R/R HL patients treated with anti-PD-1 mAbs using the 2014 Lugano classification and the 2016 Lymphoma Response to Immunomodulatory Therapy Criteria (LYRIC). To this end, 3 experienced radiologists, in a centralized consensus review, retrospectively analyzed 45 consecutive patients with R/R HL treated with nivolumab in 34 French centers between 2013 and 2017.
Our primary endpoint was to evaluate if early response using 18F-FDG PET/CT predicts OS in R/R HL patients treated with anti-PD-1 mAb.
MATERIALS AND METHODS
Participants
To be eligible for inclusion in this retrospective multicenter study, patients had to meet with the following criteria: be at least 18 y old, have confirmed evidence of R/R HL, have at least 1 lesion measuring greater than 1.5 cm, have been treated with nivolumab anti-PD-1 mAb, have undergone concomitant 18F-FDG PET/CT and CT at baseline, and have undergone at least 1 early response monitoring evaluation (i.e., PET/CT performed at a median of 2.0 mo [interquartile range, 1.7–3.7 mo]). Whole-body multislice CT scans were acquired of the head, neck, thorax, abdomen, and pelvis. The 18F-FDG PET/CT acquisitions and reconstructions were performed according to the European Association of Nuclear Medicine guidelines (22). Early response evaluations were scheduled according to clinicians’ choice during anti-PD-1 mAb therapies. From 2013 to 2017, 81 eligible patients were registered in French participating centers, 45 of whom were included in the study. Thirty-six patients were excluded because of deviations from the inclusion criteria (Fig. 1). Nivolumab was continued until disease progression, unacceptable toxicity, physician decision, or another reason. The decision to continue or discontinue treatment was made onsite by clinicians during anti-PD-1 mAb therapies on the basis of their expert assessment. This study was compliant with the Health Insurance Portability and Accountability Act and was approved by the review board of each participating institution (approval AAAS0104, nivolumab authorization for temporary use CA209-563). The study was conducted in accordance with the International Conference on Harmonization Guidelines for Good Clinical Practice.

Flowchart.
Data Collection
Deidentified and anonymized PET/CT images were transferred to a core imaging laboratory for analysis.
Study Design
A study flowchart is presented in Figure 1. An independent analysis of the CT and PET/CT scans of each patient was performed by 3 radiologists, who were masked to outcome, clinical data, and clinicopathologic features. Following the 2014 Lugano classification and LYRIC (2016 revised criteria) (23,24), PET/CT response was categorized as CMR, PMR, no metabolic response (NMR), or progressive metabolic disease (PMD). LYRIC adds IR as a new category at the time of first PMD; otherwise, the CMR, PMR, and NMR definitions are the same as for the Lugano classification. Therefore, we classified PMD at PET/CT as IR1, IR2 or IR3.
Study Endpoint
The primary endpoint was OS. The failure event for OS was defined as death due to any cause. Survival time was measured from the date of anti-PD-1 mAb treatment initiation to the date of death or last follow-up. Progression-free survival (PFS) was a secondary endpoint. PFS was defined as the time from anti-PD-1 mAb treatment initiation to disease progression or death from any cause. According to LYRIC, disease progression is the last unconfirmed PMD occurring before either a subsequently confirmed PMD or the end of the follow-up. As an alternative metric, we used modified PFS (mPFS), defined as the time to progression, death, or receipt of additional anticancer therapy for patients who were not in CMR after completion of nivolumab therapy, per independent review.
Best overall response, PFS, and mPFS in this cohort were derived from the evaluation of all available on-treatment imaging time points (performed at ∼3-mo intervals) using the 2016 LYRIC modifications (average of 4.5 PET/CT examinations per patient).
Treatment duration was defined as the time from anti-PD-1 mAb treatment initiation to the last cycle of therapy recorded by the investigators at the time of data collection.
Statistical Analysis
Patients were classified into 4 response categories: CMR, PMR, NMR, or PMD. The difference in OS, PFS, and mPFS between these groups was assessed using log-rank testing (Kaplan–Meier analysis). To adjust for immortal time bias, we performed landmark analysis, which split the follow-up time at a prespecified 3-mo time point. Groups were then defined by PET/CT responses occurring before the landmark, and outcome events were considered only if occurring after the landmark. The goal of the landmark method is to estimate in an unbiased way the time-to-event probabilities in each group conditional on the group membership of patients at a specific time point, the landmark time. All analyses were conducted using Excel (version 2019; Microsoft), SPSS (version 25.0; IBM), and R (version 1.2.1335).
RESULTS
Patients’ Characteristics
Patients’ characteristics are described in Supplemental Table 1 for the overall population and for early PET/CT response (supplemental materials are available at http://jnm.snmjournals.org). The median age of the study population was 39 y (range, 18–77 y), and 56% of patients were men. Four percent had Ann Arbor stage I disease, 18% had stage II, 20% had stage III, and 49% had stage IV. The patients had received a median of 6 (range, 3–13) prior lines of therapy. Brentuximab vedotin was received by 42 patients (93%). Fifty-eight percent of patients had previously undergone autologous stem cell transplantation, and 53% had received prior radiation therapy. The median treatment duration with anti-PD-1 mAb was 7.3 mo (range, 0.5–24.2 mo).
Early Response Evaluation
The early response evaluation was performed at a mean of 3 mo (SD, 2.3 mo) after anti-PD-1 mAb initiation. The median was 2.0 mo (interquartile range, 1.7–3.7 mo). The distribution of the delay between treatment initiation and PET/CT was similar in all response categories (Supplemental Fig. 1). The response at PET/CT was CMR in 13 patients (29%), PMD in 16 patients (36%), and NMR or PMR in 16 patients (36%) (Supplemental Figs. 1–3).
OS
Eleven R/R HL patients (24%) died during the follow-up after anti-PD-1 mAb initiation. Median OS was not reached (Table 1; Fig. 2). Early response evaluation using PET/CT stratified patients into 3 risk groups for OS (P = 0.02): high risk (PMD patients) with 2-y OS of 0.53 (95% confidence interval [95%CI], 0.32–0.87), intermediate risk (NMR and PMR patients) with 2-y OS of 0.80 (95%CI, 0.63–1.00), and low risk with 2-y OS of 1.00 (95%CI, 1.00–1.00) (Fig. 2).
OS, PFS, and mPFS per Early Response on PET/CT (2014 Lugano)
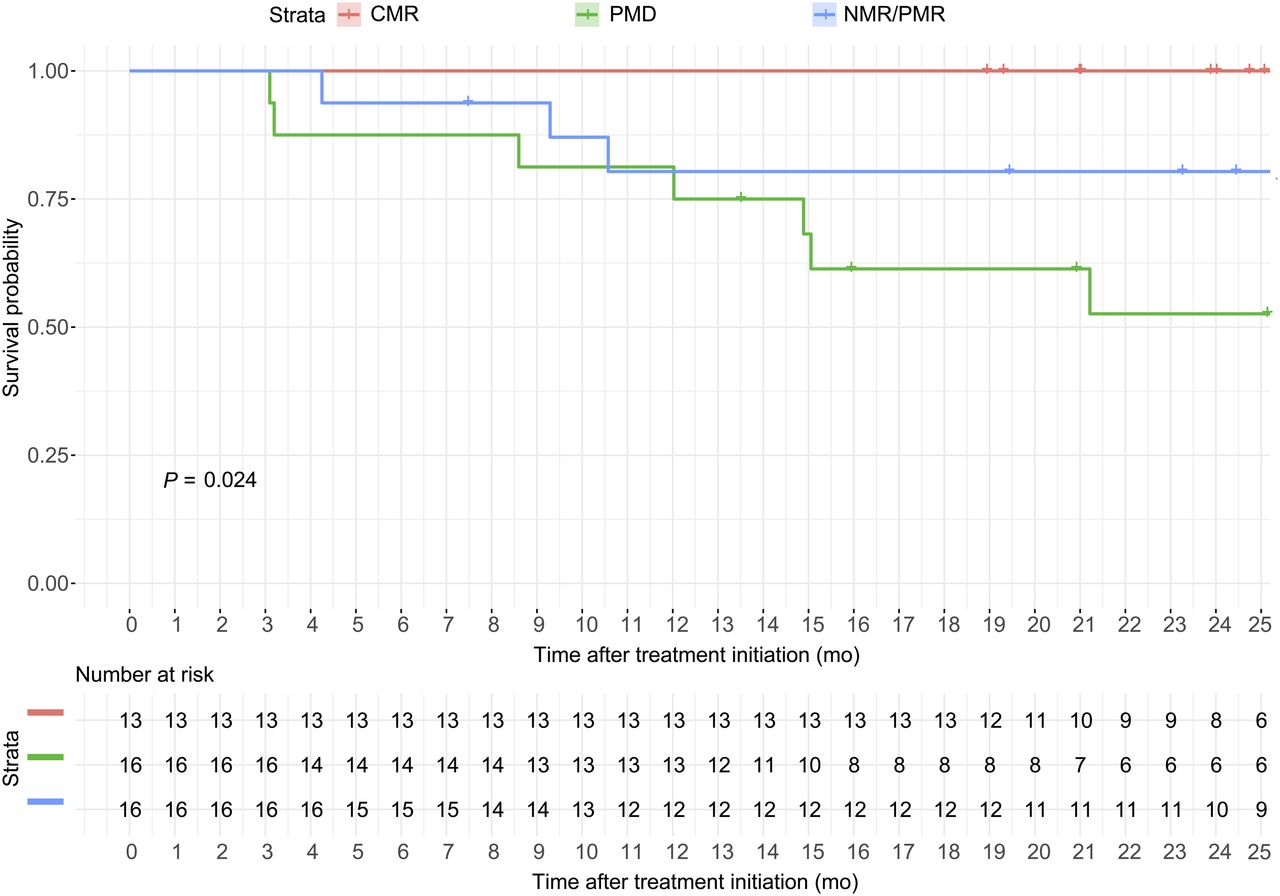
Kaplan–Meier estimate of OS according to PET/CT response. In overall population (45 patients), Kaplan–Meier estimate of OS from anti-PD-1 mAb initiation was based on PET/CT response classification, stratifying patients into 3 OS risk groups: high (PMD), low (CMR), and intermediate (NMR and PMR). Patients with CMR at PET/CT have prolonged OS.
We grouped NMR and PMR because their OS was similar. This grouping facilitated the interpretation of results, since NMR was observed in only 4 patients (9%), as compared with PMR in 12 patients (27%).
Landmark Analysis for OS Analysis
In the subgroup of patients included in the landmark analysis at 3 mo, all patients received a PET/CT evaluation within 3 mo. Thirty-two patients were included, and the response at PET/CT was CMR in 9 patients (28%), PMD in 12 patients (38%), and NMR or PMR in 11 patients (34%). The results observed in the overall population (45 patients) were confirmed by the landmark analysis (32 patients): early response evaluation using PET/CT was associated with OS (P = 0.05) (Supplemental Table 2; Supplemental Fig. 3).
PFS
Median PFS was 8.4 mo (95%CI, 3.7–13.6) (Table 1; Supplemental Fig. 4). Early response evaluation using PET/CT was associated with PFS (P < 10−3) and stratified patients into 3 risk groups: high risk (PMD patients) with median PFS of 2.5 mo (95%CI, 1.8–7.9), intermediate risk (NMR and PMR patients) with median PFS of 11.7 mo (95%CI, 3.7–NA [upper limit not applicable]), and low risk (CMR patients) with median PFS of 26.3 mo (95%CI, 11.2–NA).
mPFS
Median mPFS was 11.2 mo (95%CI, 7.2–26.2) (Table 1; Supplemental Fig. 5). Early response evaluation using PET/CT stratified patients into 3 risk groups for mPFS (P < 10−3): high risk (PMD patients) with median mPFS of 5.4 mo (95%CI, 1.9–19.8), intermediate risk (NMR and PMR patients) with median PFS of 11.1 mo (95%CI, 5.7–NA), and low risk (CMR patients) with median PFS not reached (lower estimated 95%CI, 23.4 mo).
Outcome of Patients with PMD
On the early PET/CT evaluation, 16 of 45 patients had PMD according to the Lugano classification.
Using LYRIC, these 16 patients with early progression were categorized differently, as follows. Four patients (25%) had IR1 (≥50% increase in the sum of the product of the diameters in the first 12 wk of therapy). Eight patients (50%) had IR2 (new or existing lesions with growth ≥ 50% in the context of lack of overall progression [<50% increase] at any time during treatment). Four patients (25%) had IR3 (increase in 18F-FDG uptake without an increase in lesion size or number).
We compared the rate of pseudoprogression and the OS of these 16 patients classified as IR1, IR2, and IR3. All 16 patients (4/4 IR1, 8/8 IR2, and 4/4 IR3) were confirmed subsequently to have PMD on their next scan. The OS of patients classified as IR1, IR2, and IR3 was not statistically different (log-rank, P = 0.25), although there was a trend showing a worse OS in patients with IR2.
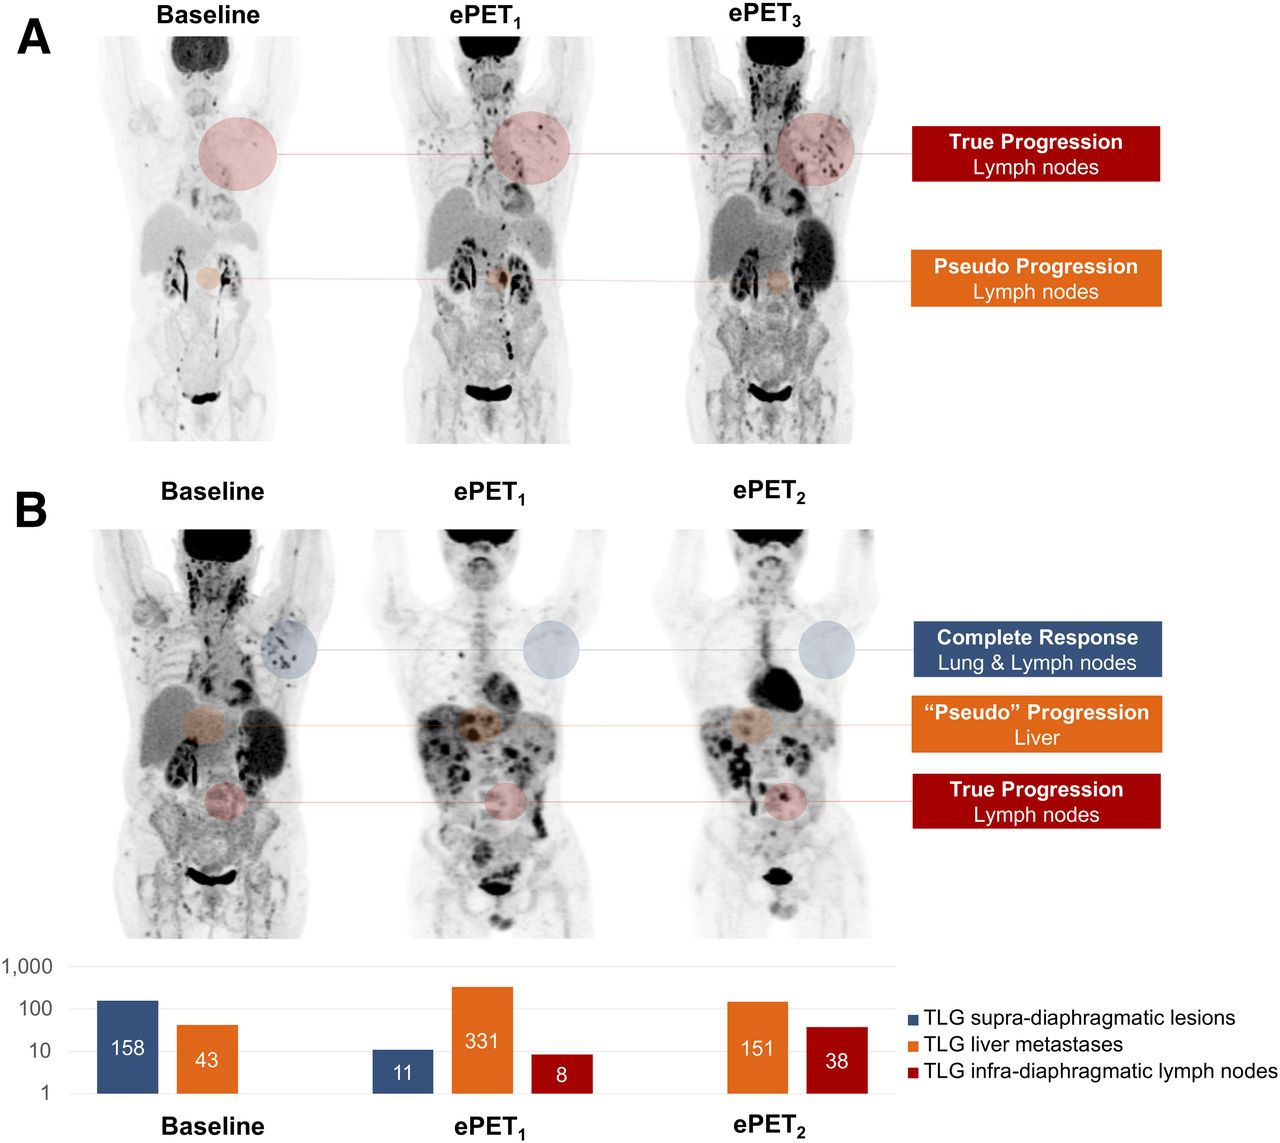
Although all PMD at the early PET/CT evaluation was subsequently confirmed on a per-patient analysis, we did observed pseudoprogressive lesions on a per-lesion analysis. In 2 of these 16 progressive patients (Fig. 3), some individual lesions experienced transient progression in lesion size and metabolism (i.e., lesions were progressive and then regressed) while the patients were continuing anti-PD-1 mAb, although it did not alter patients’ response evaluation since other lesions were unequivocally progressive. Therefore, the rate of patients with pseudoprogressive lesions was 12.5% of early progressive patients (2/16) and 4.4% of the overall cohort (2/45).

Pseudoprogressive lesions at early PET in unequivocally progressive patients. In these 2 patients, 18F-FDG PET/CT was performed at baseline, month 2 (ePET1), month 3 (ePET2), and month 8 (ePET3). 18F-FDG PET/CT showed unconventional immune-related phenomena regarding tumor response or progression. (A) Immune-related adverse event (hemolytic anemia) translated into increased spleen metabolism. Transient progression in lesion size and metabolism was observed while patient was treated with nivolumab. These pseudoprogressive lesions did not significantly alter response evaluation since they were observed in unequivocally progressive patient. On CT, percentage of sum of product of greatest diameters increased as compared with baseline by +24% at ePET1 and +6% at ePET3. New lesions on ePET1 were confirmed on ePET3. (B) This patient experienced mixed response, with true-progressive, pseudoprogressive, and CMR lesions. On CT, percentage of sum of product of greatest diameters decreased as compared with baseline by −18% at ePET1 and −56% at ePET2. However, new lesions on ePET1 were confirmed on ePET2. Total lesion glycolysis (TLG) is displayed to demonstrate opposite trends observed in supradiaphragmatic lesions, liver lesions, and infradiaphragmatic lymph nodes. Quantitative approaches could be useful to guide decision to continue treatment in unequivocally progressive patients with mixed responses.
DISCUSSION
The paradigm of early response assessment in HL was developed for cytotoxic chemotherapies, and its use as a model for immune-modulatory regimens has not yet been studied (25–27). In the current centralized review, we retrospectively analyzed 45 consecutive patients with R/R HL treated with nivolumab. Though early response evaluation using PET/CT guides treatment decisions, including potential treatment discontinuation, the accuracy of PET/CT for disease monitoring in patients with HL treated with immunotherapy had not been evaluated yet. Our results suggest that early response assessment in R/R HL patients treated with nivolumab predicts outcome, including OS. If confirmed, our results would support the use of early PET/CT to guide the management of anti-PD1 mAb–treated patients and could serve as a basis for future prospective studies to evaluate PET-guided risk-adapted strategies in HL patients treated with anti-PD1 mAb.
Although pseudoprogression represents the most described atypical immune-related pattern of response in solid tumors, along with abscopal effect and hyperprogression (11,12), this phenomenon did not significantly alter the response evaluation in our cohort. PMD, based on standard criteria, at an early time point in patients with R/R HL treated with anti-PD-1 mAb may, therefore, be considered to carry a high risk of being true progression rather than pseudoprogression. The size of the cohort has allowed for comparing the immune-related LYRIC to conventional response criteria designed in the era of conventional cytotoxic chemotherapy in 16 patients with PMD at PET/CT. All 16 cases of early PMD, classified as IR per LYRIC, were subsequently confirmed as true PMD. Nonetheless, the use of LYRIC provided interesting insights. First, the rate of patients with at least 1 pseudoprogressive lesion at early PET/CT was 12.5% of early progressive patients (2/16 patients) and 4.4% of the overall cohort (2/45 patients). Second, the incidence of the pseudoprogression phenomenon might be underestimated since imaging occurred every 3 mo and might not have captured pseudoprogression occurring either at earlier time points (Supplemental Fig. 1) or between 2 time points. Third, we observed a trend showing a worse OS in patients with IR2 per LYRIC. Prospective or larger cohorts should confirm this finding, but it might suggest that in R/R HL, the appearance of a new lesion could be a worse progression phenotype.
The use of mPFS (the time to progression, death, or non-CMR and use of subsequent anticancer therapy) has gained traction after the publication of the phase III international ECHELON-1 study (28), which was designed to evaluate brentuximab vedotin as part of a frontline chemotherapy regimen for previously untreated advanced classic HL. Interestingly, we demonstrated that early response using PET/CT predicts mPFS. Nonetheless, there has been debate over why and when mPFS should be used as a primary endpoint. The issue that mPFS brings up is that PFS is a robust endpoint (progression or death), whereas when mPFS is used, if a patient fails to reach CMR and then has subsequent treatment at the discretion of the investigator, that also counts as an event. The problem with mPFS is that in our series, the treating clinicians were not masked and review readings by an independent facility were not available to treating clinicians at the time of the treatment decision. Consequently, the results for mPFS presented in this study could be inherently biased.
On a wider perspective, the absence of observed pseudoprogression at 3 mo in our cohort does not preclude the occurrence of unconventional patterns of response and progression. Such an analysis is beyond the scope of this study, but the clinical decision and PET reporting can be challenging for a radiologist with limited experience in response assessment for patients treated with anti-PD-1. Therefore, radiologists should be aware that mixed responses and immune-related adverse events can be detected by early PET/CT. Medical imaging detects 74% of immune-related adverse events in solid tumors, and PET is known to be a highly sensitive modality (29). The most frequent sites reported in solid tumors are lung, mediastinal lymph nodes (sarcoidosislike), enterocolitis, hypophysitis, thyroiditis, hepatitis, arthritis, and pancreatitis. Although we identified such immune-related adverse events in our cohort, we also identified imaging findings suggestive of gastritis and hemolytic anemia (27). A key message is that immune-related adverse events should not be misclassified as PMD.
Our study demonstrated that early PET/CT can guide the management of HL patients treated with anti-PD-1 mAb. These results can be added to the recent advances in knowledge regarding precision medicine approaches guided by medical imaging. First, we demonstrated that patients with PMD on early PET/CT were associated with the shortest OS in our series. In these patients, the rate of elimination of tumor cells by immunosurveillance is lower than the rate of tumor cells escaping immunosurveillance wherein the immunologically sculpted tumor expands in an uncontrolled manner. However, this does not mean that anti-PD-1 mAb does not have any antitumor activity in these patients. Some data have suggested that anti-PD-1 treatment past progression could be beneficial (3) and that the tumor growth rate observed in PMD patients treated with anti-PD-1 mAb is lower than the tumor growth rate observed during the period before anti-PD-1 mAb initiation (11). Second, recent reports suggested that anti-PD-1 mAb could be discontinued in patients achieving CMR (8) and that more aggressive strategies (i.e., addition of chemotherapy or consolidation with an allograft) may be required for patients who are unable to achieve a CMR (30).
The limitations of this study are the retrospective analysis of a multicenter population of patients with moderate sample size. First, the sample size is small compared with datasets evaluating standard-of-care drugs. However, a 45-patient population is a large one in the new field of response assessment to immunotherapy. Second, PET acquisitions were performed in different institutions, but since baseline and first-response assessment were performed in the same center, response assessment was not affected. Additionally, all participating centers followed international guidelines for PET acquisition and reconstruction. Third, the patients were scanned at a median of 2 mo, and the absence of coordination between centers had to be considered by performing a landmark analysis at 3 mo. Fourth, this study exploring patterns of response to nivolumab confirmed that early PET is an accurate tool for response assessment: this dataset constitutes a validation set for previously published data by our group using pembrolizumab (11,12). Fifth, there was no biopsy available at PET/CT to correlate imaging phenotype with immune infiltration and persistence of Reed Sternberg cells. Therefore, IRs at early PET/CT were reclassified as true PMD using PET/CT performed an average of 3 mo later as the reference standard. This is in line with LYRIC guidelines and seems clinically relevant since all patients with IR at PET/CT experienced a nonequivocal metabolic and anatomic progression at PET/CT performed an average of 3 mo later, as well as a high mortality rate. Additionally, previous studies in R/R HL patients treated with pembrolizumab demonstrated the persistence of Reed Sternberg cells in all biopsied 18F-FDG–positive lesions (11,12). Landmark analysis at 3 mo was performed to adjust for immortal time bias. The threshold was 3 mo since prior studies have shown that response assessed at an interval of 3 mo after treatment initiation is usually consistent with long-term response (2,31). Early PET/CT was used as the reference since a single-center pilot study suggested that PET can detect most responding patients at 3 mo, although the anatomic nadir of lesions on CT was not observed until 1 y after treatment initiation (12). Additionally, early response evaluation using PET/CT has been demonstrated to change the best overall response category in 31% of patients, compared with CT alone (11). Finally, the landmark analysis—in a subset of 32 of 45 patients—reduces the impact that the variation in cycles of therapy before early PET/CT could have on the study results.
CONCLUSION
Our study demonstrated that early metabolic response predicts survival in R/R HL patients treated by anti-PD-1 mAb and allows early identification of subsets of patients with a high, intermediate, and low risk of progression and death. Our findings suggest that further prospective studies may be able to confirm that early PET may be used to develop risk-adapted strategies in patients with HL treated with anti-PD-1 mAb.
DISCLOSURE
Laurent Dercle’s work was funded by a grant from Fondation Philanthropia, Geneva, Switzerland, and the Fondation Nuovo-Soldati. No other potential conflict of interest relevant to this article was reported.
KEY POINTS
QUESTION: Does the first early-response 18F-FDG PET/CT assessment using the 2014 Lugano classification or 2016 LYRIC predict OS in R/R classic HL treated with nivolumab immunotherapy that triggers unconventional patterns of response and progression?
PERTINENT FINDINGS: In a masked, retrospective, centralized review of 45 patients from 34 institutions, the classification of PET/CT obtained at a median of 2.0 mo after nivolumab initiation was identical between Lugano and LYRIC, since all 16 progression events at a median of 2.0 mo were confirmed on subsequent evaluations as true progression (i.e., not pseudoprogression). The 2-y OS probability was significantly different in patients classified on early PET/CT as PMD (53%), NMR or PMR (80%), and CMR (100%) in the overall population (45 patients), as well as according to a landmark analysis at 3 mo (32 patients).
IMPLICATIONS FOR PATIENT CARE: In R/R classic HL treated with nivolumab immunotherapy, PET/CT assessment using either Lugano or LYRIC predicts OS and allows early risk stratification, suggesting that PET/CT may be used to develop risk-adapted strategies.
Footnotes
Published online Oct. 18, 2019.
- © 2020 by the Society of Nuclear Medicine and Molecular Imaging.
REFERENCES
- Received for publication June 25, 2019.
- Accepted for publication September 25, 2019.


