


Abstract
The objective of this study was to validate several parametric methods for quantification of 3′-deoxy-3′-18F-fluorothymidine (18F-FLT) PET in advanced-stage non–small cell lung carcinoma (NSCLC) patients with an activating epidermal growth factor receptor mutation who were treated with gefitinib or erlotinib. Furthermore, we evaluated the impact of noise on accuracy and precision of the parametric analyses of dynamic 18F-FLT PET/CT to assess the robustness of these methods. Methods: Ten NSCLC patients underwent dynamic 18F-FLT PET/CT at baseline and 7 and 28 d after the start of treatment. Parametric images were generated using plasma input Logan graphic analysis and 2 basis functions–based methods: a 2-tissue-compartment basis function model (BFM) and spectral analysis (SA). Whole-tumor–averaged parametric pharmacokinetic parameters were compared with those obtained by nonlinear regression of the tumor time–activity curve using a reversible 2-tissue-compartment model with blood volume fraction. In addition, 2 statistically equivalent datasets were generated by countwise splitting the original list-mode data, each containing 50% of the total counts. Both new datasets were reconstructed, and parametric pharmacokinetic parameters were compared between the 2 replicates and the original data. Results: After the settings of each parametric method were optimized, distribution volumes (VT) obtained with Logan graphic analysis, BFM, and SA all correlated well with those derived using nonlinear regression at baseline and during therapy (R2 ≥ 0.94; intraclass correlation coefficient > 0.97). SA-based VT images were most robust to increased noise on a voxel-level (repeatability coefficient, 16% vs. >26%). Yet BFM generated the most accurate K1 values (R2 = 0.94; intraclass correlation coefficient, 0.96). Parametric K1 data showed a larger variability in general; however, no differences were found in robustness between methods (repeatability coefficient, 80%–84%). Conclusion: Both BFM and SA can generate quantitatively accurate parametric 18F-FLT VT images in NSCLC patients before and during therapy. SA was more robust to noise, yet BFM provided more accurate parametric K1 data. We therefore recommend BFM as the preferred parametric method for analysis of dynamic 18F-FLT PET/CT studies; however, SA can also be used.
Lung cancer is the most common form of cancer with the highest cancer-related mortality worldwide, being responsible for nearly 20% of the cancer-related deaths (1). Tyrosine kinase inhibitors (TKIs) target the epidermal growth factor receptor (EGFR) in tumor cells (2) and improve clinical outcome in patients with activating EGFR mutations. Nevertheless, about 1 in 4 patients does not obtain tumor response to TKI treatment (3,4). An imaging biomarker evaluating early changes after the start of treatment could allow for a more accurate assessment of response and markedly reduce toxicity and costs by identifying ineffective treatment at an early stage. Assessing early response using RECIST might not be adequate because it can take several weeks to notice any change in size (5); moreover, TKIs influence the metabolic pathway of the tumor and assessment of metabolic activity could therefore be used as an early imaging biomarker and precursor of response.
3′-deoxy-3′-18F-fluorothymidine (18F-FLT) PET is used to image cell proliferation and could be used for early response evaluation. After injection, 18F-FLT follows the salvage pathway of endogenous thymidine. In contrast to thymidine, 18F-FLT is not incorporated into DNA but gets trapped in the cell (6). Cellular 18F-FLT uptake is mainly regulated by thymidine kinase 1 which is upregulated during the S phase of the cell cycle and hence is directly related to cell proliferation. Although 18F-FLT PET was thought to be more tumor specific because of direct imaging of proliferation, it did not improve tumor detection, staging, or characterization compared with 18F-FDG PET. However, in contrast to 18F-FDG PET, 18F-FLT uptake correlated well with Ki-67 immunohistochemistry in lung, breast, and brain tumors before as well as after the start of treatment (7–10). 18F-FLT PET might therefore have potential as an imaging biomarker for response evaluation. Yet, data of studies investigating early response evaluation using 18F-FLT PET show inconsistent results. Most studies show a correlation between change in 18F-FLT uptake, regular response evaluation using CT, and progression-free survival; nevertheless, often no correlation is found with overall survival (11).
Most studies evaluating 18F-FLT PET as a quantitative imaging biomarker used region-based measurements (i.e., maximum or mean SUV) to assess 18F-FLT uptake. However, in the case of spatially heterogeneous change of tracer uptake, response evaluation using SUVs could be inaccurate (12). Moreover, spatial information can be used to identify resistant tumor subvolumes without change in uptake after therapy (13). In contrast to region-based measurements, spatial information is preserved in voxel-based analysis, yet this has not been validated for 18F-FLT in non–small cell lung carcinoma (NSCLC).
A 2-tissue reversible model with blood volume fraction optimally describes 18F-FLT kinetics using nonlinear regression (NLR) (14) but is not suitable for voxel-based analysis because of its pronounced sensitivity to noise (15). To enable voxel-by-voxel analysis and generate parametric images, several parametric methods could be used (16–19). The objective of this study was to technically validate several plasma input–based parametric methods for quantification of 18F-FLT PET against NLR in advanced-stage NSCLC patients with an activating EGFR mutation before and during TKI treatment. Furthermore, we assessed the robustness of the parametric methods by evaluating the impact of noise on accuracy and precision of the voxel-based analysis.
MATERIALS AND METHODS
Patients
We prospectively included 10 patients with stage IV NSCLC, based on the seventh edition of the International Association for the Study of Lung Cancer, an activating EGFR mutation, and 1 intrathoracic lesion of 3 cm or greater who were scheduled for TKI treatment (Table 1 shows patient characteristics) (14). Patients underwent 3 18F-FLT PET/CT scans on the same scanner: at baseline and 7 and 28 d after start of TKI treatment. The study was approved by the Medical Ethical Review Committee of the VU University Medical Center, and all subjects gave written informed consent. The study was included in the Dutch trial register (trialregister.nl, identification no. NTR3557).
Descriptive Statistics of Patient Characteristics, Median, and P Values from ANOVA
PET Imaging and Data Analysis
Dynamic 18F-FLT scans of the thorax, with the primary tumor positioned centrally in the field of view, were obtained using a Gemini TF-64 PET/CT scanner (Philips Healthcare). Patients fasted 4 h in advance to avoid possible food-induced changes in thymidine uptake and metabolism. A 60-min dynamic PET scan started concurrently with the administration of 370 MBq of 18F-FLT (5 mL) at 0.8 mL·s−1, flushed with 35 mL of saline at 2.0 mL·s−1. Directly after the PET scan, a low-dose CT scan was obtained for attenuation correction. The dynamic 18F-FLT scans were reconstructed into 36 frames (1 × 10, 8 × 5, 4 × 10, 3 × 20, 5 × 30, 5 × 60, 4 × 150, 4 × 300, and 2 × 600 s) using a 3-dimensional row action maximum likelihood algorithm, resulting in a 6.5-mm spatial resolution in full width at half maximum. All scans were corrected for dead time, decay, scatter, and randoms, and no smoothing or motion correction was applied. During the 18F-FLT scan, 6 venous blood samples were drawn at 5, 10, 20, 30, 40, and 60 min after injection (14).
Volumes of interest (VOIs) were drawn on an averaged image of the last 3 frames (35–60 min). VOIs were obtained by delineating all 18F-FLT–avid tumors with a 50% isocontour of the peak of the SUV (a 1.2-cm3 spheric region positioned to maximize its mean value), corrected for local background. Time–activity curves were extracted by projecting these VOIs onto the dynamic 18F-FLT scan. Furthermore, an image-derived input function was generated by placing a 2 × 2 voxel (8 × 8 mm) VOI in 5 consecutive planes in the ascending aorta. The image-derived input functions were recalibrated using the radioactivity concentrations measured in the venous samples and the image-derived input functions values at corresponding times (recalibration factors: median, 0.86; interquartile range, 0.80–0.94). Moreover, 18F-FLT plasma input curves were obtained by correcting the calibrated image–derived input functions for plasma-to-blood ratios derived from the manual samples and interpolated between the sample times (14).
Parametric Analysis
Parametric images were generated using 3 different parametric methods: LGA and 2 basis functions–based methods, spectral analysis (SA) and basis function model (BFM). We also looked into the Patlak graphical analysis but did not include it in the article because this method is not suitable in the case of reversible tracer kinetics. Pharmacokinetic parameters for LGA and SA were obtained as previously described by Verwer et al. (15). For the BFM, the following algorithm was used (19): Eq. 1where
 Eq. 2
Eq. 2 ,
,  , and
, and  resemble the tissue, plasma, and whole-blood activity concentration, respectively; t is the time after injection; and
  represents the blood volume fraction. After estimating the range of basis functions by filling out the known pharmacokinetic values obtained with NLR in Equation 2, Equation 1 can be solved and kinetic rate constants can be calculated.
VT was obtained using the LGA, SA, and BFM, and additionally K1 was calculated using SA and BFM. Parametric VT and K1 images for all methods were obtained through voxelwise analysis of the dynamic 18F-FLT PET scans using various parameter input settings for the different models (Supplemental Table 1; supplemental materials are available at http://jnm.snmjournals.org). To increase calculation efficiency, tumor masks were first drawn (similar to tumor VOIs), and subsequently only parametric images of the tumor mask region were generated for SA and BFM. Whole-tumor–averaged parametric pharmacokinetic parameters were obtained by projecting VOIs onto the parametric images. Results were compared with pharmacokinetic parameters calculated using NLR, for which tumor time–activity curves were fitted using a 2-tissue-compartment reversible model with blood volume fraction correction as described by Frings et al. (Supplemental Fig. 1) (14).
Noise Evaluation
To evaluate the sensitivity of these parametric methods to noise, 2 statistically and hemodynamically equivalent datasets were generated by countwise splitting of the original list-mode data (e.g., set 1: count 1, 3, 5, etc.). Both datasets contained 50% of the total counts and were reconstructed separately. New parametric images were generated, and whole-tumor–averaged parametric pharmacokinetic parameters were recalculated using the methods described above. These values were compared reciprocally and with the original data.
Statistical Analysis
Correlation between pharmacokinetic parameters obtained using NLR and whole-tumor–averaged parametric pharmacokinetic parameters for the different parameter input settings were assessed using linear regression analysis. In addition, correspondence was assessed with the intraclass correlation coefficient (ICC), and Bland–Altman plots were generated to visualize correspondence and variability. Optimal parameter input settings for the parametric methods were defined as the best correlation (highest R2 and ICC) in combination with the smallest deviation. Moreover, the images were visually inspected to assess whether any artifacts were present and pharmacokinetic values were within reference range. The correlation between the pharmacokinetic parameters obtained using the split and the original list-mode data was analyzed at whole tumor as well as at voxel level using the statistical methods described above. Additionally, the influence of noise was assessed using the repeatability coefficient (RC) calculated as 1.96 × SD of the relative differences. All statistical analyses were performed using SPSS 20 (IBM Corp.).
RESULTS
Parametric Analysis
In total, 29 18F-FLT PET scans were obtained; 1 PET scan at baseline was not available because of scanner failure. At baseline, we identified 27 evaluable lesions (uptake above background), of which 25 and 19 lesions remained detectable 7 and 28 d after the start of treatment, respectively (Table 1). One patient was excluded from the analyses because no 18F-FLT–avid lesions were present.
After optimization of input parameter settings for the different models, VT derived using LGA, BFM, and SA all correlated well with VT obtained using NLR at baseline as well as after the start of treatment. All methods generated qualitatively good parametric images before and during treatment; no artifacts were present and pharmacokinetic values were within reference range. As shown, it is technically possible to demonstrate spatial heterogeneity of the tumor and assess changes during treatment (Supplemental Fig. 2).
For LGA, the best correspondence was found with a start time of 20 min after injection showing a small negative bias (ICC, 0.97; R2, 0.96; and slope, 0.83) (Fig. 1). The effect of start time on LGA-based VT was limited; start times between 15 and 25 min showed similar results (ICC > 0.95; R2 > 0.95, and slopes, 0.78–0.83). The BFM yielded the best outcome with a set of 20 exponents per set of bases, ranging from 0.01 to 0.1 min−1 and 0.1 to 3 min−1 for the first and second set of basis functions, respectively. BFM also showed a minimal bias using these settings (ICC, 0.99; R2, 0.98; and slope, 0.92). SA using 50 basis functions with exponents from 0.01 to 4 min−1 showed a correlation comparable to BFM (ICC, 0.96; R2, 0.92; and slope, 0.97), yet a larger systematic error was present in SA (Fig. 1; Supplemental Fig. 3). For both methods, the effect of selected basis function exponents on VT was limited as long as the first basis exponent was set to 0.01 min−1. Bland–Altman plots of the absolute differences can be found in Supplemental Figure 4.
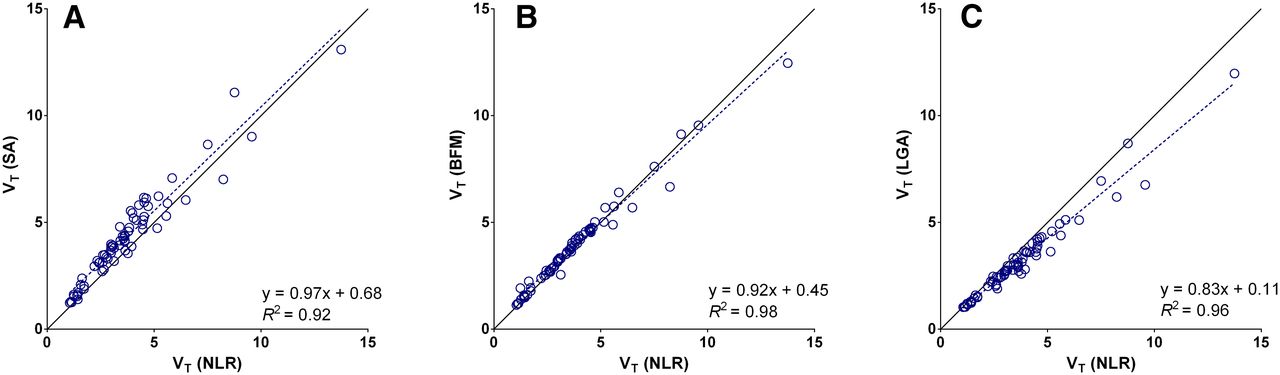
BFM- (A), SA- (B), and LGA- (C) based pharmacokinetic parameters plotted against their NLR-derived counterparts for all tumor VOIs. LGA shows some negative bias compared with gold standard. For both BFM and SA, there is a strong correlation, however, variability of SA is slightly larger. Corresponding Bland–Altman plots can be found in Supplemental Figure 3.
Both the BFM and the SA provided accurate K1 values compared with NLR, but SA showed larger variability (ICC, 0.96 vs. 0.89 and R2, 0.94 vs. 0.80 for BFM and SA, respectively) (Fig. 2; Supplemental Fig. 5). K1 values remained stable for BFM with different basis function exponents, yet decreased accuracy for SA.
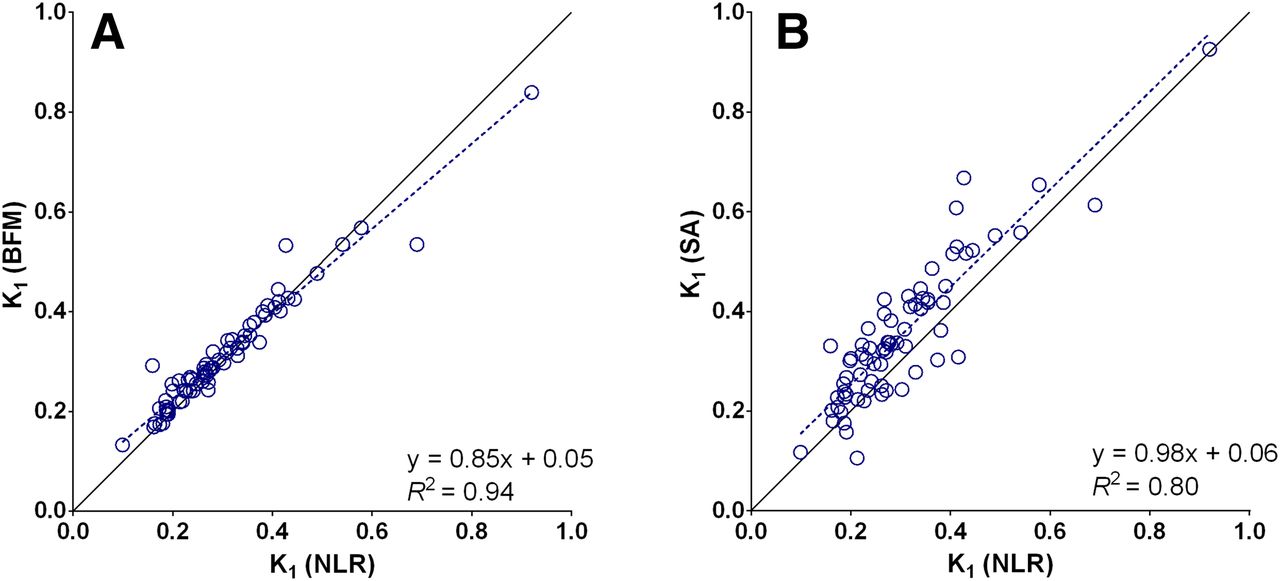
BFM- (A) and SA- (B) based K1 plotted against NLR-derived K1 for all tumor VOIs. SA-derived K1 shows significantly larger systematic error BFM. Corresponding Bland–Altman plots can be found in Supplemental Figure 4.
Noise Evaluation
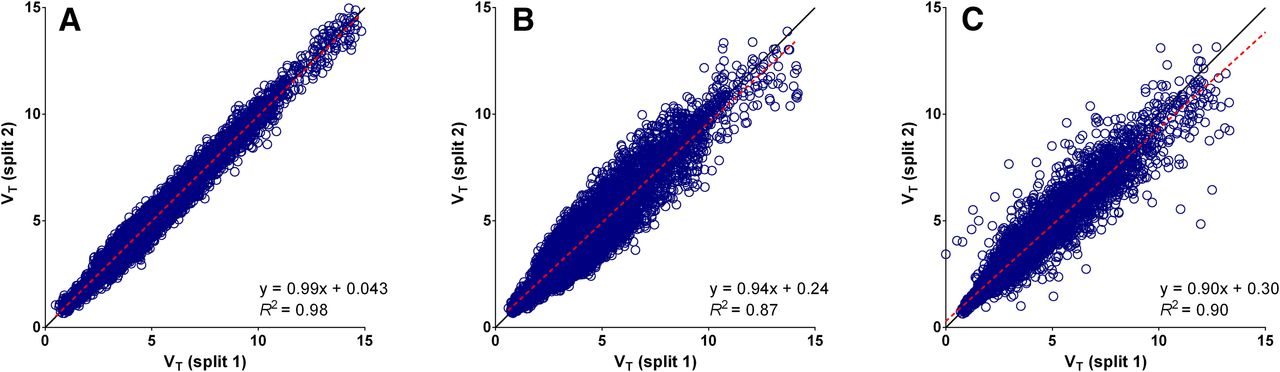
Original list-mode data were saved and available for 16 of the 26 18F-FLT PET/CT scans. The raw low-dose CT data needed for attenuation correction was not correctly stored for the remaining 10 scans and therefore these split datasets could not be reconstructed. Parametric images generated and VT calculated using the split data showed a strong correlation reciprocally on a voxel-by-voxel (R2 > 0.87) and on a whole-tumor level (R2 > 0.98) for all parametric methods (Figs. 3 and 4; Supplemental Figs. 6–8). Small but significant differences were detected on a regional level between the VT derived from the original data and the split data for all parametric methods (P < 0.05), although mean differences were less than 5%. Differences in whole-tumor–averaged pharmacokinetic parameters between both split scans were not significant, and RCs of VT data were small (LGA, 7%; BFM, 8%; SA, 13%). However, if parametric VT images were compared on a voxel level, SA showed the best correspondence and smallest variability (LGA, 26%; BFM, 35%; SA, 16%).

Scatterplots showing VT values of individual voxels of both split datasets plotted reciprocally for all available VOIs. Strongest correlation between both datasets is found for SA (A). BFM (B) and LGA (C) show weaker correlation and larger variability than SA. This is in contrast to expectations because SA is known to be sensitive to noise. Supplemental Figure 6 shows correlation on whole-tumor level.
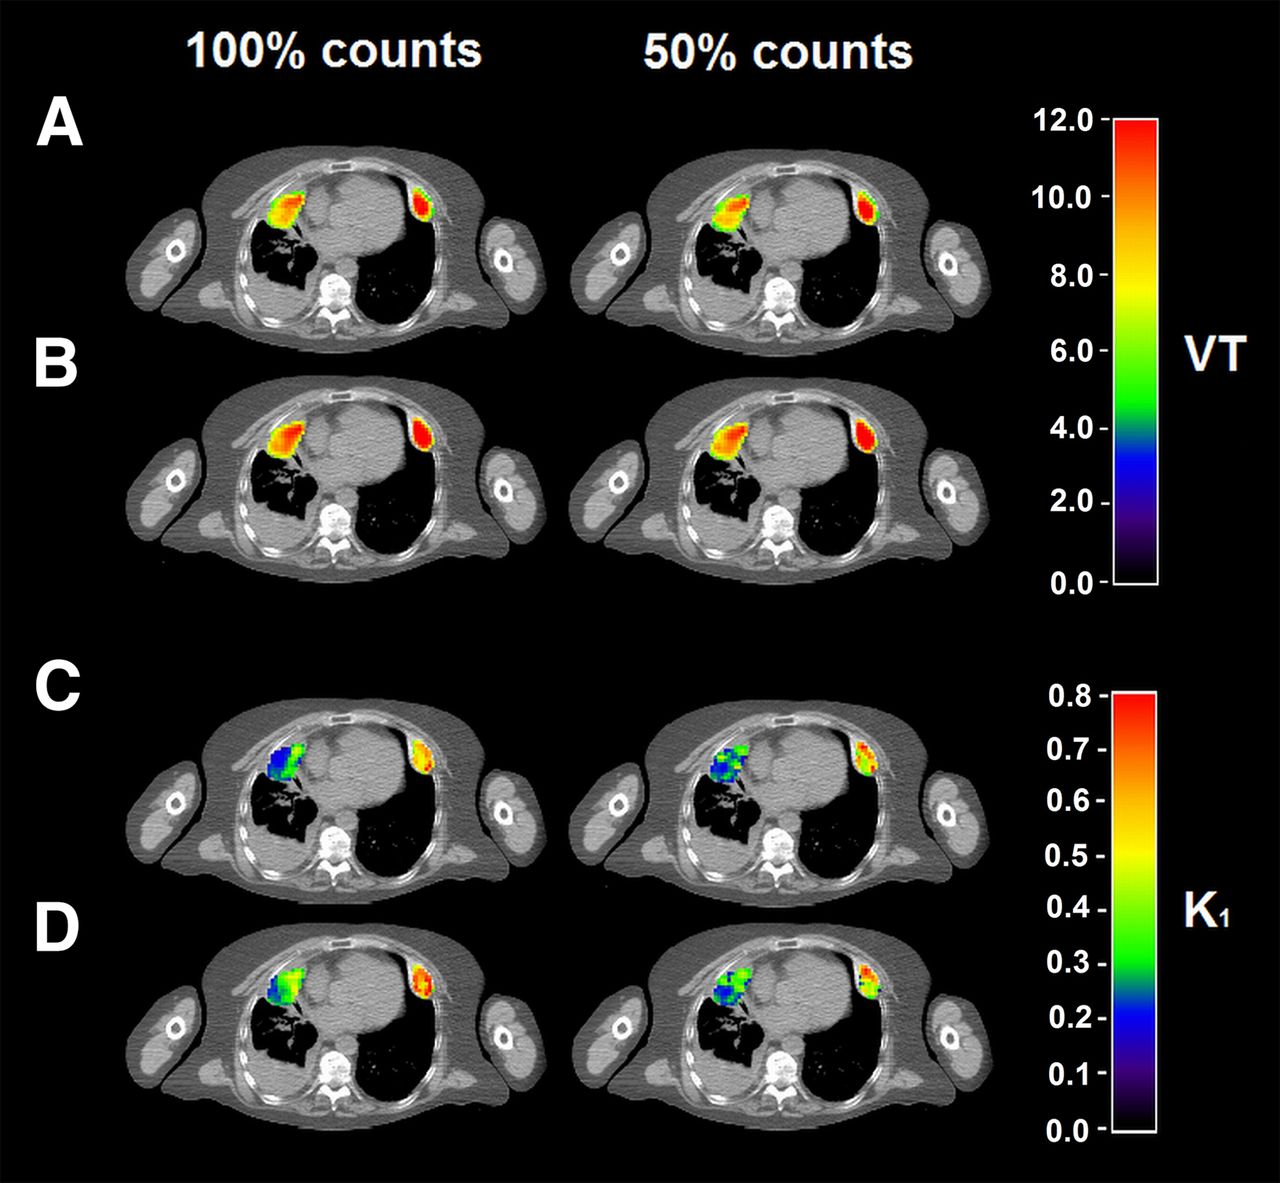
Parametric VT (A and B) and K1 (C and D) images produced with optimal parameter settings for BFM (A and C) and SA (B and D) using nonsplit data (100% counts) and split data (50% counts). Parametric VT and K1 images for LGA can be found in Supplemental Figure 8.
Variability of regional K1 values calculated using BFM and SA on a whole-tumor level was larger compared with VT (RCs, respectively, 27% and 26%), yet the correlation remained strong for SA and BFM (R2, 0.87 and 0.91, respectively). In contrast, at the voxel level the correlation of K1 between both datasets was poor (R2 < 0.45) and variability significantly increased when assessed at the parametric level (RCs, 80% and 84%, respectively) (Figs. 4 and 5).
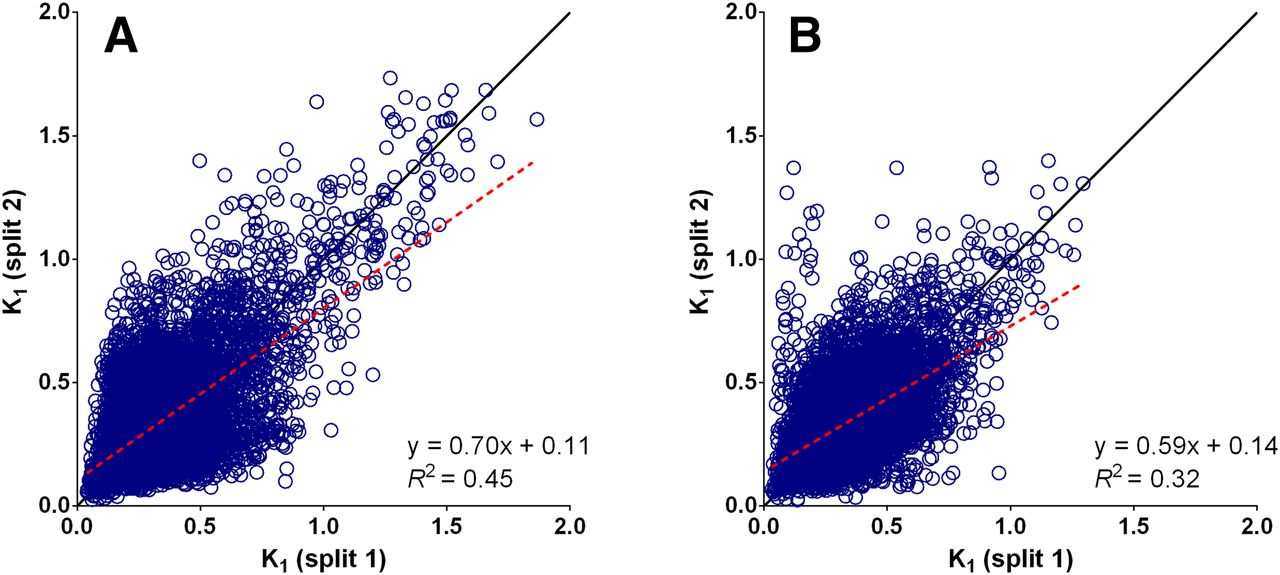
Scatterplots showing K1 values of individual voxels of both split datasets plotted reciprocally for all available VOIs. Correlation on voxel level between both datasets was weak for BFM (A) as well as SA (B). Supplemental Figure 7 shows correlation on whole-tumor level.
DISCUSSION
The present study investigated the performance of voxel-based kinetic analysis of 18F-FLT PET/CT scans in NSCLC patients before as well as during treatment. This analysis enabled quantification at the voxel level and allowed the use of more detailed spatial information in response assessment. As expected, the most accurate parametric images were generated using a parametric method that took the reversible tracer kinetics of 18F-FLT into account. The BFM provided quantitative accurate and robust parametric VT and K1 images. There was a small underestimation for both parameters, possibly explained by noise-induced bias, which can influence results at the boundaries of the basis function range (19). However, the limited number of lesions showing a high VT or K1 could also explain these findings (Fig. 1). The performance of BFM in this study for reversible ligands was similar to the BFM methods presented by Rizzo et al. (20), but they found a significant underestimation of kinetic parameters for the voxel-based analysis (Eq. 1). Correlation of irreversible ligands with NLR showed similar results, for example, when producing 18F-FDG–based Ki maps in the brain (19). To our knowledge, our study is the first evaluating the BFM outside of the brain.
SA also yielded accurate VT and K1 images. Larger variability of SA-based K1 compared with BFM is most likely a result of sensitivity to noise, a well-known limitation of SA (21). These results are congruent to those found in other studies evaluating reversible tracers in NSCLC (15).
Although LGA also generated robust VT images, it showed some negative bias compared with NLR. Underestimation of LGA-based VT is most likely explained by noise-induced bias because the effect tends to be larger in regions with higher VT (Fig. 1) (22). In addition, the blood volume fraction is not included in LGA, which could give biased results. Another drawback of LGA compared with basis function–based methods is that they do not provide K1.
To test for internal validity and sensitivity to noise, we split the original data into 2 datasets as if only 50% of the total activity was injected. This method can be applied on dynamic as well as static PET acquisition data and allows assessment of the robustness of the data without having to scan additional patients. For this study, we have assessed only robustness by splitting acquisition data in half, but in principle this could also be done in smaller partitions.
Unfortunately, not all original datasets were available for re-analysis. However, data of all 3 time points were available and near equally distributed (baseline = 5 scans; day 7 = 6 scans; day 28 = 5 scans). On the whole-tumor level, no significant differences were found in RCs among the LGA-, SA-, or BFM-based VT. However, in contrast to expectations SA showed the lowest sensitivity to noise on a voxel level compared with the other parametric methods. Because SA is known to be sensitive to noise, we expected that a decrease in signal-to-noise ratio would affect this method most. We found no differences in sensitivity of K1 images to noise among the different methods. Yet, in general K1 was more sensitive to noise than VT. Because K1 is more sensitive to small differences in input function, the impact of increased relative noise was expected to be more pronounced (15).
An advantage of LGA is the short computing time compared with BFM and in particular SA (both > 10 min). Other studies described computational times of more than 5 h for brain scans only (20,23). Long computing times for basis function–based methods are mainly caused by the number of basis functions chosen and voxels containing air (it is difficult to find the best fit for air-containing voxels). To overcome this problem, parametric calculations were performed only for voxels within a tumor mask. Excluding voxels containing air and minimizing the number of voxels to only those in and near the tumor significantly decreased computing times to less than 1 min and 4–5 min for BFM and SA, respectively.
The accuracy and robustness of voxel-by-voxel analysis were not influenced by TKI treatment, and no adjustment of input parameter setting was needed, enabling the use of parametric 18F-FLT images for response evaluation during treatment and assessment of spatially heterogeneous changes in tracer uptake. Additionally, parametric images can be used for other purposes requiring detailed spatial information such as radiation dose painting and better understanding of tumor biology and mechanisms accountable for treatment failure (11,15,24,25).
Published data on the use of 18F-FLT as an imaging biomarker for early response are contradictory. Most studies show an inverse correlation between decrease in 18F-FLT uptake and progression-free survival during TKI treatment, yet no association with overall survival (11). Here, only VOI-based analysis of the data was performed, and therefore intralesional variations in response could not be assessed. One study assessed response using Patlak and SA in breast cancer and concluded that parametric images could provide more detailed information about tumor characterization and improved predictive performance of 18F-FLT compared with SUVs (26). Yet, this has to be investigated in larger interventional studies because overall survival can also be influenced by subsequent treatment (27).
The number of subjects in this study is small, but seems sufficient to assess the parametric methods because of the consistency of the results over a large range of pharmacokinetic values. In addition, we also tested the robustness of the results and found limited variability and sensitivity to noise, supporting the strength of presented results. A drawback of parametric analysis in general is the need for an elaborate acquisition protocol and consequently higher patient burden due to long scan times. The additional spatial information, however, has the potential to significantly improve patient management. Moreover, a current limitation of implementing parametric analysis in daily practice is the limited availability of parametric methods in commercially available PET analysis software. Yet all the parametric methods can be integrated in future software packages, because all algorithms used in the study are published and freely available. We would therefore like to recommend that companies develop commercially available PET analysis software to implement these parametric methods.
CONCLUSION
This study assessed the performance of parametric analysis for quantification of 18F-FLT PET at a voxel level. BFM and SA can both generate quantitative accurate parametric 18F-FLT VT images in NSCLC patients before and during therapy in contrast to LGA. The BFM-based VT data were less robust than SA on a voxel-by-voxel level, yet BFM provided more accurate parametric K1 data, all within acceptable computational times. We therefore recommend BFM as the preferred parametric method for analysis of dynamic 18F-FLT PET/CT studies; however, SA can also be safely used.
DISCLOSURE
The research leading to these results has received support from the Innovative Medicines Initiative Joint Undertaking (www.imi.europa.eu; grant agreement no. 115151), whose resources are composed of a financial contribution from the European Union’s Seventh Framework Programme (FP7/2007-2013) and an in-kind contribution from the companies of the European Federation of Pharmaceutical Industries and Associations. We also acknowledge the Quantitative Imaging in Cancer: Connecting Cellular Processes with Therapy project (QuIC-ConCePT project) from the Innovative Medicines Initiative (IMI) for partly funding the project. No other potential conflict of interest relevant to this article was reported.
Footnotes
Published online Nov. 10, 2016.
- © 2017 by the Society of Nuclear Medicine and Molecular Imaging.
REFERENCES
- Received for publication May 20, 2016.
- Accepted for publication October 21, 2016.


Jump to section
Related Articles
Cited By...
- No citing articles found.