


Abstract
We evaluated how troglitazone influences cancer cell glucose metabolism and uptake of 18F-FDG, and we investigated its molecular mechanism and relation to the drug’s anticancer effect. Methods: Human T47D breast and HCT116 colon cancer cells that had been treated with troglitazone were measured for 18F-FDG uptake, lactate release, oxygen consumption rate, mitochondrial membrane potential, and intracellular reactive oxygen species. Viable cell content was measured by sulforhodamine-B assays. Results: Treatment with 20 μM troglitazone for 1 h acutely increased 18F-FDG uptake in multiple breast cancer cell lines, whereas HCT116 cells showed a delayed reaction. In T47D cells, the response occurred in a dose-dependent (threefold increase by 40 μΜ) manner independent of peroxisome proliferator-activated receptor-γ and was accompanied by a twofold increase of lactate production, consistent with enhanced glycolytic flux. Troglitazone-treated cells showed severe reductions of the oxygen consumption rate, indicating suppression of mitochondrial respiration, which was accompanied by significantly decreased mitochondrial membrane potential and increased concentration of reactive oxygen species. Troglitazone dose-dependently reduced T47D and HCT116 cell content, which was significantly potentiated by restriction of glucose availability. In T47D cells, cell reduction closely correlated with the magnitude of increase in relative 18F-FDG uptake (r = 0.821, P = 0.001). Conclusion: Troglitazone stimulates cancer cell uptake of 18F-FDG through a shift of metabolism toward glycolytic flux, likely as an adaptive response to impaired mitochondrial oxidative respiration.
Troglitazone is an antidiabetic drug that belongs to the class of thiazolidinediones, which activate peroxisome proliferator-activated receptor-γ (PPARγ) to bind specific transcriptional response elements (1). Although troglitazone was withdrawn from the antidiabetic market, mounting current evidence reveals that the drug exerts antitumor actions on a broad range of cancers (2–5). Characterizing new therapeutic targets of compounds previously approved for different indications by the Food and Drug Administration lends support to drug repurposing. Thus, recognition of the anticancer property of troglitazone has sparked an intense interest in elucidating its molecular mechanism of action.
Unlike the drug’s antidiabetic effects, many nontarget actions of troglitazone are thought to occur in a PPARγ-independent manner. Although the precise mechanisms for such actions have yet to be clarified, a role for direct influence on mitochondrial function has been proposed (6). Mitochondrial dysfunction has been implicated in the hepatotoxic side effect of troglitazone by observations of a rapid drop of mitochondrial membrane potential (MMP) in isolated hepatocytes (7) and hepatic cancer–derived cells exposed to the drug (8). In a more recent study, troglitazone was observed to also induce an acute reduction of MMP in breast cancer cells (9).
Influence on mitochondrial function could also explain the ability of troglitazone to modulate glucose metabolism. The drug is known to rapidly stimulate muscle tissue glycolysis while reducing mitochondrial fuel oxidation (10). A similar effect on glucose metabolism was also shown in mesangial cells (11). Heightened glycolysis is a major cancer hallmark (12,13). However, there is limited insight as to how troglitazone modulates cancer cell glucose metabolism. Rosiglitazone (Cayman Chemical) was previously shown to increase 18F-FDG uptake in tumor cells (14). A more recent study on prostate cancer cells showed that glitazone-induced suppression of proliferation was accompanied by stimulation of glycolysis and reduced oxygen consumption (15). In another recent study, breast cancer cells treated with troglitazone showed an acute increase of glycolysis with reduced MMP (9). Taken together, the antitumor action of troglitazone may be linked to modulation of cancer cell mitochondrial function and glucose metabolism.
One of the greatest clinical needs in oncology is the ability to accurately monitor tumor response to treatment. PET is widely used in patients with cancer, in whom tumor uptake of 18F-FDG can serve as a sensitive indicator of response to therapy (16). Cancer cells are heavily dependent on heightened glucose use for survival and proliferation (12,13). Furthermore, glucose metabolism is indirectly influenced by many chemotherapeutic agents and is directly targeted by several recent anticancer drugs (17). Hence, investigating how newer anticancer drugs influence tumor uptake of 18F-FDG and exploring the mechanism involved not only may help uncover new targets for therapeutic exploitation but also could create opportunities to expand the role of PET for patient management (18).
In this study, we investigated how troglitazone affects cancer cell uptake of 18F-FDG through reprograming of glycolytic metabolism and mitochondrial respiration, and we further explored whether this metabolic response may render cancer cells more susceptible to restricted glucose availability.
MATERIALS AND METHODS
Cell Culture
T47D, MDA-MB-468, MDA-MB-231, and MCF-7 human breast cancer cells and HCT116 human colon cancer cells from the American Type Culture Collection (ATCC) were maintained in an RPMI-1640 medium (Gibco BRL) supplemented with 10% fetal bovine serum, 2 mM l-glutamine, and penicillin–streptomycin at 100 U/mL in 5% CO2 at 37°C. For breast cancer cell experiments, 5% charcoal-stripped serum was used to avoid effects from trace amounts of estrogen.
Measurement of 18F-FDG Uptake
Cells in 12-well or 24-well plates (time- and dose-dependent experiments) treated with troglitazone (Sigma) or vehicle were incubated with 18F-FDG added to each well at a final concentration of 370 kBq/mL. The effects of 2-deoxyglucose (Sigma), GW9662 (Sigma), PD98059 (Sigma), BIBX-1382 (Santa Cruz Biotech), and compound-C (Calbiochem) were evaluated by addition to the medium 1 h before initiating troglitazone treatment. After a 40-min incubation with 18F-FDG in 5% CO2 at 37°C, cells were washed twice with cold phosphate-buffered saline (PBS) and lysed with 0.1N NaOH. Cell-associated radioactivity was measured on a γ-counter (Wallac) and expressed as percent uptake per well relative to controls.
Lactate Assay
Culture medium collected from cells was assayed for l-lactate concentration with a Cobas kit (Roche/Hitachi) according to the manufacturer’s instructions. The assay uses an enzymatic reaction that converts lactate to pyruvate and hydrogen peroxide. Hydrogen peroxide then undergoes an enzymatic reaction to generate a colored dye that is measured by a Roche/Hitachi analyzer. Calibration curves were prepared, and lactate concentrations in the samples were always within the linear range of the assays.
Oxygen Consumption Rate
Cells seeded into XF24 24-well plates (Seahorse Bioscience) at 60,000 cells per well were equilibrated with 525 μL of serum-free RPMI-1640 (no sodium bicarbonate; pH 7.4) at 37°C without CO2 for 1 h. Oxygen concentration in the medium was measured on an XF24 extracellular flux analyzer (Seahorse Bioscience) with solid-state sensor probes. Oxygen consumption rate (OCR) was measured during basal respiration and after treatment with troglitazone. Oligomycin (1.2 μM; Sigma) was used to inhibit complex V, carbonyl cyanide-p-trifluoromethoxyphenylhydrazone (FCCP, 4 μM; Sigma), to uncouple the proton gradient and antimycin A (10 μM; Sigma) to inhibit complex III. These agents were sequentially added to the medium of troglitazone and vehicle-treated cells while OCR was automatically calculated, recorded, and plotted using Seahorse XF24 software v1.8.
Quantification of Intracellular Reactive Oxygen Species
Intracellular reactive oxygen species (ROS) concentration was quantified using a CM-H2DCFDA molecular probe (Invitrogen), a dye that passively diffuses into cells, undergoes removal of acetate groups by esterases, and is oxidized by ROS to yield a fluorescent adduct. Briefly, culture medium was removed from cells on a 96-well black plate, and 100 μL of 10 μM CM-H2DCFDA in PBS were added. After incubation at 37°C in 5% CO2 for 30 min, cells were washed with warmed PBS, and 100 μL of PBS were added to each well. Fluorescence was finally measured on a microplate reader using 490-nm excitations and 510- to 570-nm emission wavelengths. Calibration curves were prepared, and intracellular ROS concentrations of samples were always within the linear range of the assays.
Measurement of Cellular MMP
For MMP measurements, cells were seeded at densities of 5 × 10⁴ per well in a 96-well black plate with a transparent bottom. Culture medium was removed, and wells were replenished with 100 μL of PBS containing 500 nM of Mitotracker Red FM (Invitrogen), a fluorescent dye that stains mitochondria of living cells as a function of MMP. Cells were incubated for 30 min at 37°C in 5% CO2 and then washed with 100 μL per well of warmed PBS. Fluorescence remaining in each well was measured on a microplate reader using 594-nm excitations and 642-nm emission wavelengths.
Immunoblotting for Membrane Glucose Transporter-1 Expression
Cells were washed with PBS and made into a solution with 500 μL of lysis buffer containing 0.0856 g of sucrose per milliliter, 10 mM HEPES (4-[2-hydroxyethyl]-1-piperazineethanesulfonic acid), 25 μM ethylenediaminetetraacetic acid, 10 μg of aprotinin per milliliter, 10 μg of leupeptin per milliliter, and 1 mM phenylmethylsulfonyl fluoride. Cell debris was eliminated by centrifugation at 1,000g, and the supernatant was incubated at 4°C for 1 h with 1.5 mL of lysis buffer (0.0856 g of sucrose per milliliter, 10 mM HEPES, and 10 mM magnesium chloride). After centrifugation at 45,000 rpm for 60 min, the membrane fraction pellet was dissolved in PBS, and 20 μg were separated on a 10% polyacrylamide gel. The protein was transferred to a Hybond ECL nitrocellulose membrane (Amersham Biosciences) and incubated overnight at 4°C with a polyclonal antihuman glucose transporter-1 (GLUT-1) antibody (Abcam; 1:1,000 dilution). Immune reactive proteins were detected with an enhanced chemiluminescence system and measured by a GS-800TM calibrated densitometer and Quantity One software (both from Bio-Rad Laboratories).
Measurement of Viable Cell Content
Viable cell content was measured by sulforhodamine-B assays on a 96-well plate of cells seeded in phenol-red free medium containing graded concentrations of glucose. After treatment with troglitazone or vehicle for 24 h, cells were fixed with 10% (w/v) trichloroacetic acid and stained with sulforhodamine-B for 30 min. After excess dye was removed by repeated washing with 1% (v/v) acetic acid, protein-bound dye was dissolved in a 10 mM Tris base solution and measured for optical density at 510 nm on a microplate reader.
Statistical Analysis
All data are presented as mean ± SD of samples. Significance in difference between groups was analyzed using Student t tests for 2 groups and ANOVA with Tukey post hoc tests for 3 or more groups. The relation between cell survival and 18F-FDG uptake was assessed using linear correlation analysis. P values of less than 0.05 were considered statistically significant.
RESULTS
Troglitazone Augments Cancer Cell Uptake of 18F-FDG
Uptake of 18F-FDG in T47D, MDA-MB-468, MDA-MB-231, and MCF7 human breast cancer cells rapidly increased after a 1-h treatment with 20 μM troglitazone to 277.0% ± 10.2%, 167.3% ± 6.5%, 144.7% ± 6.4%, and 223.0% ± 7.5% of controls, respectively (Fig. 1). In HCT116 human colon cancer cells, uptake of 18F-FDG by 20 μM troglitazone was not increased for up to 2 h but was significantly increased thereafter to 154.4% ± 5.9% of controls by 6 h and 244.5% ± 28.8% of controls by 24 h (Fig. 1).
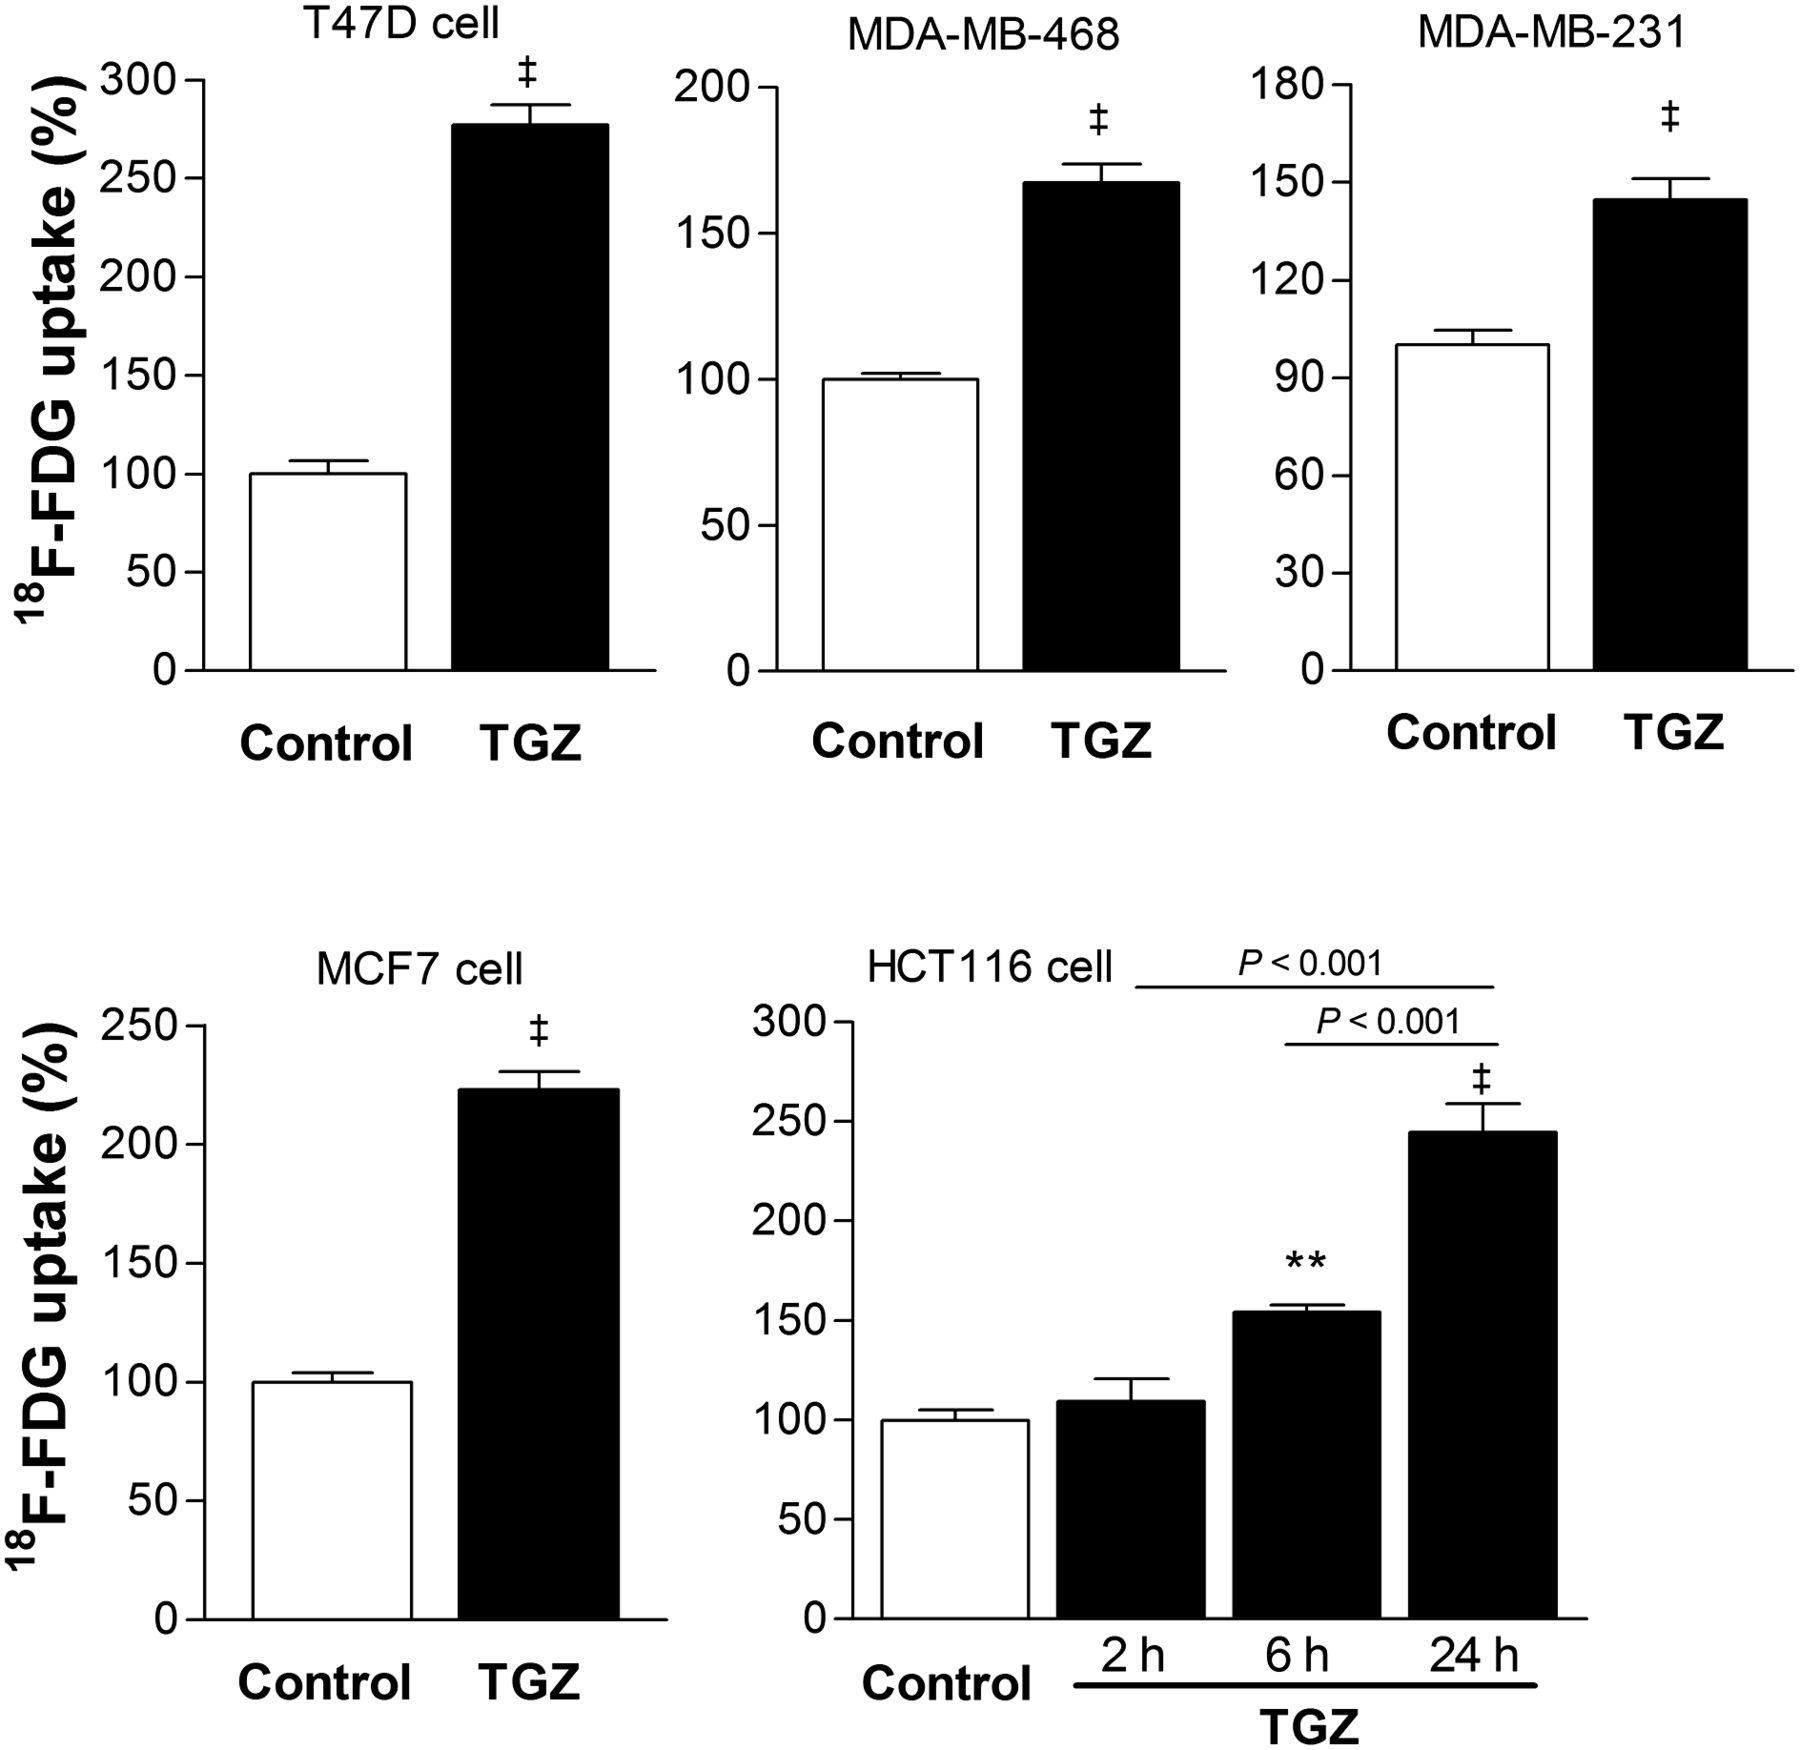
Troglitazone augments 18F-FDG uptake of cancer cells. Various human breast cancer cells were measured for 18F-FDG uptake after treatment with vehicle (control) or 20 μM troglitazone for 1 h. HCT116 human colon cells were treated with 20 μM troglitazone for 2, 6, or 24 h. Data are mean ± SD (n = 3) percent uptake relative to controls. TGZ = troglitazone. ‡P < 0.001, compared with controls. **P < 0.01, compared with controls.
Time course experiments in T47D cells showed a rapid response, with a 28.8% ± 9.4% increase of 18F-FDG uptake after only 10 min of exposure to 20 μM troglitazone and a plateau from 1 to 4 h (Fig. 2). Stimulation of 18F-FDG uptake by troglitazone occurred in a dose-dependent fashion that began at 2 μM, linearly increased with graded dose increments (r = 0.963, P < 0.0001), and reached 294.3% ± 27.9% of controls by a dose of 40 μM (Fig. 2).
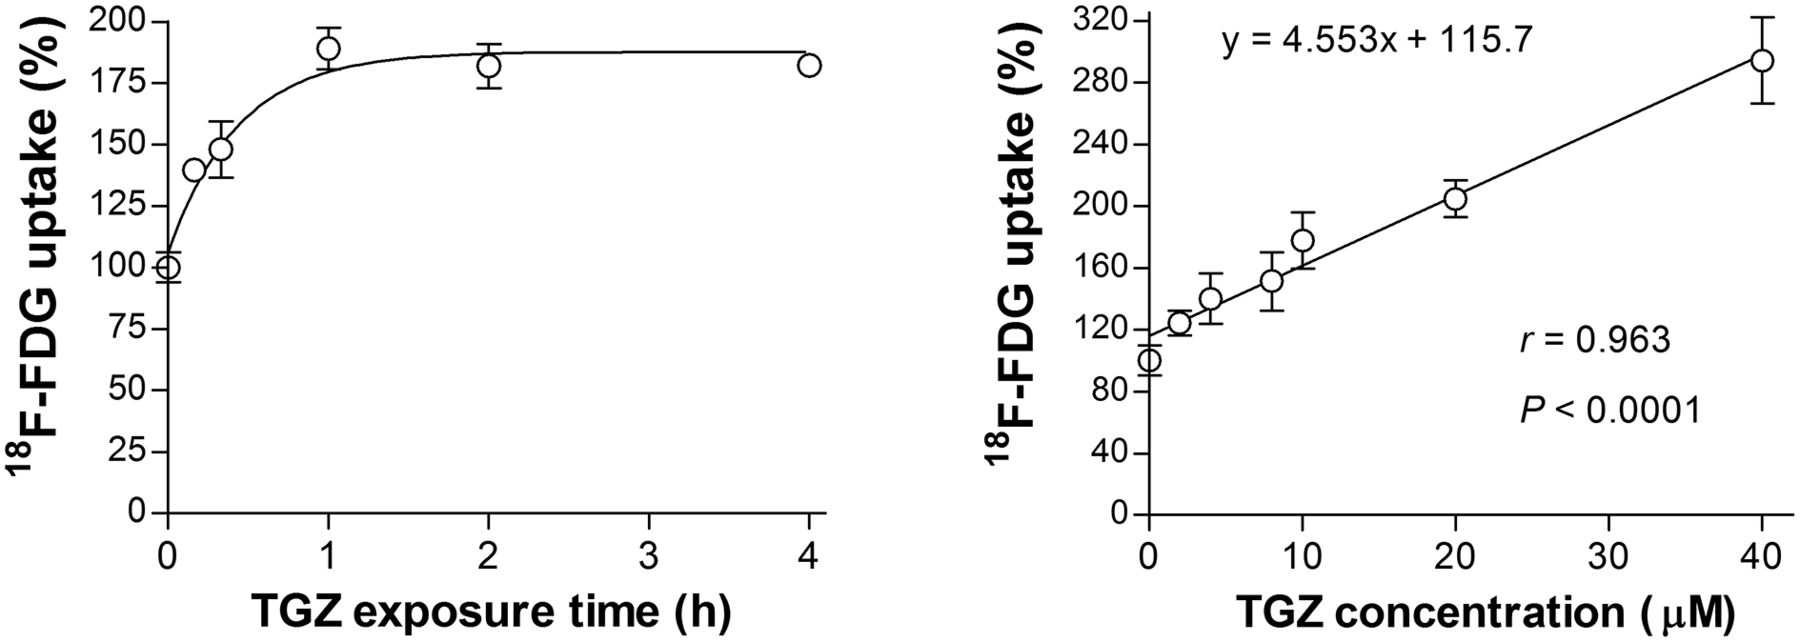
Time- and dose-dependent troglitazone effects on T47D cell 18F-FDG uptake. (Left) Time course of 18F-FDG uptake stimulated by 20 μM troglitazone. (Right) Effects of 1-h treatment with graded concentrations of troglitazone on 18F-FDG uptake. Data are mean ± SD (n = 3) percent uptake relative to controls. TGZ = troglitazone.
Troglitazone Enhances Glycolytic Flux in a PPARγ-Independent Manner
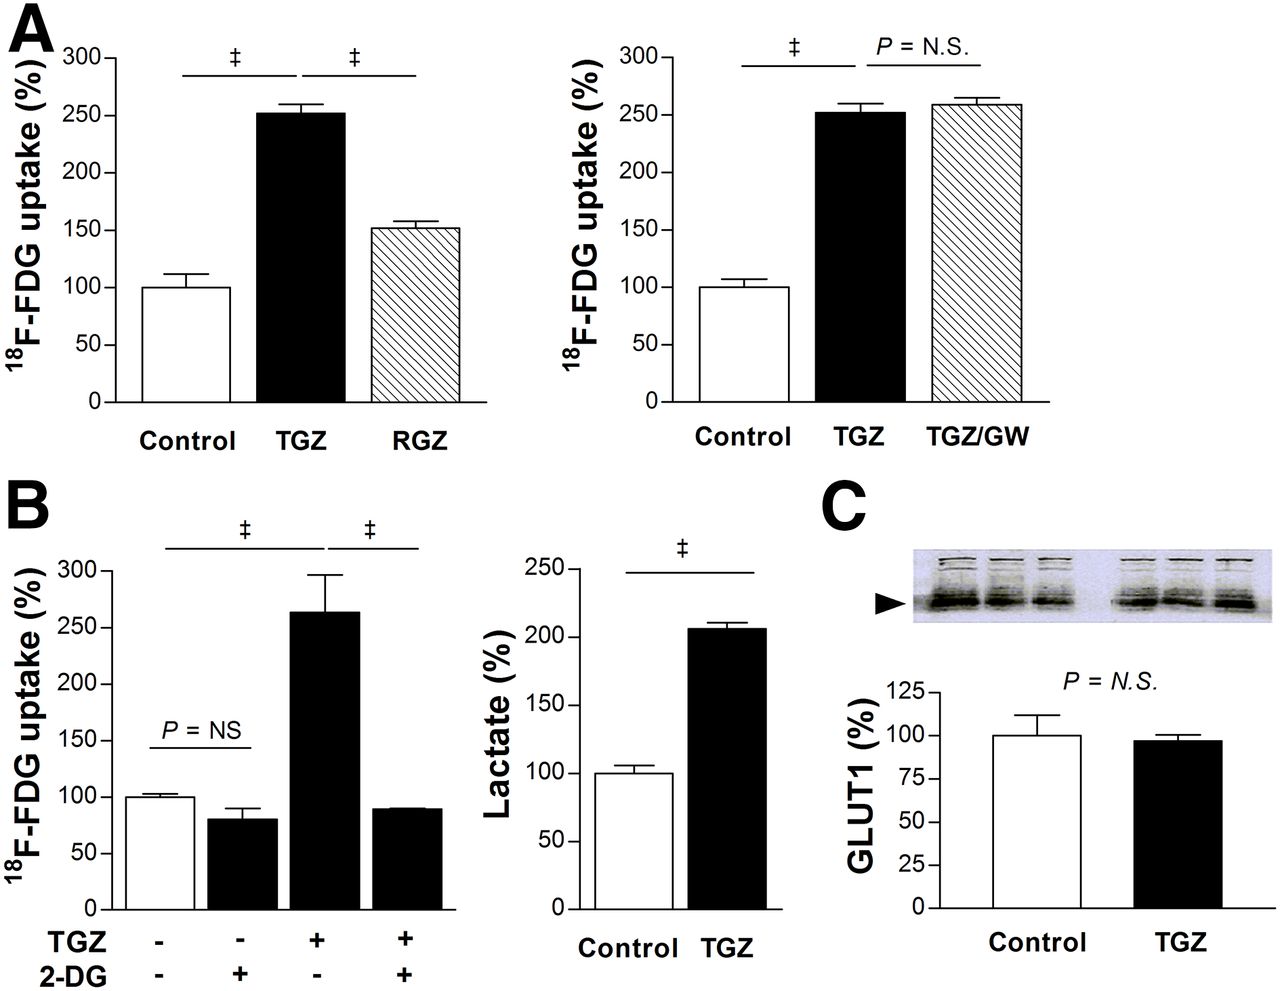
Rosiglitazone, a thiazolidinedione with stronger PPARγ-activating potency than troglitazone, showed a weaker stimulatory effect than troglitazone on the uptake of 18F-FDG in T47D cells (152.0% ± 6.0% vs. 252.0% ± 7.8% of controls; Fig. 3A). Moreover, the irreversible PPARγ antagonist GW9662 completely failed to suppress the ability of troglitazone to augment 18F-FDG uptake (Fig. 3A).

Troglitazone augments T47D cell glycolytic flux in PPARγ-independent manner. (A) Comparison of 18F-FDG uptake stimulated by troglitazone and stronger PPARγ activator rosiglitazone (left), and influence of PPARγ inhibition with 10 μM GW9662 (right). (B) Complete blocking of troglitazone-stimulated 18F-FDG uptake by glycolysis inhibitor 2-deoxyglucose (2 mM, left), and increased lactate production by troglitazone (right). (C) Western blotting of cell membrane GLUT-1 expression. Bars are mean ± SD (n = 3) of percent values relative to controls. ‡P < 0.001. 2-DG = 2-deoxyglucose; GW = GW9662; N.S. = not significant; TGZ = troglitazone; RGZ = rosiglitazone.
The stimulatory effect of troglitazone on the uptake of 18F-FDG in T47D cells was completely abrogated by 2-deoxyglucose (Fig. 3B). Furthermore, lactate production was significantly increased to 206.0% ± 4.6% of controls by 20 μM troglitazone (Fig. 3B). These results indicate that troglitazone-stimulated uptake of 18F-FDG is associated with a shift of metabolism to glycolytic flux. However, it should be recognized that, although 2-deoxyglucose is often referred to as a glycolytic inhibitor, it is a competitive inhibitor of hexokinase that suppresses multiple steps of glucose metabolism rather than specifically blocking the glycolytic pathway. No change in membrane GLUT-1 expression (Fig. 3C) or hexokinase activity (data not shown) was seen with troglitazone.
MAPK and AMPK Pathways Are Involved in Troglitazone-Stimulated 18F-FDG Uptake
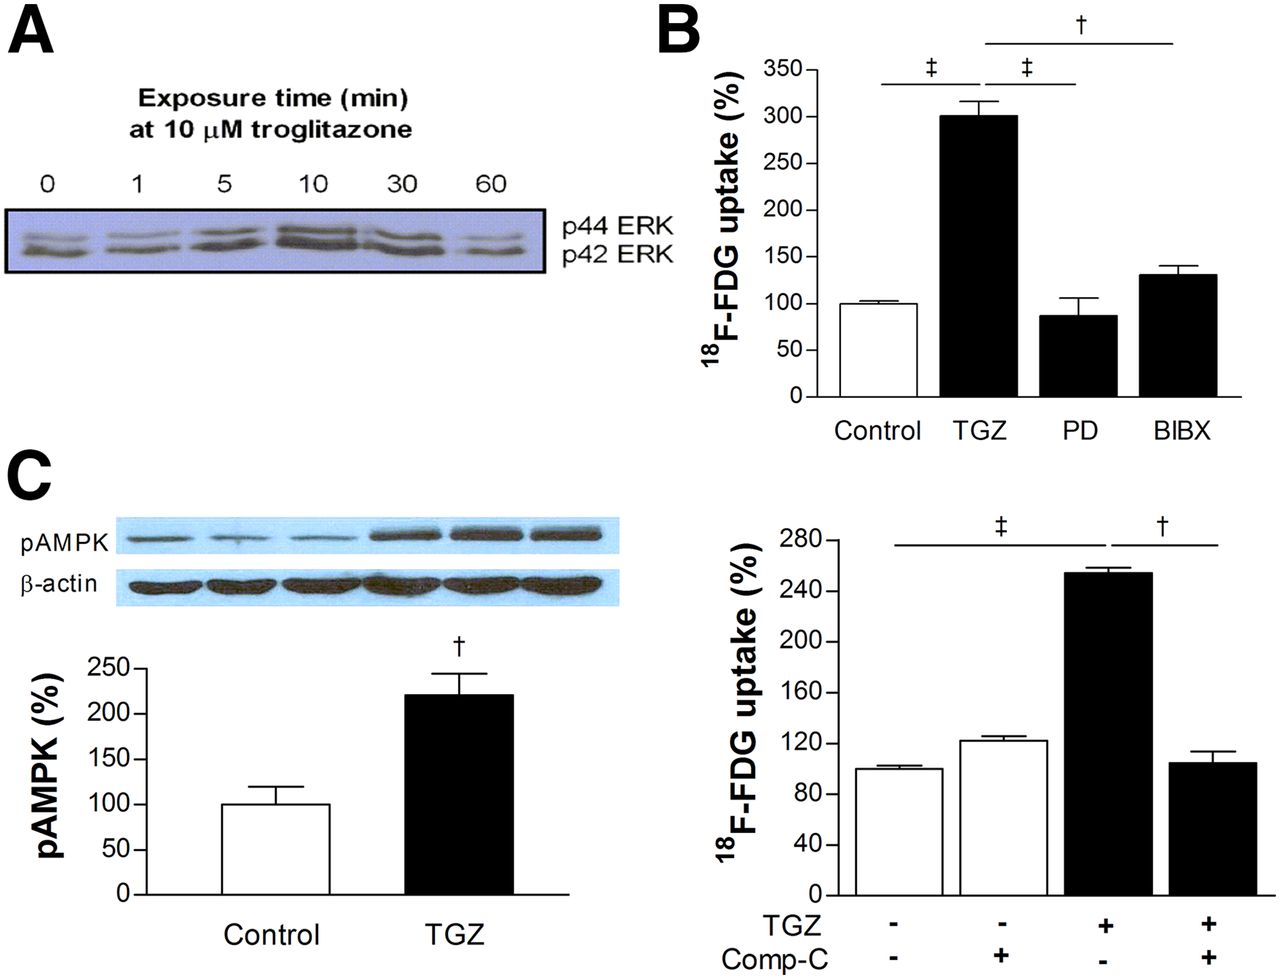
Western blotting of phosphorylated p42 and p44 extracellular signal-regulated kinase (ERK) expression in T47D cells displayed transient activation of the mitogen-activated protein kinase (MAPK) pathway by troglitazone (Fig. 4A). Troglitazone-stimulated uptake of 18F-FDG was abolished by MAPK inhibition with PD98059, as well as by inhibition of epidermal growth factor receptor activation with BIBX-1382 (Fig. 4B). Western blotting also demonstrated increased expression of activated adenosine monophosphate–activated protein kinase (AMPK) to 221.0% ± 23.7% of controls by troglitazone (Fig. 4C). Furthermore, troglitazone-stimulated uptake of 18F-FDG was completely abrogated by AMPK inhibition with compound C (Fig. 4C).

Intracellular signaling pathways involved in troglitazone-stimulated 18F-FDG uptake. (A) Western blotting of phosphorylated p42/p44 extracellular signal-regulated kinase expression in T47D cells displayed transient activation of mitogen-activated protein kinase pathway by troglitazone. (B) Troglitazone-stimulated 18F-FDG uptake was abolished by mitogen-activated protein kinase inhibition with PD98059 or inhibition of epidermal growth factor receptor activation with BIBX-1382. (C) Western blotting showed increased expression of phosphorylated AMPK by troglitazone (left), and abrogation of troglitazone-stimulated 18F-FDG uptake by AMPK inhibition with compound-C (right). Bars are mean ± SD (n = 3) of percent values relative to controls. †P < 0.005. ‡P < 0.001. BIBX = BIBX-1382; comp-C = compound-C; ERK = extracellular signal-regulated kinase; MAPK = mitogen-activated protein kinase; pAMPK = phosphorylated AMP-activated protein kinase; PD = PD98059.
Troglitazone Suppresses Cancer Cell Oxygen Consumption, MMP, and ROS Production
T47D cells displayed a rapid, dose-dependent decline of baseline OCR after troglitazone treatment (Fig. 5A). Whereas control cells showed a marked decrease of OCR by the complex V inhibitor oligomycin that was restored by the proton gradient uncoupler FCCP, troglitazone-treated cells failed to show any response (Fig. 5A). Suppression of OCR by troglitazone was comparable to levels achieved by the inhibition of complex III with antimycin (Fig. 5A), suggesting a similar site of action. HCT116 cells showed similar severely reduced OCR at baseline and in response to oligomycin, FCCP, and antimycin (Fig. 5B).
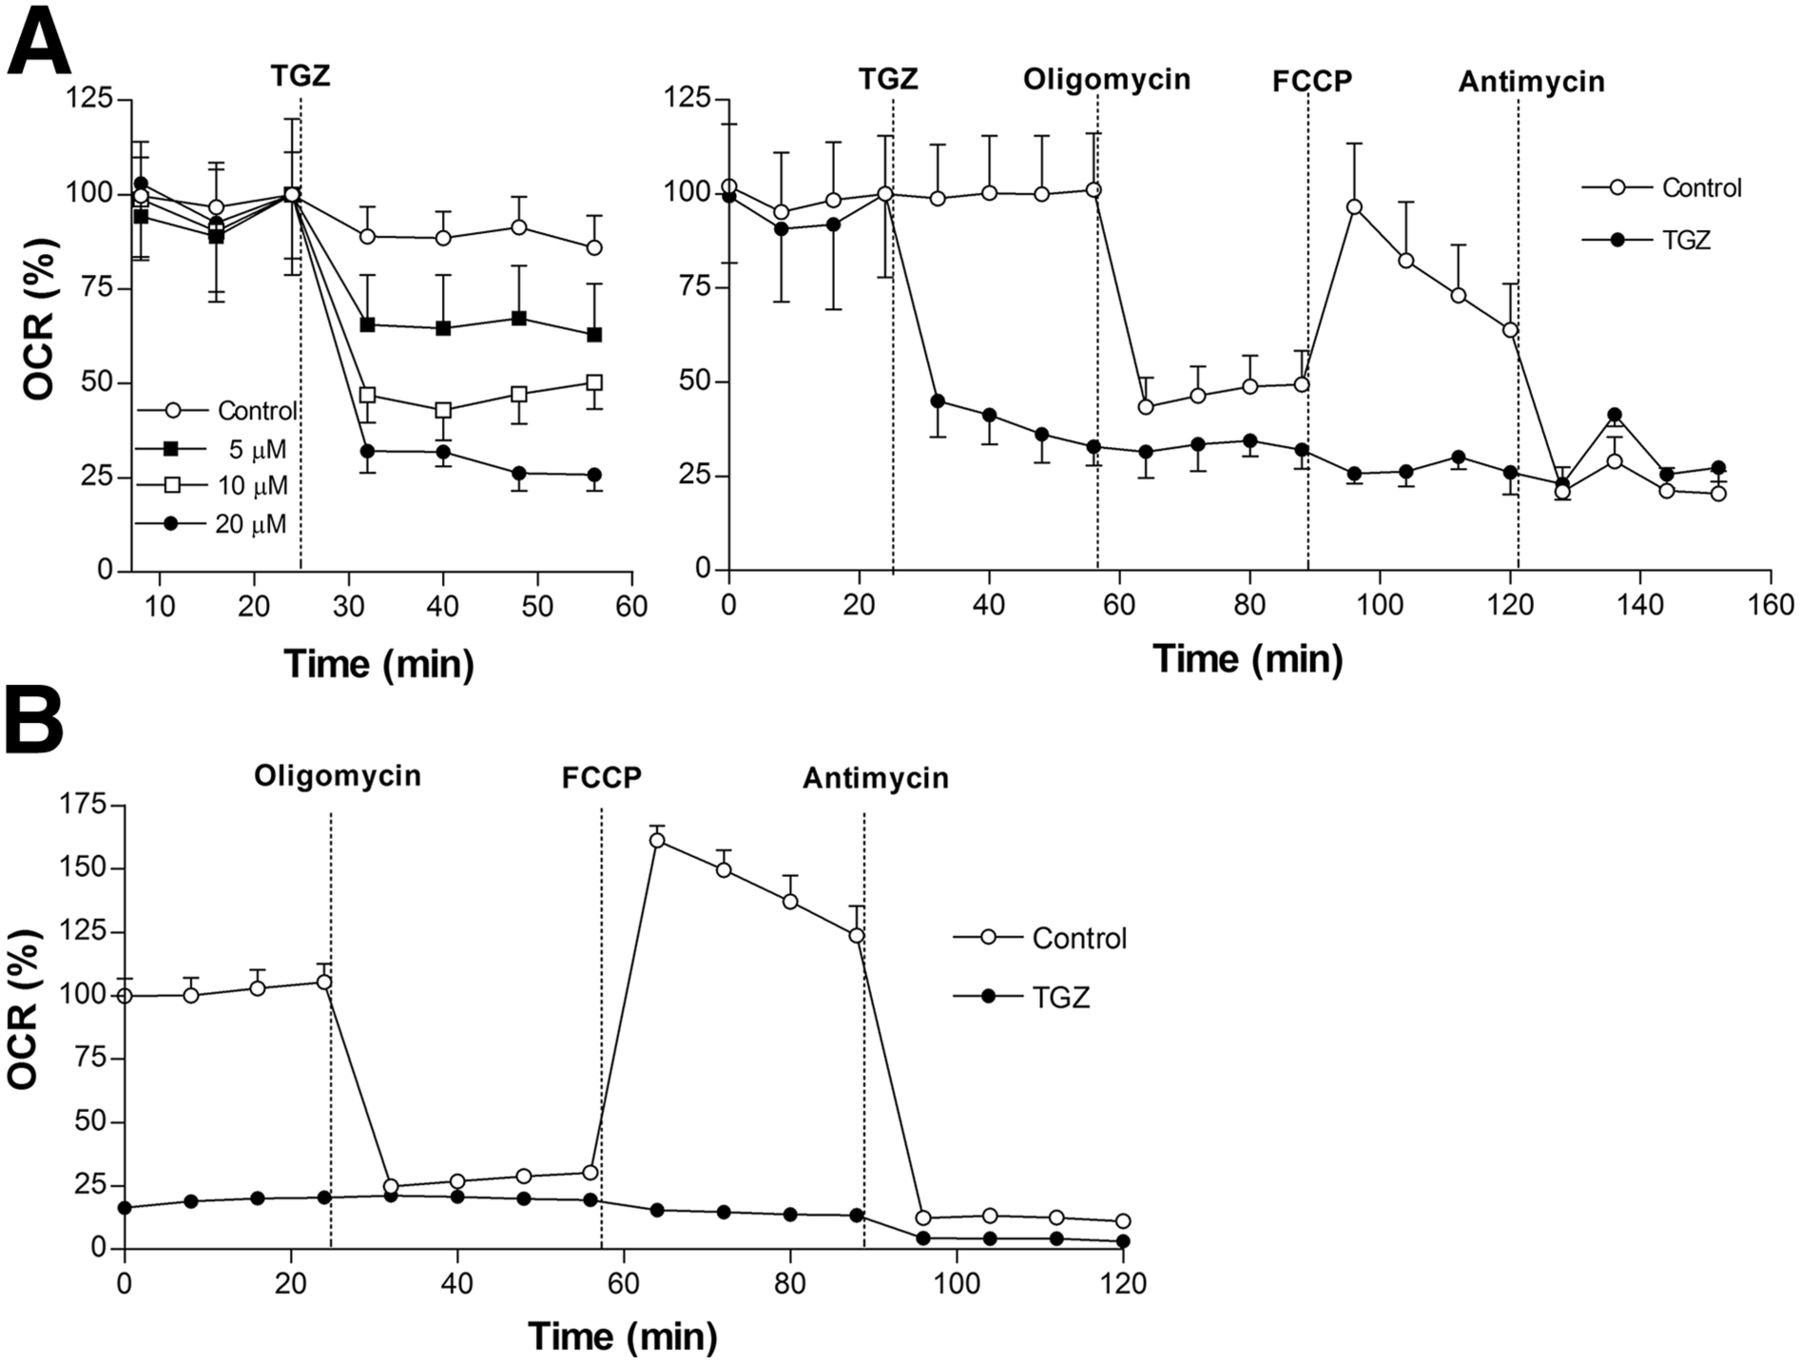
Effect of troglitazone on oxygen consumption rate of cancer cells. (A) Effects of 10 μM troglitazone on oxygen consumption rate of T47D cells at baseline (dose-dependent; left), and in response to F1F0 adenosine triphosphate synthase inhibition (oligomycin; 1 mM), uncoupling (FCCP; 0.3 mM), and electron transport chain blockade (antimycin; 1 mM) (right). (B) Effects of 10 μM troglitazone on oxygen consumption rate of HCT116 cells at baseline and in response to inhibitors as previously shown. Data are mean ± SD (n = 3) of percent oxygen consumption rate relative to zero-time controls. ATP = adenosine triphosphate; OCR = oxygen consumption rate; TGZ = troglitazone.
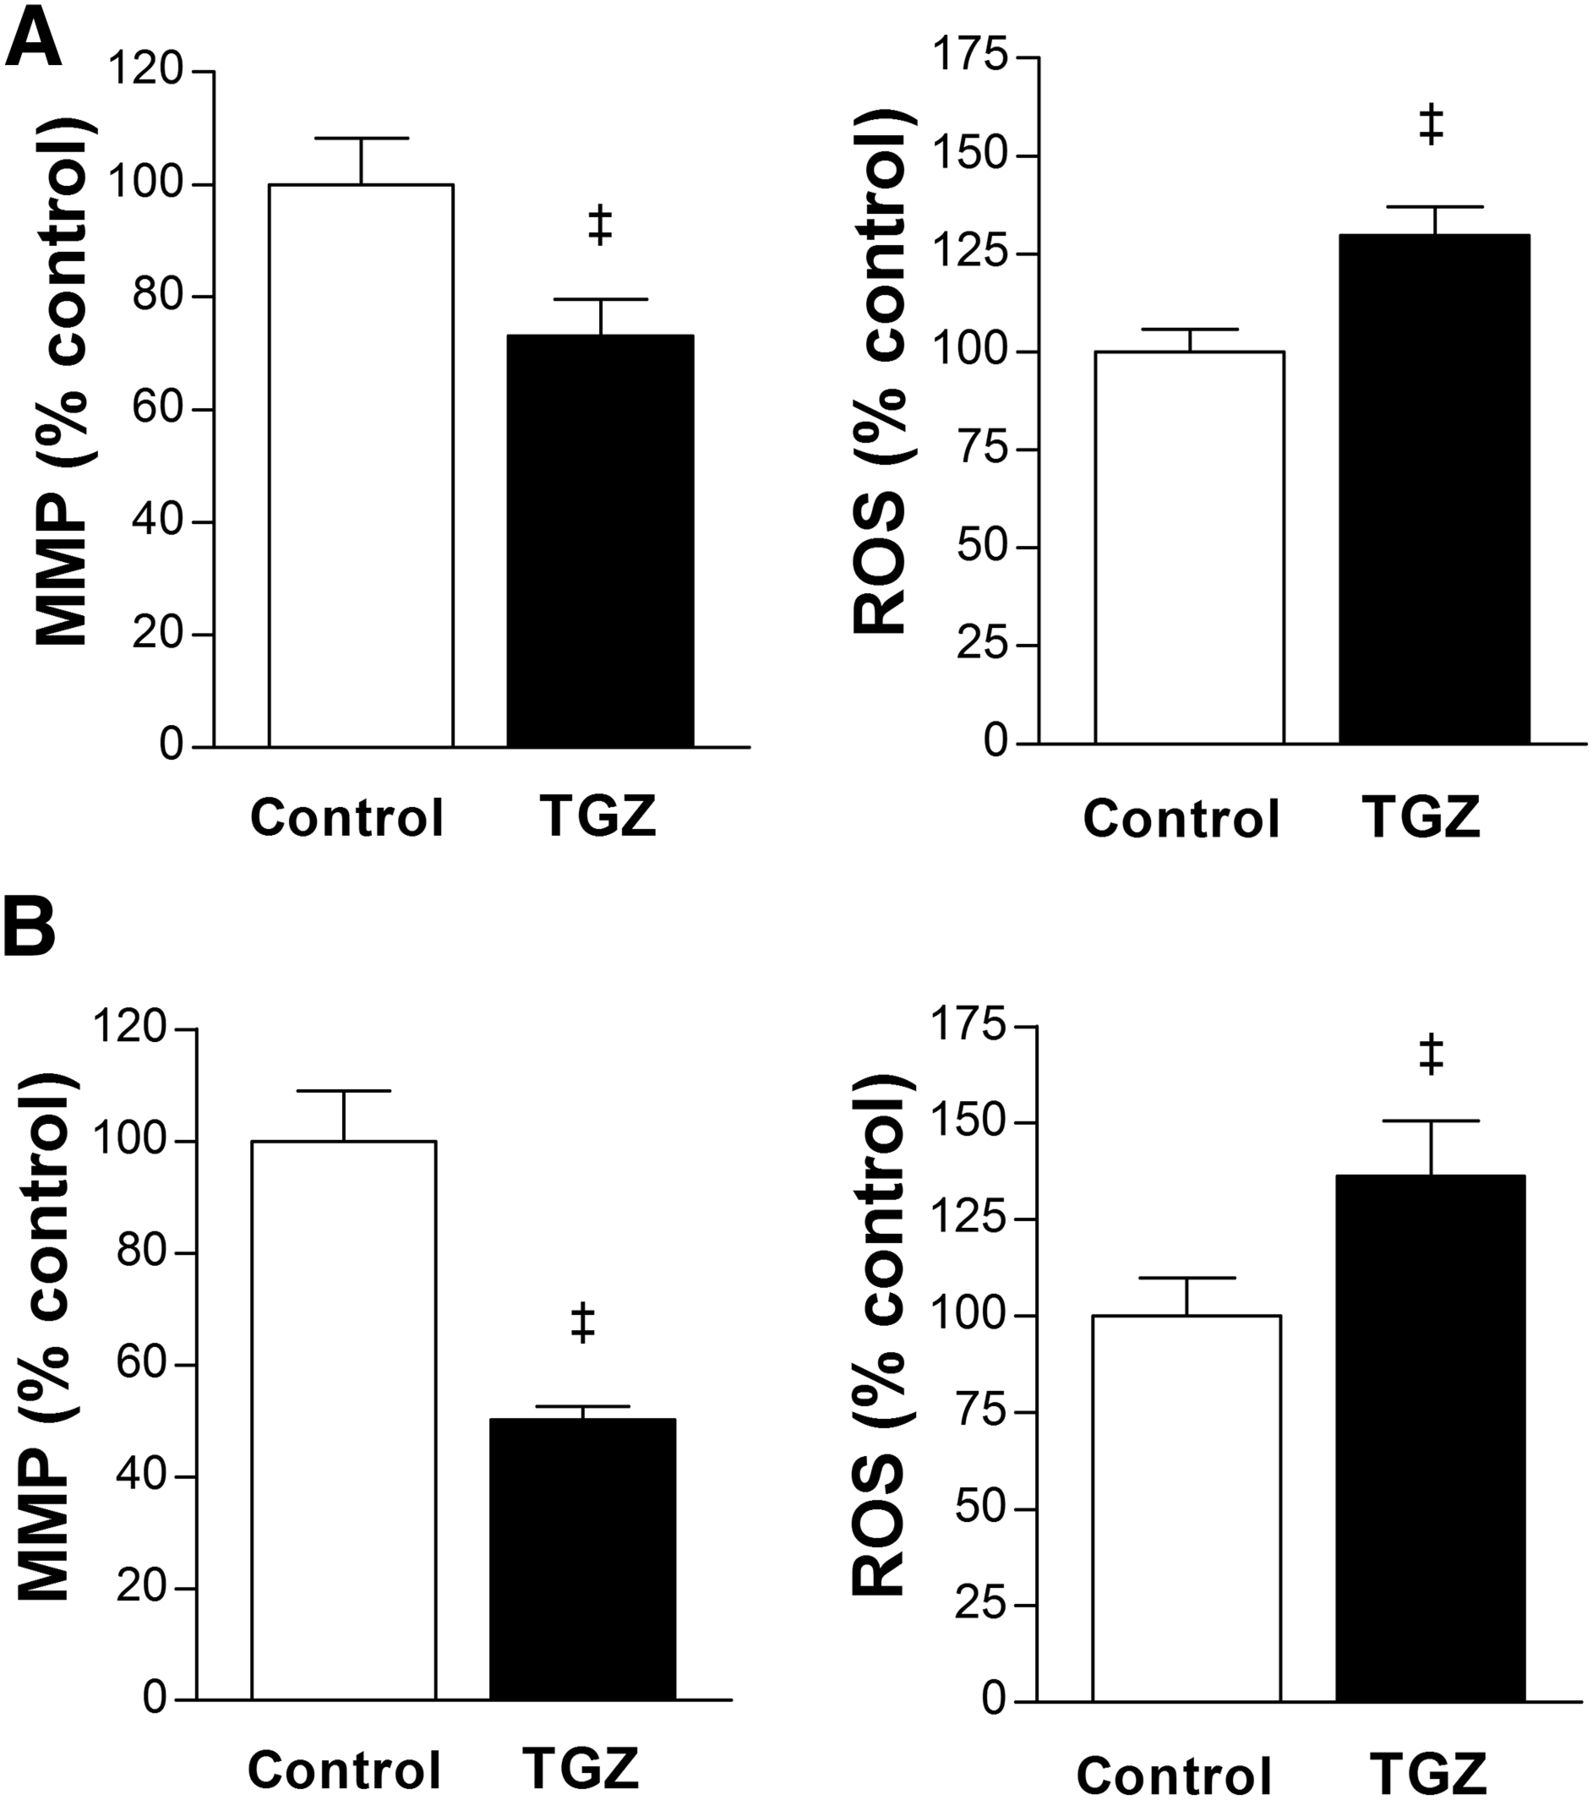
Furthermore, T47D cells treated with 10 μM troglitazone showed an MMP level reduced to 73.2% ± 6.4% of controls, and ROS production increased to 129.7% ± 7.3% of controls (Fig. 6A). HCT116 cells showed a similar pattern of reduced MMP level to 50.1% ± 2.4% of controls and increased ROS production to 136.3% ± 14.3% of controls by 10 μM troglitazone (Fig. 6B).

Troglitazone suppresses MMP and increases ROS. (A and B) Effects of 24-h treatment with 10 μM troglitazone on MMP (left) and ROS production (right) in T47D (A) and HCT116 cells (B). Data are mean ± SD (n = 5) percent values relative to controls. TGZ = troglitazone. ‡P < 0.001.
Anticancer Effect of Troglitazone Is Enhanced by Restriction of Glucose Availability
When T47D cells in culture medium containing a 2.0 g/L concentration of glucose were treated with graded concentrations of troglitazone for 24 h, there were mild reductions in cell number to 92.6% ± 2.2%, 86.9% ± 4.4%, and 79.4% ± 59.4% of untreated cells by 20, 40, and 80 μM troglitazone, respectively (Fig. 7A). This anticancer response was significantly potentiated by restricting glucose availability in the medium. Hence, when glucose concentration was lowered to 1.0 g/L, T47D cell content was reduced to 84.4% ± 4.0%, 78.1% ± 6.2%, and 57.7% ± 10.8% of untreated cells by 20, 40, and 80 μM troglitazone, respectively. A further glucose decrease to 0.5 g/L caused T47D cell content to be reduced to 72.4% ± 10.4%, 60.8% ± 15.3%, and 52.2% ± 10.2% of untreated cells by 20, 40, and 80 μM troglitazone, respectively (Fig. 7A).
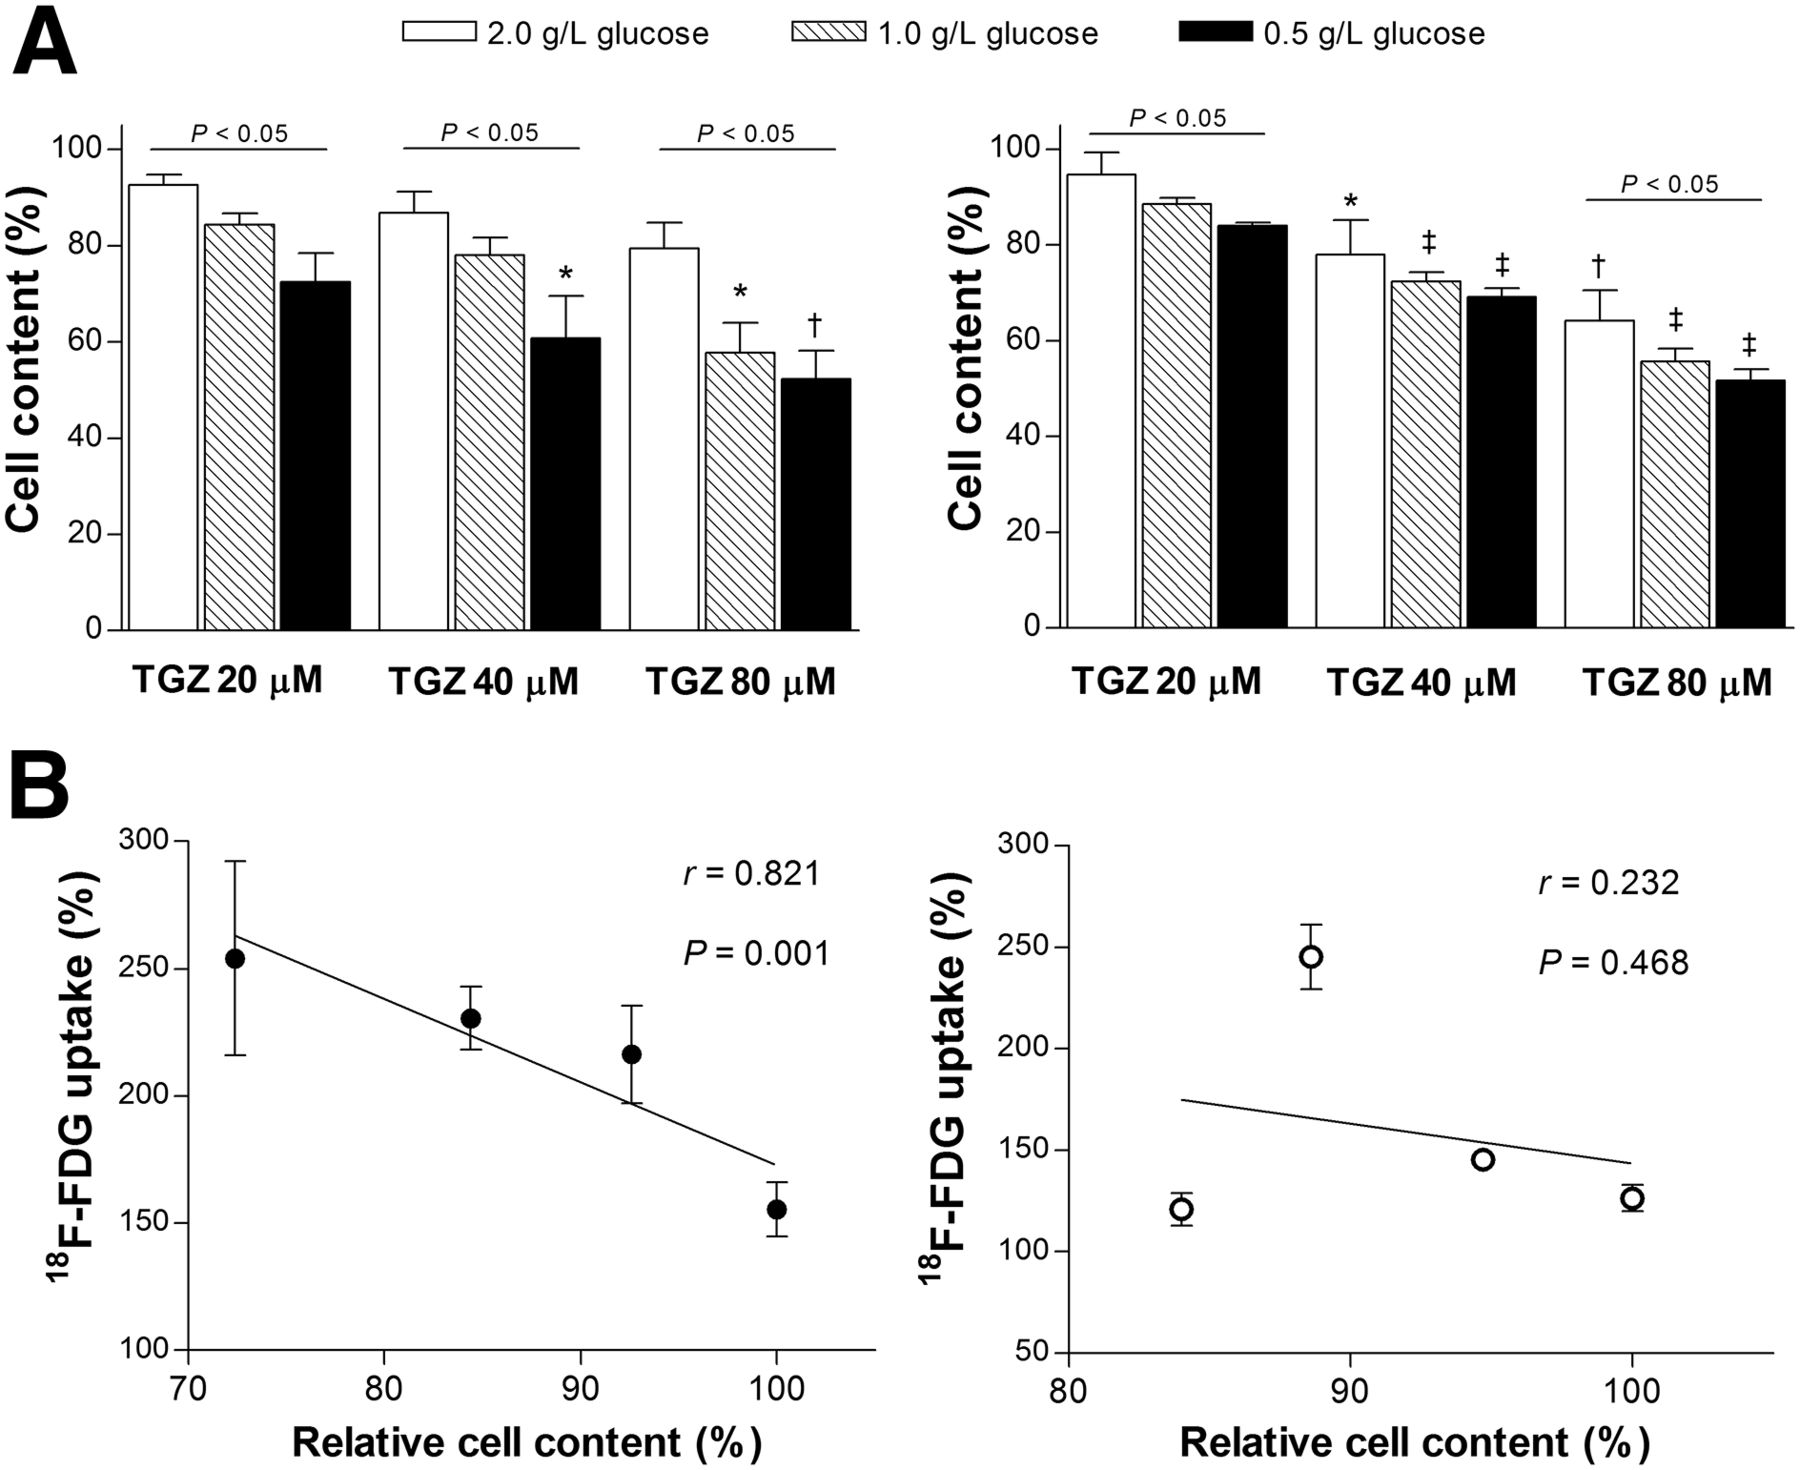
Anticancer effect of troglitazone is potentiated by restricted glucose availability. (A) Influence of glucose concentration in culture medium on troglitazone-induced reduction of viable T47D (left) and HCT116 cells (right). *P < 0.05; †P < 0.005; ‡P < 0.001, compared with untreated control cells in medium containing 2 g of glucose per liter. (B) Linear regression analysis shows divergent relation between relative cell content and relative 18F-FDG uptake in T47D (left) and HCT116 cells (right) treated with 20 μM troglitazone in medium containing graded glucose concentrations. All data are mean ± SD (n = 3) percent values relative to controls. TGZ = troglitazone.
HCT116 cells displayed a similar pattern of dose-dependent cell reduction by troglitazone that was potentiated by restricted glucose availability. Hence, cell content that was reduced to 94.7% ± 4.6%, 78.0% ± 7.2%, and 64.2% ± 6.3% of controls by 20, 40, and 80 μM troglitazone in a 2.0 g/L concentration of glucose was further reduced to 83.9% ± 1.2%, 69.2% ± 3.1%, and 51.0% ± 4.1% of controls in a 0.5 g/L concentration of glucose (Fig. 7A).
HCT116 cells displayed a similar pattern of dose-dependent cell reduction by troglitazone that was potentiated by restricted glucose availability. Hence, cell content that was reduced to 94.7% ± 4.6%, 78.0% ± 7.2%, and 64.2% ± 6.3% of controls by 20, 40, and 80 μM troglitazone in a 2.0 g/L concentration of glucose was further reduced to 83.9% ± 1.2%, 69.2% ± 3.1%, and 51.0% ± 4.1% of controls in a 0.5 g/L concentration of glucose (Fig. 7A).
We then evaluated how treatment with troglitazone in graded glucose concentrations influenced the level of 18F-FDG uptake. A troglitazone concentration of 20 μM was selected because mild cytotoxicity at this dose was not likely to cause losses of membrane integrity that could directly affect tracer uptake. As a result, T47D cells revealed a close inverse linear relation between 18F-FDG uptake (relative to that of untreated cells in the same glucose concentration) and viable cell content (r = 0.821, P = 0.001; Fig. 7B). Because cell content decreased with graded increases of troglitazone dose, the regression line slope would have been even steeper if 18F-FDG uptake had been corrected for cell content per well. In contrast to T47D cells, HCT116 cells displayed a completely divergent pattern in which no such relation could be found (r = 0.232; Fig. 7B).
DISCUSSION
This study shows that troglitazone stimulates 18F-FDG uptake in T47D breast cancer cells in a manner that is rapid, dose-dependent, and associated with a metabolic shift to glycolytic flux.
Unlike classic thiazolidinedione actions, several lines of evidence indicated that this metabolic effect occurred independently of PPARγ. The onset of effect was too rapid for gene transcription; the more potent PPARγ activator rosiglitazone (19) showed much weaker stimulation of 18F-FDG uptake; and the irreversible PPARγ antagonist GW9662 completely failed to suppress the response. Although measuring changes in downstream mediators of PPARγ would have provided further support, these findings provide strong evidence for PPARγ independence, similar to recent reports for thiazolidinedione-mediated antitumor actions (5,6,20).
Emerging evidence points to the ability of troglitazone to directly and indirectly influence mitochondrial function (6–9). Increased lactate production in our study points to a glycolytic shift of metabolism that may reflect an effort to maintain sufficient energy for function and survival in the face of reduced mitochondrial function. This scheme is consistent with the notion of the mitochondria as a potential target for PPARγ-independent troglitazone actions (6). We therefore investigated the effect of troglitazone on mitochondrial oxidative respiration and found immediate and severe reductions of OCR. Suppression of OCR by troglitazone was more complete than that by adenosine triphosphate synthase inhibition with oligomycin and comparable to that by electron transport complex II inhibition with antimycin. In addition, the mitochondrial uncoupling protonophore, FCCP, completely failed to increase OCR in troglitazone-treated cells. These findings implicate acute blocking of electron transfer along the respiratory chain as a possible mechanism underlying the metabolic effect of troglitazone.
The influence of troglitazone on mitochondrial function includes disruption of MMP, as has been observed in hepatocyte-derived cancer cells within an hour at concentrations considered therapeutically active (8,21). This observation may indicate a contribution of suppressed oxidative metabolism to the hepatotoxic effect of troglitazone. Collapse of the MMP by troglitazone was also observed in nonliver cells (9,22,23). Our study showed that troglitazone causes a significant reduction of MMP in T47D and HCT116 cancer cells. This process was accompanied by increases of intracellular ROS, which is similar to the findings of a previous study in rat hepatoma cells (21). The mitochondrial respiratory chain is the main source of ROS production in most cells. Efficient electron flow through the electron transport chain diminishes the opportunity for ROS production, whereas there is a greater possibility for one-electron reductions of oxygen and increased ROS formation when electrons are flowing inefficiently (24,25). Therefore, increased ROS production by troglitazone in our study is likely caused by inefficient mitochondrial respiration.
From a mechanistic perspective, our study shows that troglitazone is a strong inhibitor of pyruvate-driven oxidative respiration. When the flow of intermediary metabolic substrates through the mitochondria is impeded, it is inevitably redirected down the glycolytic pathway by cytosolic substrate accumulation with a possible contribution by glycolytic enzyme activation. Because of the lower energy efficiency of glycolytic metabolism, this process should cause a relative depletion of intracellular glucose, which is replenished by instilling more glucose into the cell. This final effect emerged in our study as increased 18F-FDG uptake. Membrane GLUT-1, responsible for glucose uptake in most cancer cells, including T47D cells (26), and hexokinase activity remained unchanged, but this was sufficient to support an increase of 18F-FDG uptake by troglitazone.
In addition, our results show that AMPK and MAPK have major inputs in troglitazone-stimulated uptake of 18F-FDG. AMPK is activated by reduced oxidative metabolism via an increase in the AMP/adenosine triphosphate ratio. Previously, troglitazone-induced glucose phosphorylation in muscle cells was shown to be mediated by AMPK activity (27). This process was proposed to involve relief of inhibition at the hexokinase level, although the precise mechanism was not revealed. MAPK is activated by cellular stress, and a previous study observed activation of the pathway during troglitazone-induced growth arrest of breast cancer cells (28). Furthermore, a recent study showed that downstream effectors of MAPK can stimulate glycolysis by activation of the 6-phosphofructo-2-kinase enzyme (29). Although ERK activation was short-lived compared with stimulation of 18F-FDG uptake in our study, activation of upstream signaling such as MAPK is often transient, even though it induces significantly longer biologic effects. This happens because the biologic responses are actually mediated by a myriad of signaling cascades downstream of MAPK. Indeed, epidermal growth factor–induced differentiation of pheochromocytoma cells (30) and troglitazone-induced antiproliferative effect in colon cancer cells (31) were previously shown to occur by transient ERK activation that lasted only tens of minutes. Nonetheless, further investigation will be required to clarify the roles of AMPK and MAPK in troglitazone-stimulated glycolysis of cancer cells. Although some of the findings we have discussed were previously reported, mostly in nonmalignant cells such as myocytes, our study demonstrates how these effects occur in cancer cells to stimulate glycolysis and uptake of 18F-FDG in response to troglitazone.
Although the present study used cultured cancer cells to investigate the mechanism underlying the metabolic effect of troglitazone, a previous study showed that rosiglitazone, which in our study stimulated 18F-FDG uptake less than did troglitazone, significantly increased uptake of 18F-FDG in lung cancer cell xenografts of living mice (14). This fact indicates that troglitazone is also likely to increase tumor uptake of 18F-FDG in vivo, although this will require verification by further studies.
Cancer cells have a heightened dependence on glucose for proliferation and survival (32), and there is increasing interest in this characteristic as a potential therapeutic target (33). Troglitazone has been viewed as exerting antitumor effects by acting as an agent mimicking glucose starvation (20). Because of our results indicating that glycolysis stimulated by troglitazone is likely a compensatory response, we reasoned that combined suppression of glycolysis may enhance the anticancer action of the drug. In the study of Friday et al. (9), withdrawal of glucose from the medium attenuated the ability of troglitazone to stimulate lactate release in breast cancer cells. Furthermore, Gottfried et al. (15) demonstrated that pioglitazone-mediated suppression of prostate cancer cell proliferation was enhanced by the combined inhibition of hexokinase activity with 2-deoxyglucose.
We thus tested the effect of restricting glucose availability to fuel glycolytic flux. The results showed a clear potentiation of the ability of troglitazone to reduce T47D breast cancer and HCT116 colon cancer cell content by reducing glucose availability. However, when the relation between cell content and relative 18F-FDG uptake after low-dose troglitazone treatment was evaluated, we found a close inverse linear relationship for T47D cells but not for HCT116 cells. HCT116 cells express a wild type of PPARγ and have been shown to undergo apoptosis by troglitazone (34). The divergent relation between 18F-FDG uptake and anticancer effect observed in these cells, as well as the time course of stimulated 18F-FDG uptake, suggests that the metabolic response to troglitazone may be cancer cell type–dependent, although we did not attempt to elucidate the detailed mechanistic differences in this study.
Because all cells share the same machinery for energy production, strategies to target glucose metabolism for cancer therapy can raise safety concerns. Restricting glucose availability as an adjunct treatment could be feasible with energy-restricting mimetic agents (35) or calorie-restricted ketogenic diets (36). Furthermore, the successful use of antifolate drugs illustrates that targeting of cellular metabolism can be achieved through therapeutic windows without serious toxicities. More rapid proliferation of cancer cells than of normal cells could provide such a window, although this is not necessarily true for rapidly proliferating gut epithelium and bone marrow. Additional therapeutic windows could exist from metabolic differences between cells types, including redundant metabolic pathways present in normal cells but not in cancer cells (17). Still, it should be emphasized that the safe use of mitochondria-targeting drugs such as troglitazone will rely on a full understanding of their mechanism of action and on recognizing settings in which the benefits of their use will outweigh any potential side effects.
CONCLUSION
Troglitazone stimulates cancer cell uptake of 18F-FDG through a PPARγ-independent shift of metabolism toward glycolytic flux, which appears to occur as an adaptive response to impaired mitochondrial oxidative respiration. Our findings on how troglitazone modulates tumor handling of 18F-FDG may offer opportunities to potentiate the anticancer effects of metabolism-targeting drugs and may help expand the role of PET imaging for monitoring treatment response in cancer patients.
DISCLOSURE
The costs of publication of this article were defrayed in part by the payment of page charges. Therefore, and solely to indicate this fact, this article is hereby marked “advertisement” in accordance with 18 USC section 1734. This work was supported by the Basic Science Research Program through the National Research Foundation of Korea funded by the Ministry of Education, Science, and Technology (MEST) (2012R1A1A2041354). No other potential conflict of interest relevant to this article was reported.
Footnotes
↵* Contributed equally to this work.
Published online Oct. 8, 2015.
- © 2016 by the Society of Nuclear Medicine and Molecular Imaging, Inc.
REFERENCES
- Received for publication June 8, 2015.
- Accepted for publication September 23, 2015.


Jump to section
Related Articles
Cited By...
- No citing articles found.