


Abstract
PET imaging of rodents is increasingly used in preclinical research, but its utility is limited by spatial resolution and signal-to-noise ratio of the images. A recently developed preclinical PET system uses a clustered-pinhole collimator, enabling high-resolution, simultaneous imaging of PET and SPECT tracers. Pinhole collimation strongly departs from traditional electronic collimation achieved via coincidence detection in PET. We investigated the potential of such a design by direct comparison to a traditional PET scanner. Methods: Two small-animal PET scanners, 1 with electronic collimation and 1 with physical collimation using clustered pinholes, were used to acquire data from Jaszczak (hot rod) and uniform phantoms. Mouse brain imaging using 18F-FDG PET was performed on each system and compared with quantitative ex vivo autoradiography as a gold standard. Bone imaging using 18F-NaF allowed comparison of imaging in the mouse body. Images were visually and quantitatively compared using measures of contrast and noise. Results: Pinhole PET resolved the smallest rods (diameter, 0.85 mm) in the Jaszczak phantom, whereas the coincidence system resolved 1.1-mm-diameter rods. Contrast-to-noise ratios were better for pinhole PET when imaging small rods (<1.1 mm) for a wide range of activity levels, but this reversed for larger rods. Image uniformity on the coincidence system (<3%) was superior to that on the pinhole system (5%). The high 18F-FDG uptake in the striatum of the mouse brain was fully resolved using the pinhole system, with contrast to nearby regions equaling that from autoradiography; a lower contrast was found using the coincidence PET system. For short-duration images (low-count), the coincidence system was superior. Conclusion: In the cases for which small regions need to be resolved in scans with reasonably high activity or reasonably long scan times, a first-generation clustered-pinhole system can provide image quality in terms of resolution, contrast, and the contrast-to-noise ratio superior to a traditional PET system.
Small-animal PET is an increasingly important tool in biomedical research. A recent development in scanner technology has been the introduction of a focused, clustered-pinhole collimator that enables simultaneous high-spatial-resolution PET and SPECT imaging. Physical collimation of the 511-keV photons produced by positron-electron annihilation, using clustered pinholes, is a substantial change in scanner design as compared with electronic collimation via coincidence detection. Clustered pinholes can offer improved spatial resolution (1) in rodent images, despite a low fraction of single 511-keV photons being detected as compared with the fraction of detected photon pairs in traditional PET. Such scanners are likely suited to different applications. The commonly encountered sensitivity-resolution trade-off has been investigated previously: it has been known for several decades that an improvement in image quality can be achieved via a gain in spatial resolution, even if this gain necessitates a drop in sensitivity (2).
This work directly compares the PET capabilities of the VECTor small-animal scanner (MILabs B.V.) (1,3) with the microPET Focus120 (Concorde Microsystems Inc.) (4,5). Although VECTor can perform less than 0.5-mm SPECT imaging and less than 0.75-mm PET imaging simultaneously (1), we considered the PET mode only. VECTor uses clustered pinholes for physical collimation. The Focus120 is a traditional scanner using the coincidence technique. Our comparison used phantom and point-source studies to assess the spatial resolution, uniformity, image noise, and sensitivity. We then compared PET data from in vivo 18F-FDG PET mouse brain imaging, using quantitative ex vivo autoradiography to provide a high-resolution reference image. 18F-NaF PET imaging was also performed to demonstrate the capabilities for imaging the body. The approach for systematic comparison was partly inspired by National Electrical Manufacturers Association (NEMA) guidelines (6), but we did not follow these guidelines because systems with physical collimation are beyond their current scope and the NEMA phantom is physically too large for VECTor with the mouse collimator tested here.
MATERIALS AND METHODS
Experiments involving mice were done in accordance with guidelines of the Canadian Council on Animal Care and approved by a University of British Columbia ethics committee.
Scanner Descriptions
The microPET Focus120 is a coincidence PET system containing lutetium orthosilicate block detectors (4,5). The field of view (FOV) is 7.6 cm axially and 10 cm transaxially. The manufacturer’s software was used for acquisition and reconstruction (release 2.4). The coincidence timing window was 6 ns and the energy window 350–750 keV.
VECTor is a simultaneous SPECT–PET system containing 3 stationary flat-panel NaI(Tl) detectors, 9.5 mm thick (1,3). It is a 511-keV–prepared U-SPECT-II (7) combined with dedicated reconstruction software and shielding. A clustered-pinhole collimator designed for high-energy photons is used, with no need for coincidence detection. The manufacturer’s software was used for acquisition (version 3.4f) and reconstruction (β version, VECTor+). List-mode acquisitions used the scanning focus method (8) with helical bed motions (9) to move the animal through the hourglass-shaped FOV, which encompasses the entire bore (diameter, 4.8 cm) and has an average length of 3.6 cm. For a mouse brain, 19 bed positions were used. The energy window was centered on the photopeak, with a width of 102 keV.
Data Processing and Image Reconstruction
For the Focus120, data were rebinned using a span of 3, maximum ring difference of 47, and reconstructed with a zoom of 4 for voxels of 0.2 × 0.2 × 0.8 mm. Standard corrections for randoms, scatter, attenuation, and normalization were applied. The assessment included the 3 following different methods of reconstruction commonly used for this instrument: Fourier rebinning followed by 2-dimensional filtered backprojection (FORE + 2DFBP), 3-dimensional maximum a posteriori (3DMAP) reconstruction with the uniform resolution setting (1.5 mm), and 3DMAP with the resolution set to 0 mm. For the 3DMAP reconstructions, 2 ordered-subset expectation maximization iterations and 20 MAP iterations were used with fast map (10,11). Setting the resolution to 0 mm forces the hyperparameter of the Gibbs prior (β) to zero, eliminating the regularization term. This term varies for 1.5-mm-resolution 3DMAP and is hence provided alongside each result.
For VECTor, list-mode data were histogrammed and corrected for scatter using the triple-energy method (12), with background windows of 100 and 28 keV adjacent to the photopeak. Attenuation correction was not applied, because it is not included in the standard software and not required for mouse brain PET for which attenuation of 511-keV photons in single mode is insignificant. The system matrix used for reconstruction (forward- and backprojection) was calculated with a raytracer method that included penetration of the 511-keV photons through the collimator material but neglected scattering. Varying depth of interaction in the continuous NaI(Tl) detector was also included, modeled using Beer’s law. In contrast, positron range was included only in the forward-projector (13). Reconstruction was to cubic voxels of 0.4-mm length. Thirty iterations (32 subsets) of pixel-based ordered-subset expectation maximization (14) were performed for the Jaszczak phantom and mouse bone scans. Fifteen iterations (32 subsets) were performed for all other scans, as determined from prior investigation. A postreconstruction filter (3D gaussian) was applied. The width of the kernel depended on the count level, with the full width at half maximum (FWHM) varying from 0 to 1.5 mm (as specified) to optimize visual image quality.
Sensitivity, Energy Resolution, and Uniformity
The sensitivity, or number of collected counts (or coincidences) per disintegration, is a useful metric for comparing scanners of a similar type. It is less useful when comparing systems with different spatial resolutions and modes of photon acquisition. Knowledge of the sensitivity may, however, be useful in future investigations using computer simulations or for comparison of one of these scanners with another scanner of similar design.
The absolute single-photon sensitivity for VECTor and coincidence sensitivity of the Focus120 were measured using a 2.4-mm-long liquid 18F source within a capillary tube (inner diameter, 1.5 mm). The initial activity was 2.4 MBq. The same source was measured in both scanners at many positions along the main axis. The percentage absolute sensitivity equals 100 times the number of counts per unit time (above background) divided by the positron emissions per unit time. The peak sensitivity was the absolute sensitivity at the center of the FOV. The average sensitivity along the central 13 mm of the scanner’s axis was also calculated, to approximate a mouse brain.
Energy resolution was measured as the percentage FWHM of the 511-keV photopeak. Spectra were obtained from an 18F point source for VECTor and 68Ge line source for the Focus120 using coincidence measurements (15).
Image uniformity was measured from high-count images. Three milliliters of 18F in water, in a 12-mL syringe of 16 mm in diameter, were imaged for 30 min. The initial activity was 307 MBq for the VECTor and 22 MBq for the Focus120, which provided almost noise-free projection data in each case, with counting rates low enough to avoid performance losses from pulse pile-up. The image from the VECTor was smoothed using a 3D gaussian filter of 1.2 mm in FWHM to compare uniformity at matching resolutions.
Thirty circular regions of interest (ROIs), each of 2.7 mm3, were placed on the images. ROIs were defined by repeating 6 well-separated ROIs at 5 axial locations (evenly spaced at 2.4-mm intervals). The percentage uniformity was quantified as: Eq. 1where
  represents the average value from the 30 ROIs, and
  is the SD between the 30 ROI means.
Spatial Resolution and Noise Measurement
An 80-mm-long Jaszczak phantom, containing 6 sets of fillable rods, was designed and manufactured. Rod diameters were 0.85, 0.95, 1.10, 1.30, 1.50, and 1.70 mm. The distance between rod centers was twice the rod diameter. The phantom was filled with 18F in water, and data were acquired for 18.3 h on each scanner. The initial activity was 60 MBq (∼170 MBq/mL). Twenty sequential 55-min time frames were reconstructed. A limitation of the phantom is the absence of a warm background.
The images were resampled to a fine grid, and circular ROIs were then placed on and between the rods using an automated method to optimize placement. ROIs had a diameter of 0.9 times the diameter of the rods and were repeated on 9 planes for an axial thickness of 4.5 mm. Letting d be an index of the rod diameter (running from 1 to 6), we define the contrast Cd as: Eq. 2where
  is the mean value of
  across all planes p and rods r, with
  being the ROI mean extracted from an ROI placed on top of rod r in plane p within the set of rods with diameter index d. Likewise,
  represents the mean value of
  , which is the value from an ROI placed in between the rods. The method for measuring and defining contrast using a Jaszczak phantom is not standard but was designed to quantify the resolvability of small hot regions, which is an important task in small-animal imaging. Rods with a contrast greater than 0.2 were visually well resolved.
A measure of variability between ROI mean values was calculated as: Eq. 3where
  and
and  represent the SD of
  and
and  , respectively, calculated over all positions r and 3 of the 9 planes p, given by the subset {1,4,9} to reduce inter-ROI covariance. The denominator
  represents the mean value from all ROIs (h and b) with common d. In low-count conditions, the measure captures statistical uncertainty on the ROI means. The contrast-to-noise ratio was defined as
  .
.
18F-FDG Mouse Brain Imaging
18F-FDG PET scans of healthy mice were obtained. The treatment of the mice before and during the scan was similar, in terms of isoflurane anesthesia, fasting (2 h before scan), and provision of external heating. The injected activity (intraperitoneal) was 68 MBq for the mouse imaged using VECTor and 67 MBq for the Focus120. Immediately after injection, a 90-min scan was obtained, and mice were then sacrificed by injection of sodium pentobarbital. Brains were rapidly extracted, frozen, sliced (18-μm slices), and used for quantitative ex vivo autoradiography. Standards of 8 different activity concentrations were placed alongside brain sections on a phosphor screen. After 2-h exposure, the screen was read using a high-resolution phosphor imager (cyclone storage phosphor system; Packard Bioscience Co.).
PET images for 30–90 min after injection were reconstructed after initial reconstructions confirmed constant tracer distribution over this period. Rectangular ROIs (area, 0.5 mm2; thickness, 0.2 mm) were placed on the striata (left and right), septal nucleus between the striata, and cortex dorsal to the striata. Similar ROIs were positioned on autoradiography slices using the manufacturer’s software (OptiQuant; Packard Instruments Co.). These ROIs had equal area and positioning, but the effective slice thickness (after averaging 3 slices) was 0.054 mm. Standardized uptake values (SUVs, units of g/cm3), equal to the ROI mean activity concentration divided by the injected activity per unit body weight, were calculated. Contrasts between striatum and cortex and striatum and septal nucleus were found as the difference in SUV divided by the SUV in the striatum.
Emulation of Shorter Scans/Lower Activity
To assess the impact of the number of acquired counts on image quality, data acquired during the 18F-FDG PET scan were reprocessed, and only a fraction of the counts were reconstructed. The 60-min-duration image (30–90 min) was compared with 30-min (48–78 min) and 6-min (60–66 min) images. The short-duration images are reasonably representative of a 60-min-duration image with injected activity reduced from 68 to 34 and 6.8 MBq, respectively.
Image noise was quantified as the percentage SD between 7 ROIs located throughout the brain, termed noise index 1. The ROIs were circular, 1 mm2 in area and 0.2 mm thick. They were placed in brain regions of similar SUVs and separated by at least 2.5 mm. For high-count images, noise index 1 is dependent on the heterogeneous tracer uptake between ROIs. For lower-count images, the measure becomes sensitive to statistical uncertainty on ROI means. A second measure, termed noise index 2, was calculated using 6 × 1-min images (each reconstruction using one sixth of the data collected between 60 and 66 min). The percentage SD for each ROI mean value from the 6 independent replicates was calculated, giving a measure that is insensitive to nonuniformities or heterogeneous uptake.
18F-NaF Bone Imaging in Mice
The imaging capabilities of the 2 scanners for nonbrain applications were compared by performing example 18F-NaF bone scans in mice, with the aim of visualizing the pelvic bones and lower spine. For the Focus120, this part of the animal was positioned at the center of the scanner’s FOV. For VECTor, a small volume of interest (14 × 13 mm in plane and 19 mm axially) was manually defined for this application with the aid of a planar CT image, thus boosting the effective sensitivity of VECTor, because the target region is within the scanner’s FOV for a greater amount of time.
The mouse scanned with VECTor received 85 MBq, and the mouse scanned on the Focus120 received 74 MBq. After a 1-h uptake period, emission data were collected for 30 min; images were visually compared.
RESULTS
Phantom Measurements
The peak sensitivity of VECTor was 10 times lower than the Focus120, with absolute peak sensitivities of 0.37% and 3.97%, respectively. When averaged over the central 13 mm (on axis), sensitivities reduced to 0.28% and 3.71%, respectively. Energy resolutions were 9.0% (VECTor) and 20% (Focus120, in coincidence mode). Images of 18F in a syringe were highly uniform for both systems, as shown in Table 1 and in Supplemental Figure 1 (supplemental materials are available at http://jnm.snmjournals.org).
Uniformity Measured Using High-Count Scan of Syringe
Images of the Jaszczak phantom are displayed in Figure 1. Three of the 20 time frames (each of 55-min duration) were selected for analysis, corresponding to high-, medium-, and low-activity acquisitions. The images qualitatively demonstrate the main differences between the systems. VECTor offers higher resolution, but to maintain a reasonable visual image quality in the low-count image, postreconstruction smoothing with a larger kernel was applied.

Images of Jaszczak phantom with rod diameters of 0.85, 0.95, 1.10, 1.30, 1.50, and 1.70 mm. (A) Results for VECTor. (B) Results for Focus120 using 3DMAP (β = 0), for 55-min-duration frames. Single 4.5-mm-thick plane is shown, created by summing planes. Starting activity in phantom is shown for each column. Postreconstruction smoothing (3D gaussian) was applied to 3.8- and 0.12-MBq images from VECTor; FWHM of filter was 0.3 and 1.2 mm, respectively. Images are on linear gray scale, with black equal to maximum intensity in image.
For the 2 highest activity levels, VECTor resolved the smallest rods (diameter, 0.85 mm), whereas for the lowest activity level the rods of 1.3 mm in diameter were resolved. For the Focus120, the 1.1-mm rods were resolved using 3DMAP with a β of 0 at all activities and 3DMAP with β of 0.174 at high activities. The 1.3-mm rods were always resolved using the Focus120. Profiles through the 1.1-mm rods for the 60-MBq acquisitions are shown in Figure 2, in which a difference in spatial resolution is evident.
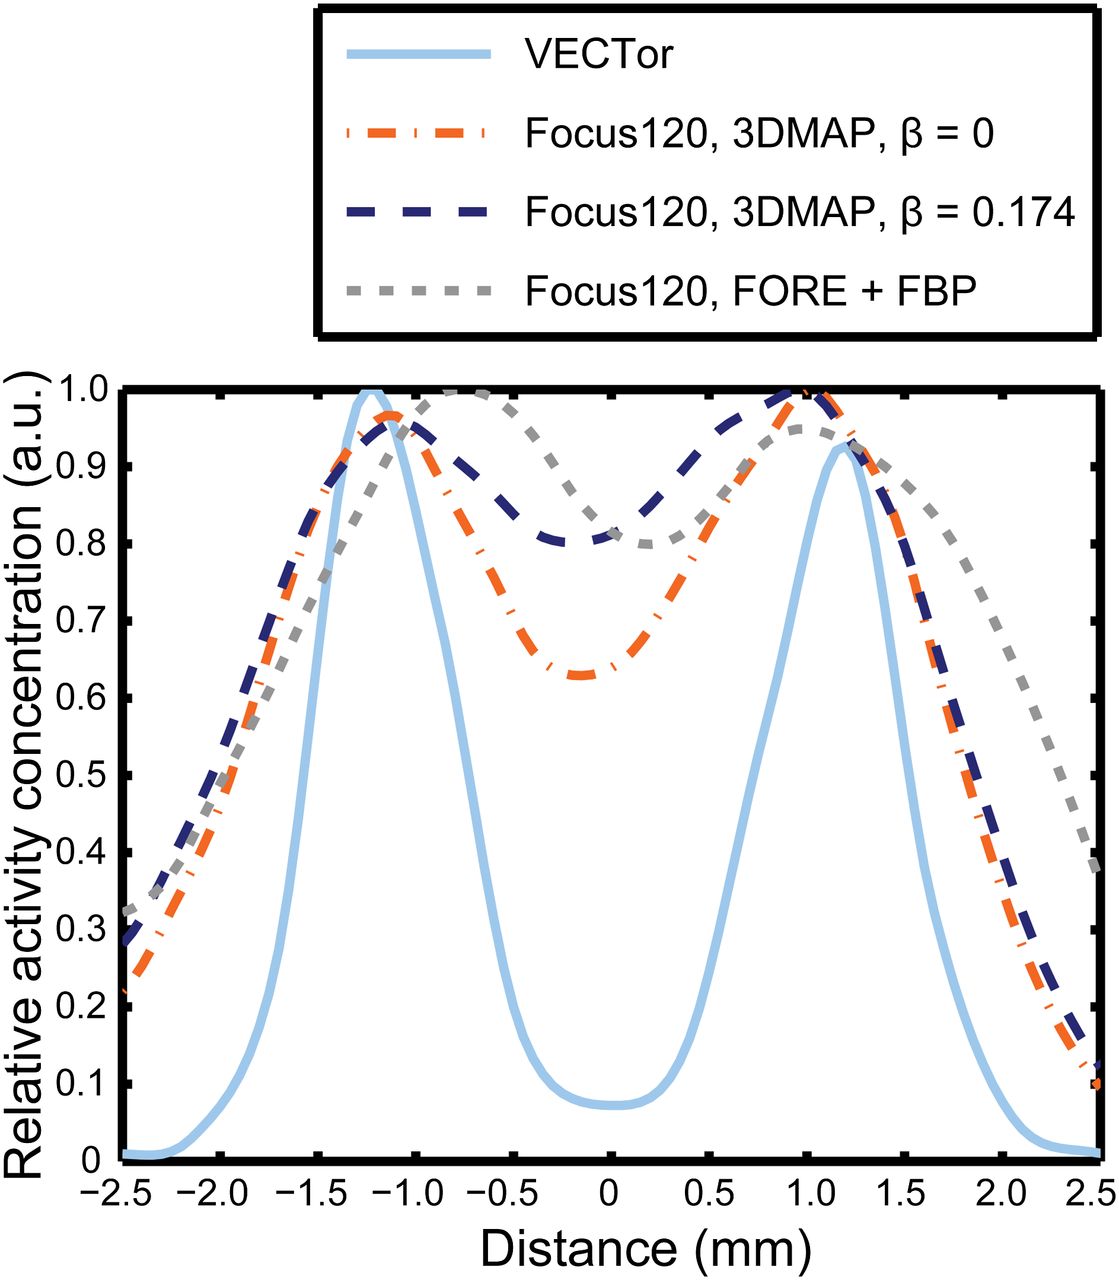
Profiles through 1.1-mm-diameter rods in first frame (60 MBq, 55-min duration). No postreconstruction smoothing was applied.
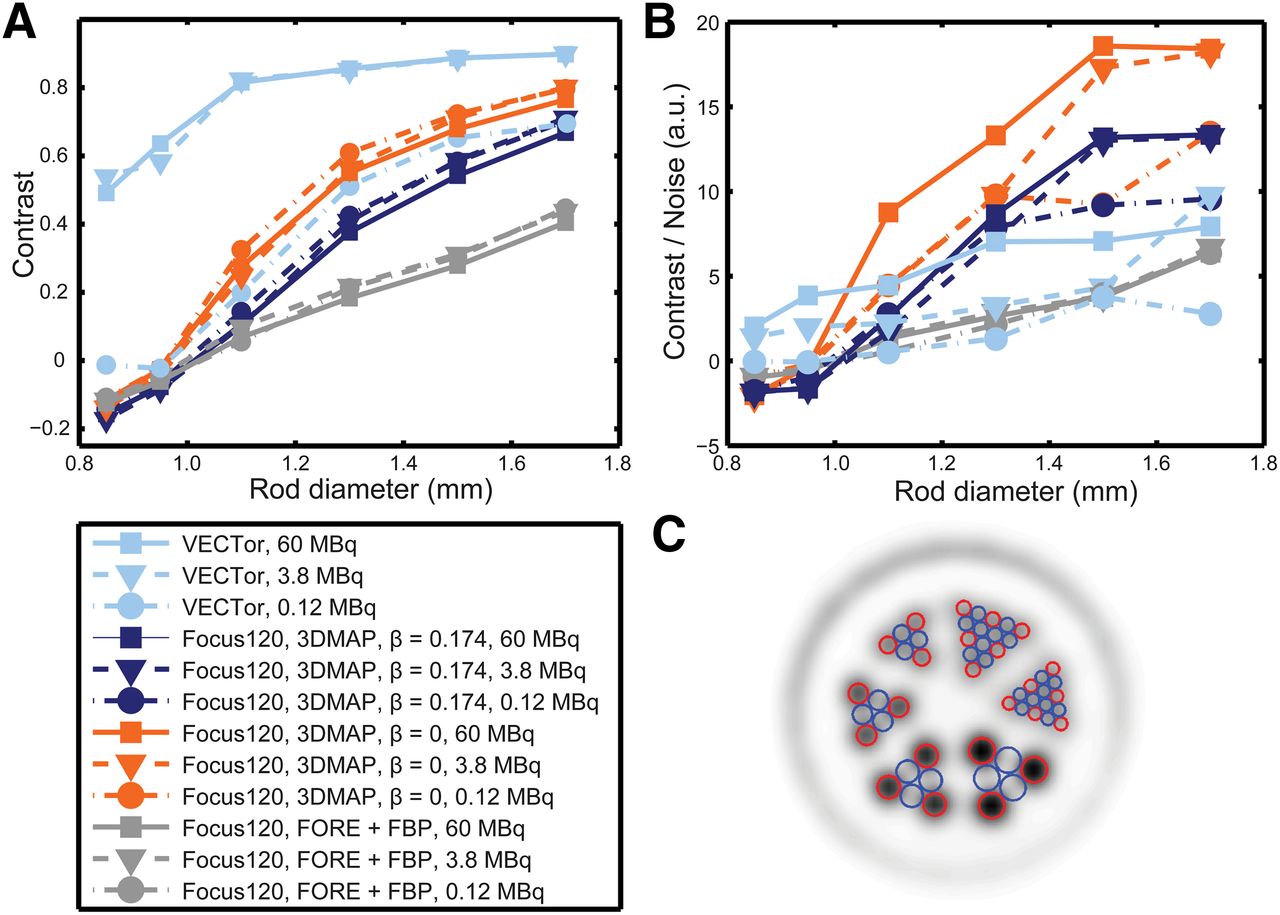
The contrast, contrast-to-noise ratios, and ROI definition are displayed in Figure 3. The data demonstrate that high contrast (Fig. 3A) was maintained in the smallest-diameter rods (0.85 mm) using VECTor, for the high- and medium-activity levels (60 and 3.8 MBq). For these rods, activity in the cold ROI exceeded that in the hot ROI for the Focus120, giving negative contrast. At high and medium activities, VECTor had higher contrast than the Focus120 for all rods. At low activity (0.12 MBq), the smoothed image from VECTor had contrast similar to the Focus120 with 3DMAP (β = 0). Contrast had relatively little dependence on activity for the Focus120, with a minor reduction at high activity likely due to pile-up effects (16).

Contrast (A) and contrast-to-noise ratios (B). Data are shown for 3 different activity levels for each rod diameter. (C) Example region definition with blue circles representing cold areas and red circles representing hot areas.
Contrast-to-noise ratios, displayed in Figure 3B, were higher for VECTor than the Focus120 for the smallest 2 rod diameters (for 60 and 3.8 MBq). For the largest 4 rod diameters (≥1.1 mm), the Focus120 using 3DMAP reconstruction provided the superior contrast-to-noise ratio. The noise metric had little dependence on the rod diameter and was always highest for the lower of the 3 activities investigated. Noise was higher for VECTor (16% at 60 MBq, 33% at 0.12 MBq) than for the Focus120, with the lowest noise found in the 3DMAP (β = 0.174) images (5% at 60 MBq, 7% at 0.12 MBq).
Mouse Imaging
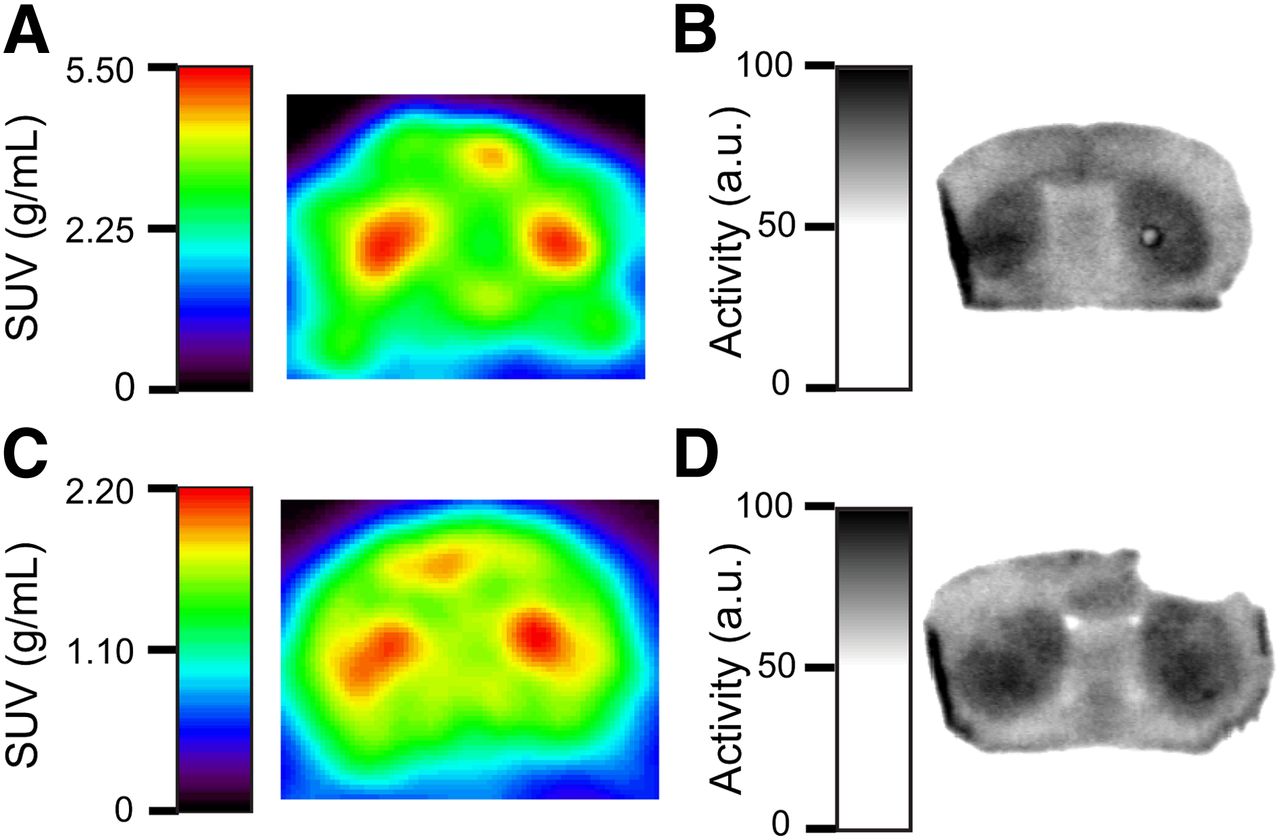
Images from 18F-FDG mouse brain PET and ex vivo autoradiography are shown in Figure 4, with contrasts quantified in Table 2. For small ROIs located at the center of the striata, contrast between the striata and surrounding brain regions for VECTor was similar to that from autoradiography, whereas for the Focus120 contrast was reduced. Images from VECTor have distorted boundaries, likely due to a combination of sampling differences across the FOV and limitations in the system modeling and object sampling currently used.

(A) 18F-FDG image (30−90 min after injection) acquired on VECTor (0.8-mm smoothing applied). (B) Ex vivo autoradiography of mouse brain, for mouse scanned with VECTor. (C) 18F-FDG image (30−90 min after injection) acquired on Focus120, reconstructed using 3DMAP (β = 0). (D) Ex vivo autoradiography of mouse brain, for mouse scanned on Focus120. Displayed PET images are 0.2-mm-thick slices.
Contrast and SUVs from 18F-FDG Measurements of Mouse Brain: Comparison Between PET and Autoradiography
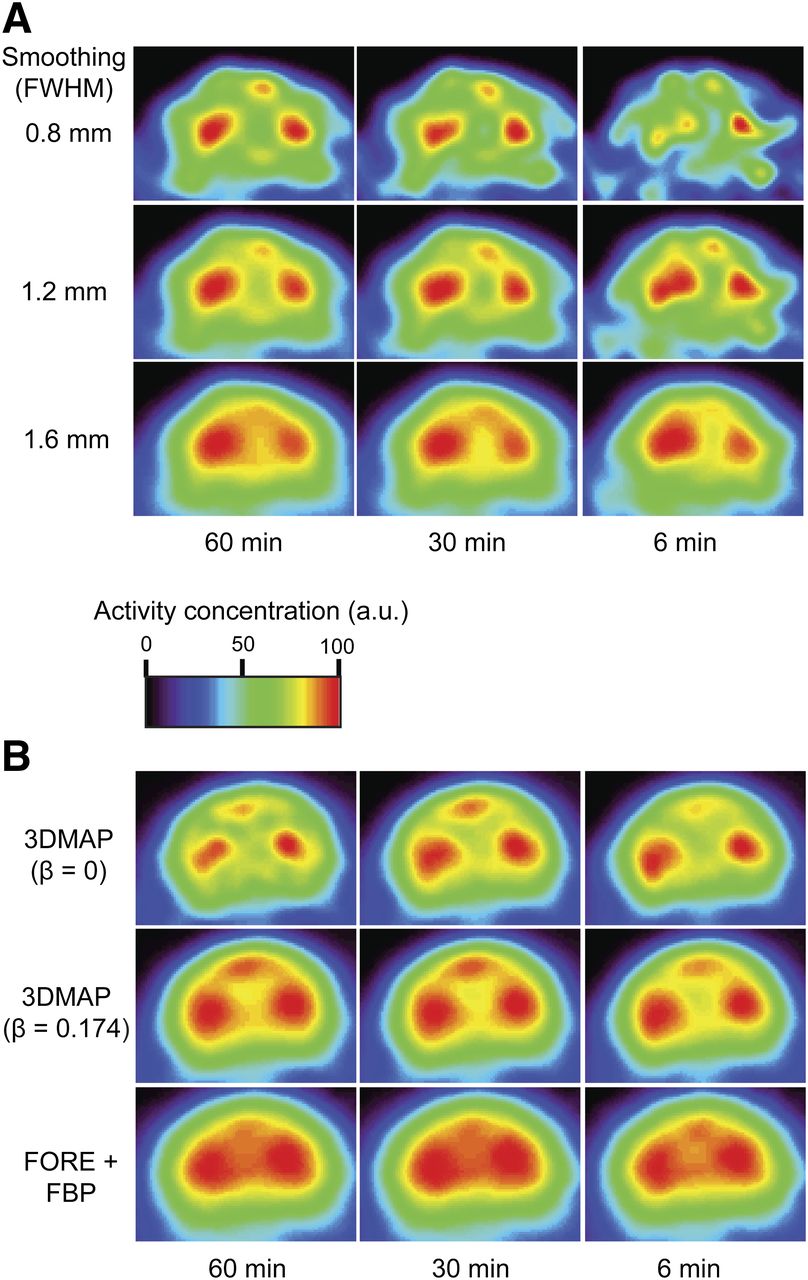
The effect that reducing the acquisition duration has on image quality is presented visually in Figure 5. 18F-FDG mouse brain images from VECTor were reduced in quality as image duration reduced, whereas the Focus120 retained more consistent image quality. This effect was quantified by the increases in noise index 1, shown in Table 3. Noise index 2 (calculated for 1-min-duration replicates) was in agreement with the results from noise index 1 for VECTor. This implies that for the 1-min-duration images from VECTor, statistical variations outweighed any heterogeneity in the tracer distribution. This differed for the Focus120, for which noise index 2 was lower than noise index 1; values were 5.9 ± 0.5, 3.0 ± 0.4, and 2.4 ± 0.6 for 3DMAP (β = 0), 3DMAP (β = 0.147), and FBP, respectively, implying that heterogeneous tracer uptake comprised a portion of noise index 1. The number of counts for the 60-min image was 36 M (includes ∼16% scatter, no randoms) for the VECTor, and 1,675 M for the Focus120 (includes 10% scatter and 22% randoms).

18F-FDG images for 60-, 30-, and 6-min-duration frames. (A) Data from VECTor with postreconstruction smoothing using a 3D gaussian filter of 0.8, 1.2, and 1.6 mm in FWHM. (B) Data from Focus120 using 3DMAP (β = 0), 3DMAP (β = 0.147), and FORE + FBP. All images were separately scaled to maximum value in displayed 0.2-mm-thick slice, which passes through striatum. a.u. = arbitrary units.
Measurements of Noise Index 1 from 18F-FDG Mouse Brain Scans
Results from 18F-NaF bone imaging are presented as maximum-intensity projections in Figure 6, with rotating maximum-intensity projections as supplemental material. Similar to previous results, the image from VECTor is of visibly higher spatial resolution.

18F-NaF bone imaging in pelvis and lower spine of mice. Images are maximum-intensity projections from subregion of image excluding bladder. Images are individually scaled using linear gray scale. See supplemental material for rotating images as video files.
DISCUSSION
We compared the PET performance of 2 small-animal scanners, one a first-generation simultaneous SPECT–PET system (VECTor) using clustered pinholes and the other a coincidence PET system (Focus120). In high-count situations, VECTor provided greater contrast between small regions, translating into a superior contrast-to-noise ratio for small objects (e.g., hot rods of <1.1-mm diameter) but poorer contrast to noise for larger objects as compared with the Focus120. When small structures such as the striatum of a mouse are to be studied, the higher spatial resolution offered by VECTor can offset its lower sensitivity, which was directly seen in high-count images of a mouse brain and a bone scan. For quantification of larger regions that are well-resolved, the higher sensitivity of the coincidence PET scanner provided images with higher contrast-to-noise ratio.
The applications for which pinhole PET can be superior, as compared with traditional PET, include those in which structures of 1.2 mm3 or less are to be studied, when the number of acquired counts can be high. The collection of a high number of counts is achieved by injecting a relatively high activity, imaging for a longer duration, or both. For 18F-FDG imaging using a common SUV-type analysis, acquisition for 30–60 min is realistic. In some cases, injection of a high dose could be problematic. It depends on the ability to produce concentrated tracer, raises the potential for a mass effect (e.g., in receptor studies) (17), and may bring confounds from the absorbed dose received by the mouse (18,19). The applications for which clustered-pinhole PET is superior to coincidence PET are limited but include commonly performed 18F-FDG imaging. Additionally, pinhole PET provides unique capabilities such as the ability to perform simultaneous SPECT and PET.
Improvements to the system model for VECTor, beyond those recently made (13), are expected to further increase the spatial resolution and uniformity. Additionally, improvements in hardware and acquisition protocols could improve sensitivity by an order of magnitude: novel collimators that double the sensitivity are being constructed; thicker NaI(Tl) crystals are being tested, which more than double the detection efficiency. Mouse positioning may be further optimized in the future using a new mouse bed for more highly focused (and hence sensitive) imaging of the brain or its substructures. Developments in coincidence PET have also taken place since the manufacture of the Focus120, but performance gains have been modest and spatial resolution remains inferior to VECTor (20).
CONCLUSION
Preclinical PET can be performed at high spatial resolution using VECTor, a combined SPECT–PET system that uses a clustered-pinhole collimator and does not use the coincidence technique. In several situations for which a small ROI was imaged with sufficient activity, VECTor provided images with higher resolution, contrast, and contrast-to-noise ratios as compared with a traditional coincidence system. Images from VECTor had some distortions in the cortex, and for data acquired at low activity levels or for short scan times the small-animal PET scanner provided more consistent image quality.
DISCLOSURE
The costs of publication of this article were defrayed in part by the payment of page charges. Therefore, and solely to indicate this fact, this article is hereby marked “advertisement” in accordance with 18 USC section 1734. Research was supported by the Canadian Institutes of Health Research, Pieken in de Delta grant PID06015, the Canadian Foundation for Innovation, the BC Knowledge Development Fund, and the Natural Sciences and Engineering Research Council of Canada. Freek Beekman, Ruud Ramakers, and Frans van der Have are employees of MI Labs. No other potential conflict of interest relevant to this article was reported.
Acknowledgments
We thank the staff at TRIUMF for radiotracer production and acknowledge the assistance of the UBC PET group and MILabs staff.
Footnotes
Published online Jun. 5, 2014.
- © 2014 by the Society of Nuclear Medicine and Molecular Imaging, Inc.
REFERENCES
- Received for publication December 20, 2013.
- Accepted for publication April 21, 2014.


