
Main menu

  • Home
  • Content
    • Current
    • Ahead of print
    • Past Issues
    • JNM Supplement
    • SNMMI Annual Meeting Abstracts
    • Continuing Education
    • JNM Podcasts
  • Subscriptions
    • Subscribers
    • Institutional and Non-member
    • Rates
    • Journal Claims
    • Corporate & Special Sales
  • Authors
    • Submit to JNM
    • Information for Authors
    • Assignment of Copyright
    • AQARA requirements
  • Info
    • Reviewers
    • Permissions
    • Advertisers
  • About
    • About Us
    • Editorial Board
    • Contact Information
  • More
    • Alerts
    • Feedback
    • Help
    • SNMMI Journals
  • SNMMI
    • JNM
    • JNMT
    • SNMMI Journals
    • SNMMI

User menu

  • Subscribe
  • My alerts
  • Log in
  • My Cart

Search

  • Advanced search
Journal of Nuclear Medicine
  • SNMMI
    • JNM
    • JNMT
    • SNMMI Journals
    • SNMMI
  • Subscribe
  • My alerts
  • Log in
  • My Cart
Journal of Nuclear Medicine

Advanced Search

  • Home
  • Content
    • Current
    • Ahead of print
    • Past Issues
    • JNM Supplement
    • SNMMI Annual Meeting Abstracts
    • Continuing Education
    • JNM Podcasts
  • Subscriptions
    • Subscribers
    • Institutional and Non-member
    • Rates
    • Journal Claims
    • Corporate & Special Sales
  • Authors
    • Submit to JNM
    • Information for Authors
    • Assignment of Copyright
    • AQARA requirements
  • Info
    • Reviewers
    • Permissions
    • Advertisers
  • About
    • About Us
    • Editorial Board
    • Contact Information
  • More
    • Alerts
    • Feedback
    • Help
    • SNMMI Journals
  • View or Listen to JNM Podcast
  • Visit JNM on Facebook
  • Join JNM on LinkedIn
  • Follow JNM on Twitter
  • Subscribe to our RSS feeds
Research ArticleBRIEF COMMUNICATION
Open Access

Validation of a Simplified Tissue-to-Reference Ratio Measurement Using SUVR to Assess Synaptic Density Alterations in Alzheimer Disease with [11C]UCB-J PET

Juan J. Young, Ryan S. O’Dell, Mika Naganawa, Takuya Toyonaga, Ming-Kai Chen, Nabeel B. Nabulsi, Yiyun Huang, Emma Cooper, Alyssa Miller, Jessica Lam, Kara Bates, Audrey Ruan, Kimberly Nelsen, Elaheh Salardini, Richard E. Carson, Christopher H. van Dyck and Adam P. Mecca
Journal of Nuclear Medicine November 2024, 65 (11) 1782-1785; DOI: https://doi.org/10.2967/jnumed.124.267419
Juan J. Young
1Alzheimer’s Disease Research Unit, Yale School of Medicine, New Haven, Connecticut;
2Department of Psychiatry, Yale School of Medicine, New Haven, Connecticut;
3VA Connecticut Healthcare System, West Haven, Connecticut;
  • Find this author on Google Scholar
  • Find this author on PubMed
  • Search for this author on this site
Ryan S. O’Dell
1Alzheimer’s Disease Research Unit, Yale School of Medicine, New Haven, Connecticut;
2Department of Psychiatry, Yale School of Medicine, New Haven, Connecticut;
  • Find this author on Google Scholar
  • Find this author on PubMed
  • Search for this author on this site
Mika Naganawa
4Department of Radiology and Biomedical Imaging, Yale School of Medicine, New Haven, Connecticut;
  • Find this author on Google Scholar
  • Find this author on PubMed
  • Search for this author on this site
Takuya Toyonaga
4Department of Radiology and Biomedical Imaging, Yale School of Medicine, New Haven, Connecticut;
  • Find this author on Google Scholar
  • Find this author on PubMed
  • Search for this author on this site
Ming-Kai Chen
4Department of Radiology and Biomedical Imaging, Yale School of Medicine, New Haven, Connecticut;
  • Find this author on Google Scholar
  • Find this author on PubMed
  • Search for this author on this site
Nabeel B. Nabulsi
4Department of Radiology and Biomedical Imaging, Yale School of Medicine, New Haven, Connecticut;
  • Find this author on Google Scholar
  • Find this author on PubMed
  • Search for this author on this site
Yiyun Huang
4Department of Radiology and Biomedical Imaging, Yale School of Medicine, New Haven, Connecticut;
  • Find this author on Google Scholar
  • Find this author on PubMed
  • Search for this author on this site
Emma Cooper
1Alzheimer’s Disease Research Unit, Yale School of Medicine, New Haven, Connecticut;
2Department of Psychiatry, Yale School of Medicine, New Haven, Connecticut;
  • Find this author on Google Scholar
  • Find this author on PubMed
  • Search for this author on this site
Alyssa Miller
1Alzheimer’s Disease Research Unit, Yale School of Medicine, New Haven, Connecticut;
2Department of Psychiatry, Yale School of Medicine, New Haven, Connecticut;
  • Find this author on Google Scholar
  • Find this author on PubMed
  • Search for this author on this site
Jessica Lam
1Alzheimer’s Disease Research Unit, Yale School of Medicine, New Haven, Connecticut;
  • Find this author on Google Scholar
  • Find this author on PubMed
  • Search for this author on this site
Kara Bates
1Alzheimer’s Disease Research Unit, Yale School of Medicine, New Haven, Connecticut;
  • Find this author on Google Scholar
  • Find this author on PubMed
  • Search for this author on this site
Audrey Ruan
1Alzheimer’s Disease Research Unit, Yale School of Medicine, New Haven, Connecticut;
2Department of Psychiatry, Yale School of Medicine, New Haven, Connecticut;
  • Find this author on Google Scholar
  • Find this author on PubMed
  • Search for this author on this site
Kimberly Nelsen
1Alzheimer’s Disease Research Unit, Yale School of Medicine, New Haven, Connecticut;
2Department of Psychiatry, Yale School of Medicine, New Haven, Connecticut;
  • Find this author on Google Scholar
  • Find this author on PubMed
  • Search for this author on this site
Elaheh Salardini
1Alzheimer’s Disease Research Unit, Yale School of Medicine, New Haven, Connecticut;
2Department of Psychiatry, Yale School of Medicine, New Haven, Connecticut;
  • Find this author on Google Scholar
  • Find this author on PubMed
  • Search for this author on this site
Richard E. Carson
4Department of Radiology and Biomedical Imaging, Yale School of Medicine, New Haven, Connecticut;
  • Find this author on Google Scholar
  • Find this author on PubMed
  • Search for this author on this site
Christopher H. van Dyck
1Alzheimer’s Disease Research Unit, Yale School of Medicine, New Haven, Connecticut;
2Department of Psychiatry, Yale School of Medicine, New Haven, Connecticut;
5Department of Neuroscience, Yale School of Medicine, New Haven, Connecticut; and
6Department of Neurology, Yale School of Medicine, New Haven, Connecticut
  • Find this author on Google Scholar
  • Find this author on PubMed
  • Search for this author on this site
Adam P. Mecca
1Alzheimer’s Disease Research Unit, Yale School of Medicine, New Haven, Connecticut;
2Department of Psychiatry, Yale School of Medicine, New Haven, Connecticut;
  • Find this author on Google Scholar
  • Find this author on PubMed
  • Search for this author on this site
  • Article
  • Figures & Data
  • Supplemental
  • Info & Metrics
  • PDF
Loading

Visual Abstract

Figure
  • Download figure
  • Open in new tab
  • Download powerpoint

Abstract

Simplified methods of acquisition and quantification would facilitate the use of synaptic density imaging in multicenter and longitudinal studies of Alzheimer disease (AD). We validated a simplified tissue-to-reference ratio method using SUV ratios (SUVRs) for estimating synaptic density with [11C]UCB-J PET. Methods: Participants included 31 older adults with AD and 16 with normal cognition. The distribution volume ratio (DVR) using simplified reference tissue model 2 was compared with SUVR at short scan windows using a whole-cerebellum reference region. Results: Synaptic density was reduced in AD participants using DVR or SUVR. SUVR using later scan windows (60–90 or 70–90 min) was minimally biased, with the strongest correlation with DVR. Effect sizes using SUVR at these late time windows were minimally reduced compared with effect sizes with DVR. Conclusion: A simplified tissue-to-reference method may be useful for multicenter and longitudinal studies seeking to measure synaptic density in AD.

  • [11C]UCB-J
  • synaptic density
  • SUVR
  • PET
  • Alzheimer disease

Alzheimer Disease (AD) pathology is traditionally characterized by the accumulation of extracellular amyloid-β plaques and intracellular neurofibrillary tangles. An equally important pathology, synaptic loss, is an early event in the disease process and a major structural correlate of cognitive impairment (1–3). PET imaging of synaptic vesicle glycoprotein 2A has emerged as a novel biomarker of synaptic density in AD (4,5). Using (R)-1-((3-(11C-methyl-11C)pyridin-4-yl)methyl)-4-(3,4,5-trifluorophenyl)pyrrolidin-2-one ([11C]UCB-J) PET, we and others have demonstrated widespread gray matter synaptic loss (6), which correlated with cognitive performance (7,8) and tau deposition (9–12). Our past analyses have used an outcome of distribution volume ratio (DVR) from simplified reference tissue model 2 kinetic modeling. Simplified methods of image acquisition and quantification would facilitate multicenter and longitudinal studies. Thus, the objective of this study was to validate a simplified tissue-to-reference ratio method using SUV ratios (SUVRs).

MATERIALS AND METHODS

Participants

A subset of previously reported participants (6) who had full 90-min scans were included in this analysis. Participants 55–85 y of age were recruited and assessed either to be cognitively normal (CN) or to meet the diagnostic criteria for amnestic mild cognitive impairment (13) or dementia due to probable AD (14). Via [11C]Pittsburgh compound B PET, mild cognitive impairment and dementia participants were amyloid-β–positive and CN participants were amyloid-β–negative (6,15,16). The study protocol was approved by the Yale Human Investigation Committee. All participants gave informed consent.

Acquisition of Data

[11C]UCB-J PET images were acquired as previously described (17). Participants underwent 90-min PET scans on a High Resolution Research Tomograph (Siemens Medical Solutions) after a bolus injection of [11C]UCB-J (553 ± 199 MBq) over 1 min. Dynamic scan data were reconstructed in 27 frames (6 × 0.5 min, 3 × 1 min, 2 × 2 min, 16 × 5 min) with corrections for attenuation, normalization, scatter, randoms, and dead time using the MOLAR algorithm (motion-compensation ordered subset expectation maximization list-mode algorithm for resolution-recovery reconstruction) (18). Motion was corrected using the Polaris Vicra sensor (NDI Systems) (19). T1-weighted MRI was used for exclusion of structural abnormalities and for coregistration with PET scans. Parametric images of DVR were generated using simplified reference tissue model 2 (0–60 min) with a whole-cerebellum reference region (6,15,16). SUVR images were generated by summing frames across 20- and 30-min windows from 30 to 90 min and normalized to the whole cerebellum. Regions of interest were defined using the FreeSurfer (version 6.0) segmentation and parcellation pipeline (20).

Simulation

A simulation study was conducted to examine the effect of perfusion differences on group-level comparisons of SUVR and Cohen d within AD and CN groups across various time points. This simulation was based on data from our previous study (4) using a 1-tissue-compartment model to estimate parameters for K1 (perfusion) and k2 (tracer efflux) in both the hippocampus and the cerebellum for each participant (Supplemental Table 1; supplemental materials are available at http://jnm.snmjournals.org). Effects of perfusion differences were explored by simulating hippocampal time–activity curves for each individual with AD according to varying K1 percentage differences (0%, 10%, 20%, 30%, and 40%) relative to the average K1 of the CN group; these correspond to R1 (relative tracer delivery) group percentage differences of 3%, 13%, 22%, 32%, and 42%, respectively. Percentage differences in mean SUVR between CN and AD groups and Cohen d values were computed at each time point and were compared with the percentage differences in DVR for all K1 settings. The supplemental methods provide more detailed information.

Statistical Analysis

Group differences were evaluated using χ2 tests for categoric variables and unpaired t tests for continuous variables. Linear regression was used to assess the associations between SUVRs and DVR (via kinetic modeling). The effect size (Cohen d) to determine the group difference (CN vs. AD) was calculated for each PET outcome. Linear regression was used to assess the correlation between effect sizes using DVR and SUVR. Regression equations and Pearson correlation coefficients (r) were reported for each regression model. Two-tailed P values were reported. Statistical analyses were performed using SPSS 21.0 (IBM Corp.).

RESULTS

Participant characteristics are shown in Table 1.

View this table:
  • View inline
  • View popup
TABLE 1.

Participant Characteristics

DVR correlated strongly with SUVR across all brain regions and within each region (Fig. 1; Supplemental Fig. 1; Supplemental Table 2). The correlation was strongest for the 60- to 90-min and 70- to 90-min scan windows and weakest for the 30- to 50-min window. A similar pattern was seen in all participants or when CN or AD participants were analyzed separately. A comparison of regression lines to the line of identity showed that SUVR was less biased at later scan windows than at earlier scan windows (Fig. 1).

FIGURE 1.
  • Download figure
  • Open in new tab
  • Download powerpoint
FIGURE 1.

Correlations between DVR and SUVR at 30–60 min (A), 60–90 min (B), 30–50 min (C), and 70–90 min (D) for all participants and for CN and AD groups in all regions of interest.

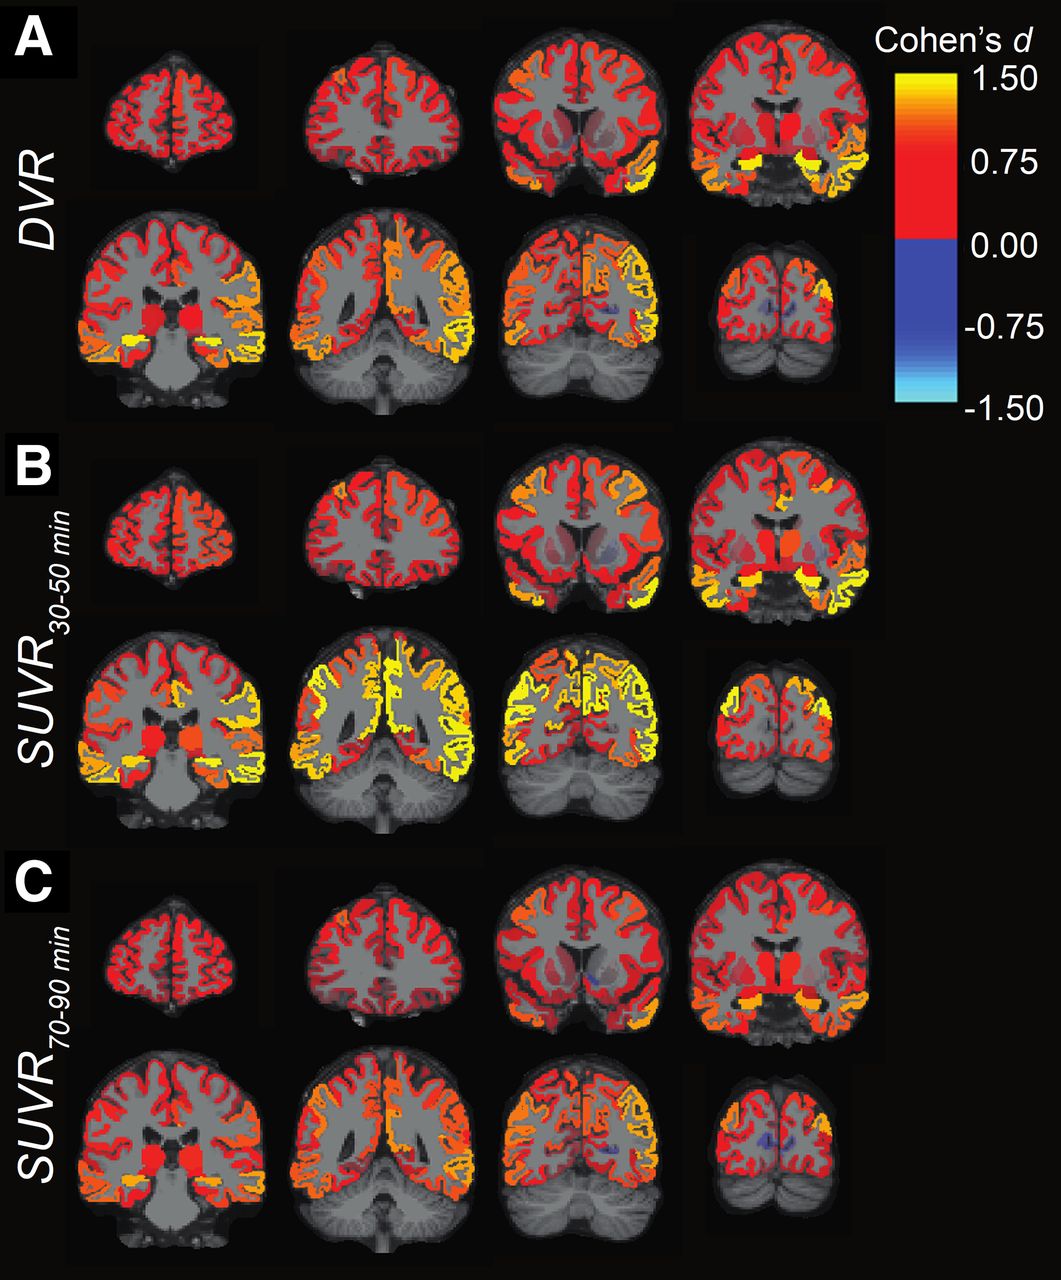
The effect sizes for the difference between CN and AD groups using SUVR were larger during earlier scan windows than during later scan windows, with the largest effect size being calculated for the 30- to 50-min scan window (Cohen d = 0.78) and the smallest effect being calculated for the 70- to 90-min window (Cohen d = 0.6) (Table 2). The effect size for SUVR at each scan window correlated strongly with the effect size for DVR (Table 2; Fig. 2). Early scan windows tended to overestimate the effect size, and later scan windows tended to underestimate the effect size, compared with DVR (Fig. 2). For specific regions, the same pattern of decreasing effect size at later time windows was consistently seen in the entorhinal cortex, lateral temporal cortex, prefrontal cortex, posterior cingulum/precuneus, lateral parietal cortex, lateral occipital cortex, and medial occipital cortex (Fig. 3; Supplemental Fig. 2).

View this table:
  • View inline
  • View popup
TABLE 2.

Correlation of Effect Sizes to Detect Differences in Synaptic Density Between AD and CN Groups

FIGURE 2.
  • Download figure
  • Open in new tab
  • Download powerpoint
FIGURE 2.

Correlations between effect sizes (Cohen d) in all regions of interest as measured by DVR and SUVR at 30–60 min (A), 60–90 min (B), 30–50 min (C), and 70–90 min (D).

FIGURE 3.
  • Download figure
  • Open in new tab
  • Download powerpoint
FIGURE 3.

Effect size (Cohen d) maps of DVR (A), SUVR at 30–50 min (B), and SUVR at 70–90 min (C) for comparison between CN and AD groups. Effect size statistics are displayed for all analyzed regions and overlaid on MNI template T1-weighted MR images.

The simulation model demonstrates how the percentage difference in SUVR (AD vs. CN) changes during the scan time (Fig. 4). At early scan times, the percentage difference approaches the difference in relative perfusion. As scan time increases, the percentage difference approaches the true difference using mean DVR. Thus, SUVR calculated from earlier scan windows reflects differences in perfusion, and SUVR calculated from later windows reflects specific tracer binding (synaptic density).

FIGURE 4.
  • Download figure
  • Open in new tab
  • Download powerpoint
FIGURE 4.

Simulation of group difference in mean SUVR (A) and Cohen d (B) for various perfusion changes.

DISCUSSION

SUVR calculated with later scan windows (60–90 or 70–90 min) had the strongest correlations with the previously validated method of calculating DVR with simplified reference tissue model 2 and a whole-cerebellum reference region (6,8).

SUVR generated using earlier scan windows of 30–60 or 30–50 min demonstrated the largest effect sizes to detect differences between AD and CN groups compared with later scan windows and DVR (Table 2). There was some region specificity as seen in early AD–affected regions such as the hippocampus, where no SUVR scan window demonstrated a larger effect size than DVR (Fig. 3; Supplemental Fig. 2). Correlation analyses between SUVR and DVR indicate that early scan windows may overestimate, and later scan windows may underestimate, group differences (Fig. 2; Supplemental Fig. 2). Our simulation suggests that SUVR from earlier time frames represents group differences in both synaptic density and perfusion/metabolism (Fig. 4). This is compatible with our previous [18F]FDG PET and [11C]UCB-J study, in which group differences in metabolism were generally larger than those in synaptic density (21).

This study using the whole cerebellum as a reference region expands on the validation of a simplified quantification method for [11C]UCB-J that used the centrum semiovale as a reference region (22). We previously reported that whole cerebellum is the preferred reference region in AD because the disease-related difference in distribution volume was nonsignificant and lower than for the centrum semiovale and because DVR using the cerebellum yielded significantly lower coefficients of variation when using 1-tissue-compartment modeling or the simplified reference tissue model 2 (6).

CONCLUSION

This study supports the use of SUVR with a whole-cerebellum reference region calculated during 60- to 90-min or 70- to 90-min scan windows for [11C]UCB-J–based investigations of AD. SUVRs at late time windows are minimally biased and highly correlated with DVR while having minimal bias in effect size compared with DVR.

DISCLOSURE

Support was received from P50AG047270, K23AG057784, R01AG052560, R01AG062276, and T32AG1934. No other potential conflict of interest relevant to this article was reported.

KEY POINTS

QUESTION: Is SUVR a valid outcome for assessing synaptic density in AD with [11C]UCB-J?

PERTINENT FINDINGS: SUVR calculated with 60- to 90-min or 70- to 90-min scan windows correlated strongly with DVR and was minimally biased.

IMPLICATIONS FOR PATIENT CARE: SUVR can be used to quantify synaptic loss in AD.

ACKNOWLEDGMENTS

We thank Joel Gelernter, MD, and Ann Marie Lacobelle for their assistance with the APOE genotyping data included in this article.

Footnotes

  • Published online Sep. 19, 2024.

  • © 2024 by the Society of Nuclear Medicine and Molecular Imaging.

Immediate Open Access: Creative Commons Attribution 4.0 International License (CC BY) allows users to share and adapt with attribution, excluding materials credited to previous publications. License: https://creativecommons.org/licenses/by/4.0/. Details: https://jnm.snmjournals.org/page/permissions.

REFERENCES

  1. 1.↵
    1. DeKosky ST,
    2. Scheff SW
    . Synapse loss in frontal cortex biopsies in Alzheimer’s disease: correlation with cognitive severity. Ann Neurol. 1990;27:457–464.
    OpenUrlCrossRefPubMed
  2. 2.
    1. Masliah E,
    2. Ellisman M,
    3. Carragher B,
    4. et al
    . Three-dimensional analysis of the relationship between synaptic pathology and neuropil threads in Alzheimer disease. J Neuropathol Exp Neurol. 1992;51:404–414.
    OpenUrlCrossRefPubMed
  3. 3.↵
    1. Terry RD,
    2. Masliah E,
    3. Salmon DP,
    4. et al
    . Physical basis of cognitive alterations in Alzheimer’s disease: synapse loss is the major correlate of cognitive impairment. Ann Neurol. 1991;30:572–580.
    OpenUrlCrossRefPubMed
  4. 4.↵
    1. Chen MK,
    2. Mecca AP,
    3. Naganawa M,
    4. et al
    . Assessing synaptic density in Alzheimer disease with synaptic vesicle glycoprotein 2A positron emission tomographic imaging. JAMA Neurol. 2018;75:1215–1224.
    OpenUrlPubMed
  5. 5.↵
    1. Bastin C,
    2. Bahri MA,
    3. Meyer F,
    4. et al
    . In vivo imaging of synaptic loss in Alzheimer’s disease with [18F]UCB-H positron emission tomography. Eur J Nucl Med Mol Imaging. 2020;47:390–402.
  6. 6.↵
    1. Mecca AP,
    2. Chen MK,
    3. O’Dell RS,
    4. et al
    . In vivo measurement of widespread synaptic loss in Alzheimer’s disease with SV2A PET. Alzheimers Dement. 2020;16:974–982.
  7. 7.↵
    1. Mecca AP,
    2. O’Dell RS,
    3. Sharp ES,
    4. et al
    . Synaptic density and cognitive performance in Alzheimer’s disease: a PET imaging study with [11C]UCB-J. Alzheimers Dement. 2022;18:2527–2536.
  8. 8.↵
    1. O’Dell RS,
    2. Higgins-Chen A,
    3. Gupta D,
    4. et al
    . Principal component analysis of synaptic density measured with [11C]UCB-J PET in early Alzheimer’s disease. Neuroimage Clin. 2023;39:103457.
    OpenUrlPubMed
  9. 9.↵
    1. Mecca AP,
    2. Chen MK,
    3. O’Dell RS,
    4. et al
    . Association of entorhinal cortical tau deposition and hippocampal synaptic density in older individuals with normal cognition and early Alzheimer’s disease. Neurobiol Aging. 2022;111:44–53.
    OpenUrlCrossRefPubMed
  10. 10.
    1. Coomans EM,
    2. Schoonhoven DN,
    3. Tuncel H,
    4. et al
    . In vivo tau pathology is associated with synaptic loss and altered synaptic function. Alzheimers Res Ther. 2021;13:35.
    OpenUrlPubMed
  11. 11.
    1. Vanhaute H,
    2. Ceccarini J,
    3. Michiels L,
    4. et al
    . In vivo synaptic density loss is related to tau deposition in amnestic mild cognitive impairment. Neurology. 2020;95:e545–e553.
    OpenUrlPubMed
  12. 12.↵
    1. Vanderlinden G,
    2. Ceccarini J,
    3. Vande Casteele T,
    4. et al
    . Spatial decrease of synaptic density in amnestic mild cognitive impairment follows the tau build-up pattern. Mol Psychiatry. 2022;27:4244–4251.
    OpenUrlCrossRefPubMed
  13. 13.↵
    1. Albert MS,
    2. DeKosky ST,
    3. Dickson D,
    4. et al
    . The diagnosis of mild cognitive impairment due to Alzheimer’s disease: recommendations from the National Institute on Aging-Alzheimer’s Association workgroups on diagnostic guidelines for Alzheimer’s disease. Alzheimers Dement. 2011;7:270–279.
    OpenUrlCrossRefPubMed
  14. 14.↵
    1. McKhann GM,
    2. Knopman DS,
    3. Chertkow H,
    4. et al
    . The diagnosis of dementia due to Alzheimer’s disease: recommendations from the National Institute on Aging-Alzheimer’s Association workgroups on diagnostic guidelines for Alzheimer’s disease. Alzheimers Dement. 2011;7:263–269.
    OpenUrlCrossRefPubMed
  15. 15.↵
    1. Carson RE,
    2. Naganawa M,
    3. Toyonaga T,
    4. et al
    . Imaging of synaptic density in neurodegenerative disorders. J Nucl Med. 2022;63(suppl 1):60S–67S.
    OpenUrlAbstract/FREE Full Text
  16. 16.↵
    1. O’Dell RS,
    2. Mecca AP,
    3. Chen MK,
    4. et al
    . Association of Aβ deposition and regional synaptic density in early Alzheimer’s disease: a PET imaging study with [11C]UCB-J. Alzheimers Res Ther. 2021;13:11.
    OpenUrlPubMed
  17. 17.↵
    1. Finnema SJ,
    2. Nabulsi NB,
    3. Mercier J,
    4. et al
    . Kinetic evaluation and test-retest reproducibility of [11C]UCB-J, a novel radioligand for positron emission tomography imaging of synaptic vesicle glycoprotein 2A in humans. J Cereb Blood Flow Metab. 2018;38:2041–2052.
    OpenUrlCrossRefPubMed
  18. 18.↵
    1. Carson RE,
    2. Barker WC,
    3. Liow JS,
    4. Johnson CA
    . Design of a motion-compensation OSEM list-mode algorithm for resolution-recovery reconstruction for the HRRT. In: 2003 IEEE Nuclear Sciences Symposium. IEEE; 2003;5:3281–3285.
  19. 19.↵
    1. Jin X,
    2. Mulnix T,
    3. Gallezot JD,
    4. Carson RE
    . Evaluation of motion correction methods in human brain PET imaging: a simulation study based on human motion data. Med Phys. 2013;40:102503.
    OpenUrlCrossRefPubMed
  20. 20.↵
    1. Fischl B
    . FreeSurfer. Neuroimage. 2012;62:774–781.
    OpenUrlCrossRefPubMed
  21. 21.↵
    1. Chen MK,
    2. Mecca AP,
    3. Naganawa M,
    4. et al
    . Comparison of [11C]UCB-J and [18F]FDG PET in Alzheimer’s disease: a tracer kinetic modeling study. J Cereb Blood Flow Metab. 2021;41:2395–2409.
    OpenUrlCrossRefPubMed
  22. 22.↵
    1. Naganawa M,
    2. Gallezot JD,
    3. Finnema SJ,
    4. et al
    . Simplified quantification of 11C-UCB-J PET evaluated in a large human cohort. J Nucl Med. 2021;62:418–421.
    OpenUrlAbstract/FREE Full Text
  • Received for publication March 31, 2024.
  • Accepted for publication August 28, 2024.
PreviousNext
Back to top

In this issue

Journal of Nuclear Medicine: 65 (11)
Journal of Nuclear Medicine
Vol. 65, Issue 11
November 1, 2024
  • Table of Contents
  • Table of Contents (PDF)
  • About the Cover
  • Index by author
  • Complete Issue (PDF)
Print
Download PDF
Article Alerts
Sign In to Email Alerts with your Email Address
Email Article

Thank you for your interest in spreading the word on Journal of Nuclear Medicine.

NOTE: We only request your email address so that the person you are recommending the page to knows that you wanted them to see it, and that it is not junk mail. We do not capture any email address.

Enter multiple addresses on separate lines or separate them with commas.
Validation of a Simplified Tissue-to-Reference Ratio Measurement Using SUVR to Assess Synaptic Density Alterations in Alzheimer Disease with [11C]UCB-J PET
(Your Name) has sent you a message from Journal of Nuclear Medicine
(Your Name) thought you would like to see the Journal of Nuclear Medicine web site.
Citation Tools
Validation of a Simplified Tissue-to-Reference Ratio Measurement Using SUVR to Assess Synaptic Density Alterations in Alzheimer Disease with [11C]UCB-J PET
Juan J. Young, Ryan S. O’Dell, Mika Naganawa, Takuya Toyonaga, Ming-Kai Chen, Nabeel B. Nabulsi, Yiyun Huang, Emma Cooper, Alyssa Miller, Jessica Lam, Kara Bates, Audrey Ruan, Kimberly Nelsen, Elaheh Salardini, Richard E. Carson, Christopher H. van Dyck, Adam P. Mecca
Journal of Nuclear Medicine Nov 2024, 65 (11) 1782-1785; DOI: 10.2967/jnumed.124.267419

Citation Manager Formats

  • BibTeX
  • Bookends
  • EasyBib
  • EndNote (tagged)
  • EndNote 8 (xml)
  • Medlars
  • Mendeley
  • Papers
  • RefWorks Tagged
  • Ref Manager
  • RIS
  • Zotero
Share
Validation of a Simplified Tissue-to-Reference Ratio Measurement Using SUVR to Assess Synaptic Density Alterations in Alzheimer Disease with [11C]UCB-J PET
Juan J. Young, Ryan S. O’Dell, Mika Naganawa, Takuya Toyonaga, Ming-Kai Chen, Nabeel B. Nabulsi, Yiyun Huang, Emma Cooper, Alyssa Miller, Jessica Lam, Kara Bates, Audrey Ruan, Kimberly Nelsen, Elaheh Salardini, Richard E. Carson, Christopher H. van Dyck, Adam P. Mecca
Journal of Nuclear Medicine Nov 2024, 65 (11) 1782-1785; DOI: 10.2967/jnumed.124.267419
Twitter logo Facebook logo LinkedIn logo Mendeley logo
  • Tweet Widget
  • Facebook Like
  • Google Plus One
Bookmark this article

Jump to section

  • Article
    • Visual Abstract
    • Abstract
    • MATERIALS AND METHODS
    • RESULTS
    • DISCUSSION
    • CONCLUSION
    • DISCLOSURE
    • ACKNOWLEDGMENTS
    • Footnotes
    • REFERENCES
  • Figures & Data
  • Supplemental
  • Info & Metrics
  • PDF

Related Articles

  • PubMed
  • Google Scholar

Cited By...

  • Imaging Synaptic Density in Aging and Alzheimer Disease with [18F]SynVesT-1
  • Google Scholar

More in this TOC Section

  • Radiances of Cerenkov-Emitting Radionuclides on the In Vivo Imaging System
  • Measuring Total Metabolic Tumor Volume from 18F-FDG PET: A Reality Check
  • Bioanalytic Hybrid System Merging 3-Dimensional Cell Culture and Chromatographic Precision for Unprecedented Preclinical Insights in Molecular Imaging
Show more BRIEF COMMUNICATION

Similar Articles

Keywords

  • [11C]UCB-J
  • synaptic density
  • SUVR
  • PET
  • Alzheimer disease
SNMMI

© 2025 SNMMI

Powered by HighWire