


Visual Abstract
Abstract
Previous studies on the utility of specific perfusion patterns in ictal brain perfusion SPECT for predicting the outcome of temporal lobe epilepsy surgery used qualitative visual pattern classification, semiquantitative region-of-interest analysis, or conventional univariate voxel-based testing, which are limited by intra- and interrater variability or low sensitivity to capture functional interactions among brain regions. The present study performed covariance pattern analysis of ictal perfusion SPECT using the scaled subprofile model for unbiased identification of predictive covariance patterns. Methods: The study retrospectively included 18 responders to temporal lobe epilepsy surgery (Engel I-A at 12 mo follow-up) and 18 nonresponders (≥Engel I-B). Ictal SPECT images were analyzed with the scaled subprofile model masked to group membership for unbiased identification of the 16 covariance patterns explaining the highest proportion of variance in the whole dataset. Individual expression scores of the covariance patterns were evaluated for predicting seizure freedom after temporal lobe surgery by receiver-operating-characteristic analysis. Kaplan–Meier analysis including all available follow-up data (up to 60 mo after surgery) was also performed. Results: Among the 16 covariance patterns only 1 showed a different expression between responders and nonresponders (P = 0.03). This favorable ictal perfusion pattern resembled the typical ictal perfusion pattern in temporomesial epilepsy. The expression score of the pattern provided an area of 0.744 (95% CI, 0.577–0.911, P = 0.004) under the receiver-operating-characteristic curve. Kaplan–Meier analysis revealed a statistical trend toward longer seizure freedom in patients with positive expression score (P = 0.06). The median estimated seizure-free time was 48 mo in patients with positive expression score versus 6 mo in patients with negative expression score. Conclusion: The expression of the favorable ictal perfusion pattern identified by covariance analysis of ictal brain perfusion SPECT provides independent (from demographic and clinical variables) information for the prediction of seizure freedom after temporal lobe epilepsy surgery. The expression of this pattern is easily computed for new ictal SPECT images and, therefore, might be used to support the decision for or against temporal lobe surgery in clinical patient care.
Temporal lobe epilepsy (TLE) surgery fails to provide a major reduction in seizure frequency in a nonnegligible fraction of patients with pharmacotherapy-refractory TLE (1). Furthermore, postoperative morbidity including psychiatric disorders, visual field defects, and cognitive impairment is observed in about 20% of the patients (2). Thus, there is a clinical need for additional preoperative predictors of surgical outcome to support the decision for or against TLE surgery in individual patients.
Ictal brain SPECT with 99mTc-labeled hexamethyl-propyleneamine oxime (99mTc-HMPAO) or ethyl cysteinate dimer (99mTc-ECD) is widely used to identify the seizure onset zone (SOZ) by regional hyperperfusion during the seizure. In patients with mesial TLE, ictal hyperperfusion typically involves the anteromesial temporal region as well as the anterolateral and inferior temporal neocortex (3,4). Other patterns with posterior extension of the ipsilateral temporal hyperperfusion, bitemporal hyperperfusion, more limited hyperperfusion in the ipsilateral temporal lobe or atypical patterns with hyperperfusion predominantly in other than anterotemporal brain regions have also been described in mesial TLE (3,4).
Previous studies on the utility of specific perfusion patterns in ictal brain perfusion SPECT for predicting the outcome of epilepsy surgery used qualitative visual classification of the ictal perfusion pattern (4), semiquantitative region-of-interest analysis (4), or conventional voxel-based testing based on applying the same univariate statistical test and the same significance threshold at each single voxel of the SPECT image (5–7). Visual classification of ictal perfusion patterns is limited by intra- and interrater variability (8). The same is true for conventional voxel-based testing, because the interpretation of the resulting statistical maps is usually left to the physician. Furthermore, relevant information in the ictal SPECT image might be missed by region-of-interest–based and conventional voxel-based analysis when it does not reach the predefined significance threshold.
Against this background, the present study used scaled subprofile model principal component analysis (SSM-PCA) (9–14) for unbiased identification of covariance patterns for prediction of TLE surgery outcome from ictal perfusion SPECT.
MATERIALS AND METHODS
Patients for Covariance Pattern Analysis
We searched our database according to the following inclusion (I) criteria: (I1) ictal SPECT with 99mTc-ECD or 99mTc-HMPAO for presurgical evaluation, (I2) age at ictal SPECT ≥ 16 y, (I3) ictal tracer injection during a partial seizure, (I4) selective amygdalo-hippocampectomy or anteromedial temporal resection after ictal SPECT, and (I5) follow-up ≥ 12 mo after surgery. These criteria were fulfilled by 65 patients. From these, patients were excluded if they met one or more of the following exclusion (E) criteria: (E1) brain surgery before ictal SPECT or any other regional defect (n = 8), (E2) no clear correlate of the seizure at ictal tracer injection in electroencephalography (EEG) (n = 3), (E3) tracer injection during a secondarily generalized partial seizure (n = 10), (E4) latency of the tracer injection after electrical seizure onset > 60 s (n = 5), (E5) electrical seizure duration after tracer injection < 20 s (n = 8), and (E6) strong head motion during SPECT (n = 1). This resulted in the exclusion of 29 patients. The remaining 36 patients were included in the covariance pattern analysis (44% women; median age at ictal SPECT, 41.8 y; interquartile range, 24.9–47.7 y). Ictal SPECT was performed with 99mTc-ECD in 27 (75%) of these patients. 99mTc-HMPAO was used in the remaining 9 patients (25%).
The need for written informed consent was waived by the ethics review board of the general medical council of the state of Hamburg, Germany.
Perfusion SPECT
Tracer was injected during video-EEG monitoring at all ictal injections. SPECT imaging of 40-min duration was performed with a double-head camera (Symbia T2 or E.CAM; Siemens) equipped with fanbeam or low-energy high-resolution collimators and angular steps of 2.8° or 3.0°. Projection data were retrieved from the archive for consistent retrospective image reconstruction: filtered backprojection with Butterworth filter of order 5 and cutoff 1.5 cycles/cm into transaxial SPECT slices with 3.9-mm cubic voxels, Chang attenuation correction (μ = 0.12/cm), no scatter correction, and postfiltering with an isotropic gaussian kernel with 8 mm full width at half maximum.
Surgery
Twenty-six patients (14 responders, 12 nonresponders) underwent selective amygdalo-hippocampectomy, and the remaining 10 patients (4 responders, 6 nonresponders) were submitted to anteromedial temporal resection. Surgery was performed in the right hemisphere in 24 (67%) patients and in the left hemisphere in 12 (33%) patients.
Selective amygdalo-hippocampectomy was performed using a frontobasolateral transsylvian approach (15). After getting access to the M1 complex of the middle cerebral artery and the temporal branches, the mesial temporal structures were identified and subpial resection of the uncal region and amygdala was performed. The hippocampal formation was removed en bloc to the level of the midbrain tectum and submitted to neuropathologic examination.
The anteromedial temporal resection was conducted via temporal craniotomy. The posterior limit of the neocortical resection was defined at about 5 cm from the temporal pole on the nondominant hemisphere and 4 cm on the dominant hemisphere. The temporal pole was removed en block. Subsequently, the temporomesial structures (amygdala, hippocampus and parahippocampal gyrus) were removed to the level of the midbrain tectum. Temporal pole and hippocampal formation were submitted to neuropathologic examination.
Follow-up
Postsurgical follow-up included at least 1 outpatient visit 3–6 mo after surgery and at least 1 inpatient visit 12 mo after surgery. The 12-mo inpatient visit comprised detailed medical history, brain MRI, neuropsychologic examination, and 3- to 4-d video-EEG monitoring. On the basis of the complete data collected at these visits, the outcome at 12 mo after surgery was categorized retrospectively according to the Engel Epilepsy Surgery Outcome Scale (16). The results are summarized in Figure 1. For the covariance pattern analysis, the outcome at 12 mo was dichotomized: patients with Engel I-A were considered responders (n = 18); all patients with Engel I-B or worse were considered nonresponders (n = 18).
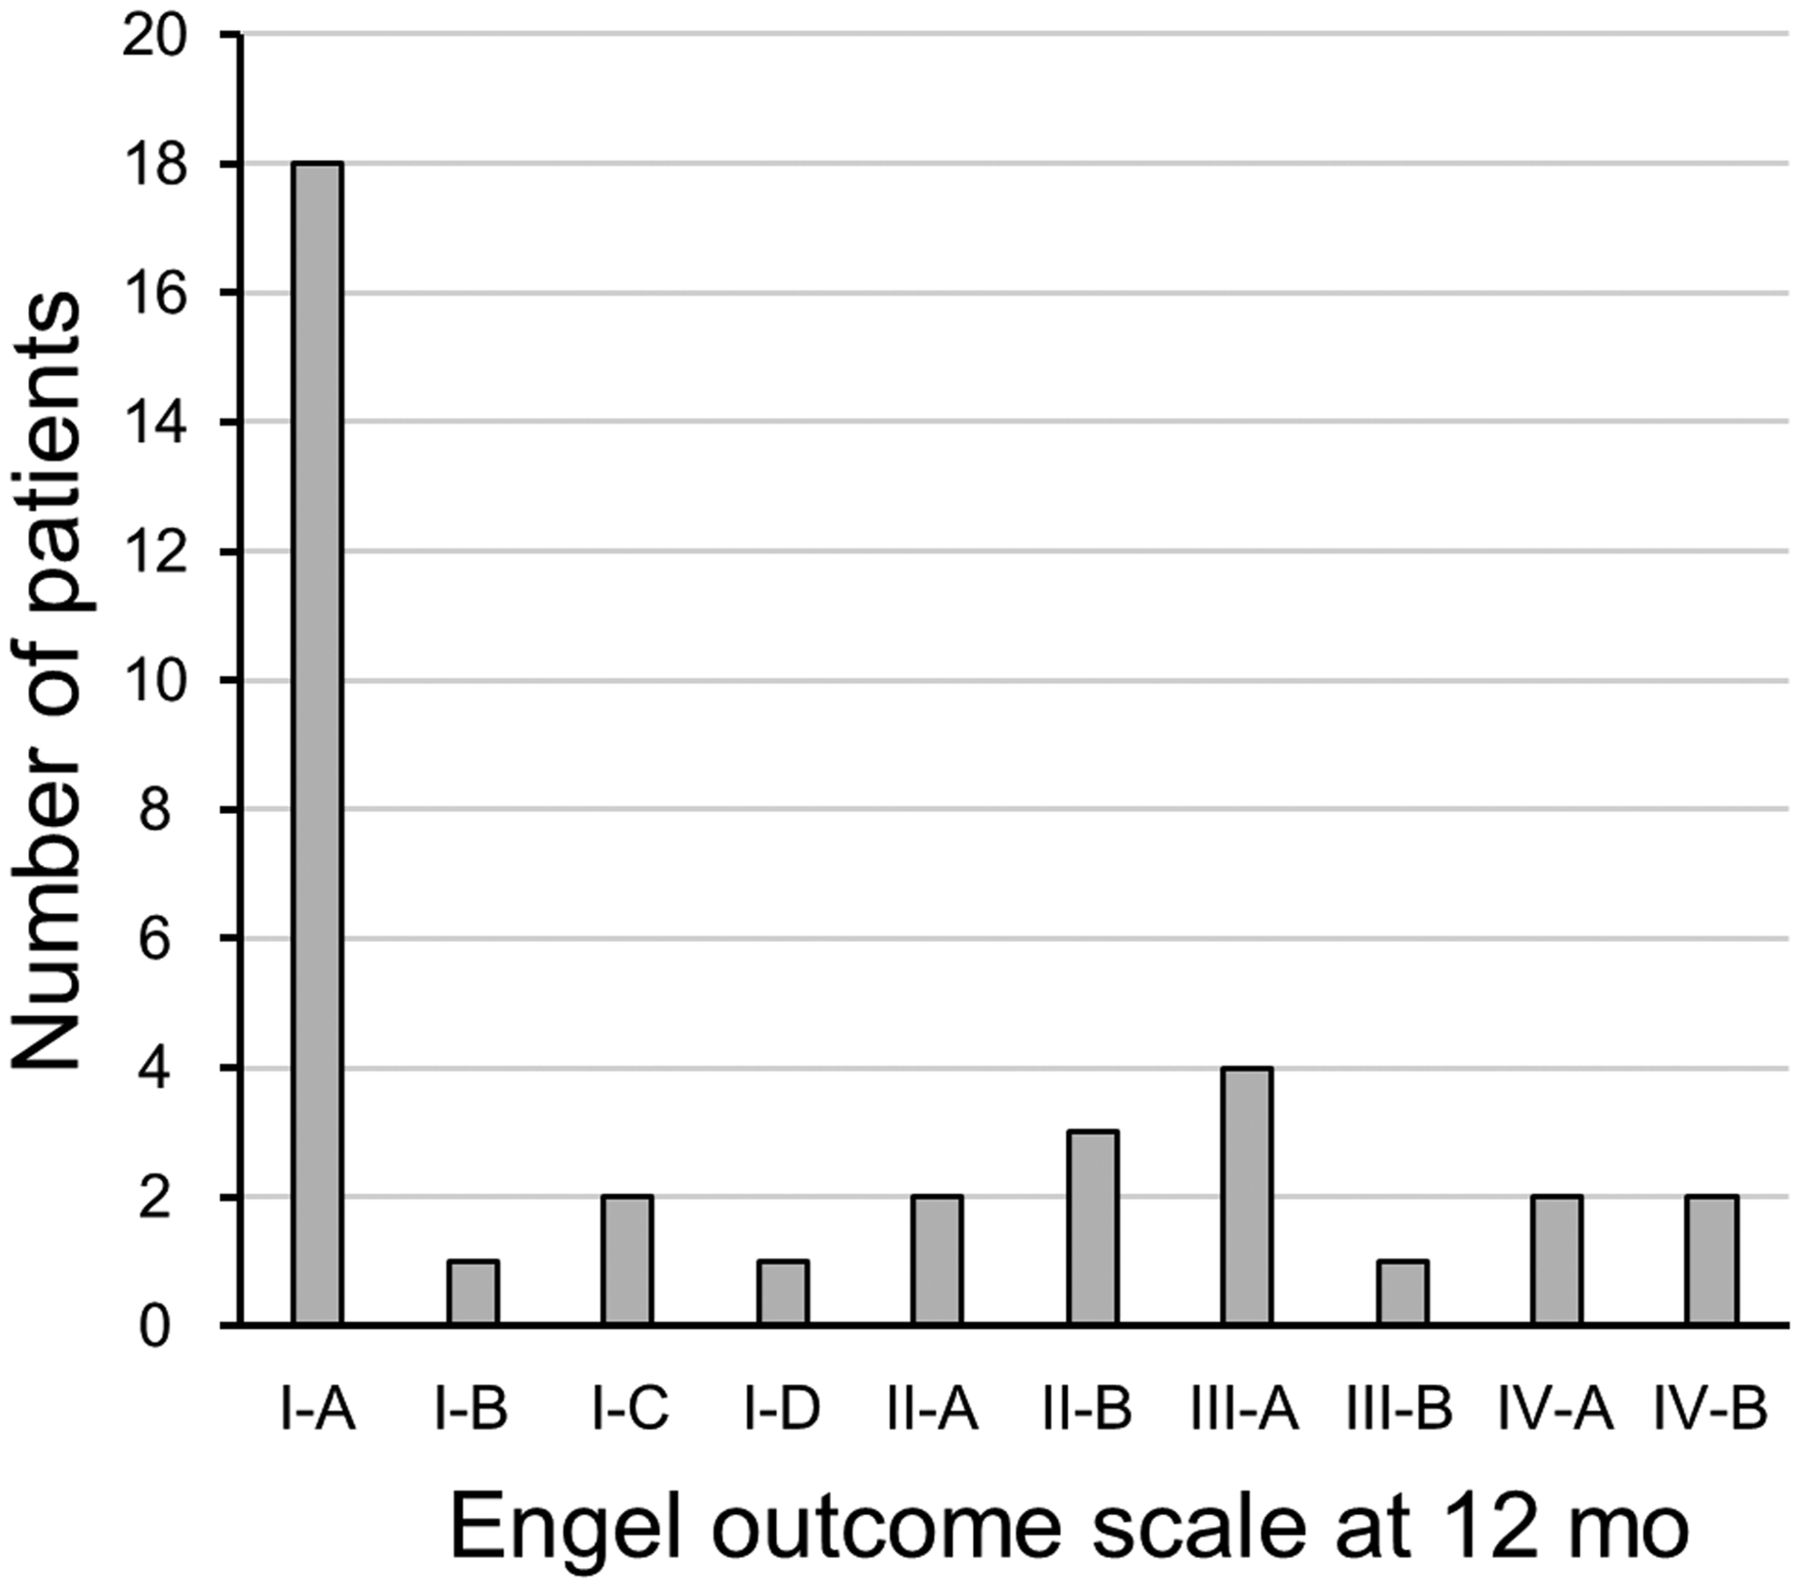
Engel Epilepsy Surgery Outcome Scale at 12 mo after TLE surgery. Patients with Engel I-A at 12 mo were considered responders; all other patients were considered nonresponders.
Clinical follow-up at 24, 36, 48, and 60 mo was available in 14, 11, 11, and 10 responders, respectively (proportion of patients with Engel I-A: 86%, 82%, 73%, and 70%). Clinical follow-up at 24, 36, 48, and 60 mo was available in 15, 11, 9, and 6 nonresponders (all Engel I-B or worse at all time points).
Image Preprocessing
Tracer-specific normal databases and templates in the Montreal Neurologic Institute (MNI) space were generated as described in the supplemental materials (available at http://jnm.snmjournals.org).
Then, all individual SPECT images, including the 36 ictal SPECT and the 48 normal SPECT from the normal databases, were stereotactically normalized (affine) to MNI space using the statistical parametric mapping software package (SPM12; The Wellcome Centre for Human Neuroimaging, UCL Queen Square Institute of Neurology) and the corresponding custom-made SPECT template. Stereotactically normalized SPECT images were filtered with an isotropic gaussian kernel with 15 mm full width at half maximum and then scaled to the individual mean tracer uptake of the filtered image in a cerebrum parenchyma mask predefined in MNI space.
Voxelwise mean, SD, and coefficient of variance were computed from the stereotactically normalized, filtered, and scaled SPECT images, separately for the 99mTc-ECD and for the 99mTc-HMPAO normal database.
Individual stereotactically normalized, filtered, and scaled ictal SPECT images were transformed voxelwise to z scores using the following formula: z score = (individual tracer uptake – M)/SD, where M and SD are the mean value and the SD of normal 99mTc-ECD or normal 99mTc-HMPAO uptake (depending on the tracer used in this subject) in the considered voxel.
Finally, ictal z score images of the subjects in whom TLE surgery was performed in the left hemisphere were left–right flipped at the midsagittal plane so that the right side was the site of surgery in all ictal z score images.
Visual SPECT Interpretation
Visual interpretation of the ictal SPECT images was performed independently by 2 readers masked to all other data. The readers first lateralized the SOZ on the basis of regional hyperperfusion (left, right, both hemispheres, no hyperperfusion) and then localized the SOZ (temporal, frontal, parietal, occipital). In the case of temporal hyperperfusion, additional hyperperfusion in ipsilateral insular cortex, basal ganglia, and thalamus was considered to be a propagation effect that supports ipsilateral temporal seizure onset (17). Each reader interpreted all images twice. Images with discrepant interpretation with respect to lateralization or localization in the 2 reading sessions were assessed a third time to obtain an intrareader consensus. Finally, images with discrepant intrareader consensus with respect to lateralization or localization between the 2 readers were assessed in a common reading session of the 2 readers to obtain an interreader consensus.
Conventional Univariate Voxel-Based Analysis
z score maps of ictal SPECT were compared voxelwise between responders and nonresponders using the unpaired t test model implemented in SPM12. The latency of the tracer injection after electrical seizure onset in EEG was considered as a covariate. The significance level was set at uncorrected P = 0.005. Minimum cluster size was 1 mL.
Identification of a Prognostic Covariance Pattern Analysis
Spatial covariance analysis of the ictal z score images was performed with SSM-PCA implemented in the freely available Scan Analysis and Visualization Processor software package (version ScAnVP7.0w) (10). The covariance analysis was restricted to the same cerebrum parenchyma mask that was used for intensity scaling in order to avoid truncation artifacts. The ictal z score maps were not log-transformed for SSM-PCA in order to avoid truncation of negative z scores. Negative z scores indicate regional reduction of tracer uptake, which represents a relevant component of ictal perfusion patterns.
SSM-PCA with log-transformation was used to assess differences in normal cerebral uptake between 99mTc-ECD and 99mTc-HMPAO in the corresponding normal databases.
Statistical Analysis
Proportions are given as percentage and were compared between 2 groups using the Fisher exact test. Nominal variables with more than 2 possible values are given as percentages and were compared between groups using Pearson χ2 test. Continuous variables are given as median and interquartile range and were compared using the nonparametric Mann–Whitney U test. All tests were 2-sided. A P value of less than 0.05 was considered significant.
The individual expression scores of the 16 covariance patterns identified by SSM-PCA in the ictal z score images were compared between responders and nonresponders using the unpaired t test.
The prognostic power of the expression score of a given covariance pattern in ictal z score images was assessed by receiver-operating-characteristic (ROC) analysis. In addition, the expression score was dichotomized ( ≤0 vs. >0) and then tested as a factor in Kaplan–Meier analysis of seizure freedom (Engel I-A), taking into account the total individual follow-up period. The log-rank test was used to compare the difference in seizure-free time for statistical significance.
Data Availability
All covariance patterns identified in this study are available on request. Custom-made 99mTc-ECD and 99mTc-HMPAO templates as well as voxelwise mean and SD images of the 99mTc-ECD and 99mTc-HMPAO normal databases are also available on request.
RESULTS
Demographic, clinical, ictal SPECT, and surgery data of the 36 patients included in the SSM-PCA are summarized in Table 1. Responders and nonresponders did not differ with respect to sex, age at ictal SPECT, age at first seizure, duration of disease, seizure frequency, and proportion of patients with impairment of awareness in most seizures. Responders and nonresponders also did not differ with respect to lateralization (relative to TLE surgery) of seizure semiology, interictal EEG, ictal EEG, and MRI before ictal SPECT (Table 1). They also did not differ with respect to delay of surgery after ictal SPECT, side of resection, and neuropathology of the surgical specimen (Table 1). The proportion of patients in whom ictal SPECT was performed with 99mTc-ECD was higher among the responders (94% vs. 56%, P = 0.02). The latency of tracer injection relative to the electrical seizure start was shorter in the responders (median, 30 vs. 40 s, P = 0.02). Tracer dose for ictal SPECT and electrical duration of the seizure after tracer injection did not differ between responders and nonresponders.
Demographic, Clinical, SPECT, and Surgical Data
99mTc-ECD and 99mTc-HMPAO SPECT templates generated from the normal databases are shown in Supplemental Figure 1A. The voxelwise coefficient of variance of the tracer uptake in the 2 normal databases is shown in Supplemental Figure 1B. The first covariance pattern obtained by SSM-PCA of the 48 SPECT of the normal databases (Supplemental Fig. 2) explained 28.2% of the total variance and was the only pattern with significantly different expression between the 2 tracer-specific normal databases (P < 0.001; all other patterns: P ≥ 0.15).
Visual interpretation of the ictal SPECT identified the ipsilateral temporal lobe as SOZ in 12 (67%) responders and in 14 (78%) nonresponders. Visual interpretation localized the SOZ in the contralateral temporal lobe in 2 responders (11%). Bilateral hyperperfusion was described in 1 responder (6%). None of the nonresponders showed more pronounced contralateral or bilateral temporal hyperperfusion. The SOZ was localized to the temporal lobe in all patients with ictal hyperperfusion. No regional hyperperfusion was detected in 3 (17%) responders and in 4 (22%) nonresponders. The differences in the visual lateralization of ictal SPECT between responders and nonresponders were not significant (P = 0.35).
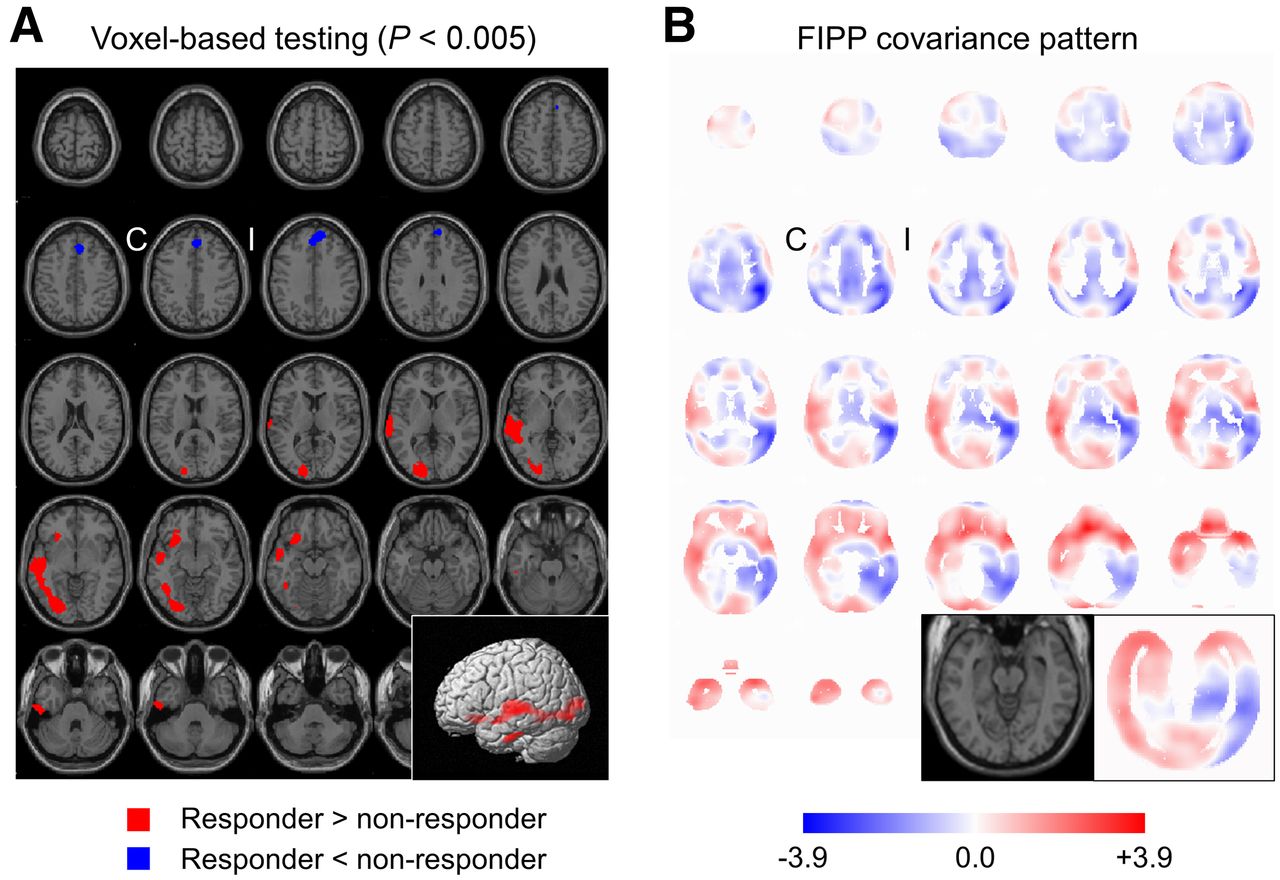
The mean z score maps of ictal SPECT are shown in Figure 2. The statistical parametric maps obtained by voxel-based statistical comparison of the z score maps between responders and nonresponders revealed higher z scores (more pronounced hyperperfusion) in responders in the contralateral (relative to resection) temporal and occipital lobe (Fig. 3A). There was a small cluster of lower z scores (more pronounced hypoperfusion) in responders in the mesial frontal lobe (mainly ipsilateral, Fig. 3A).
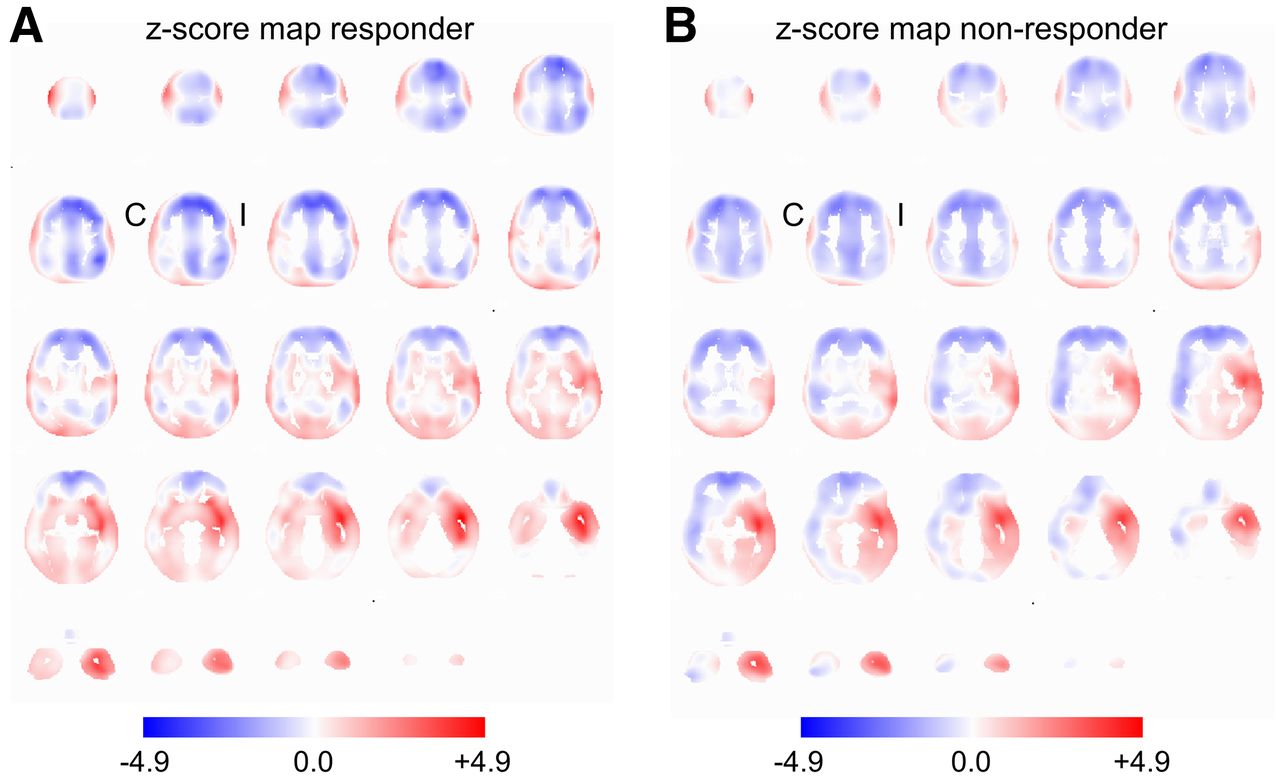
Mean z score maps of ictal SPECT in the 18 responders (A) and 18 nonresponders (B) in MNI space. Positive z scores (red) indicate increased perfusion (relative to custom-made normal databases); negative z scores (blue) indicate reduced perfusion. C = contralateral to TLE surgery; I = ipsilateral to TLE surgery.

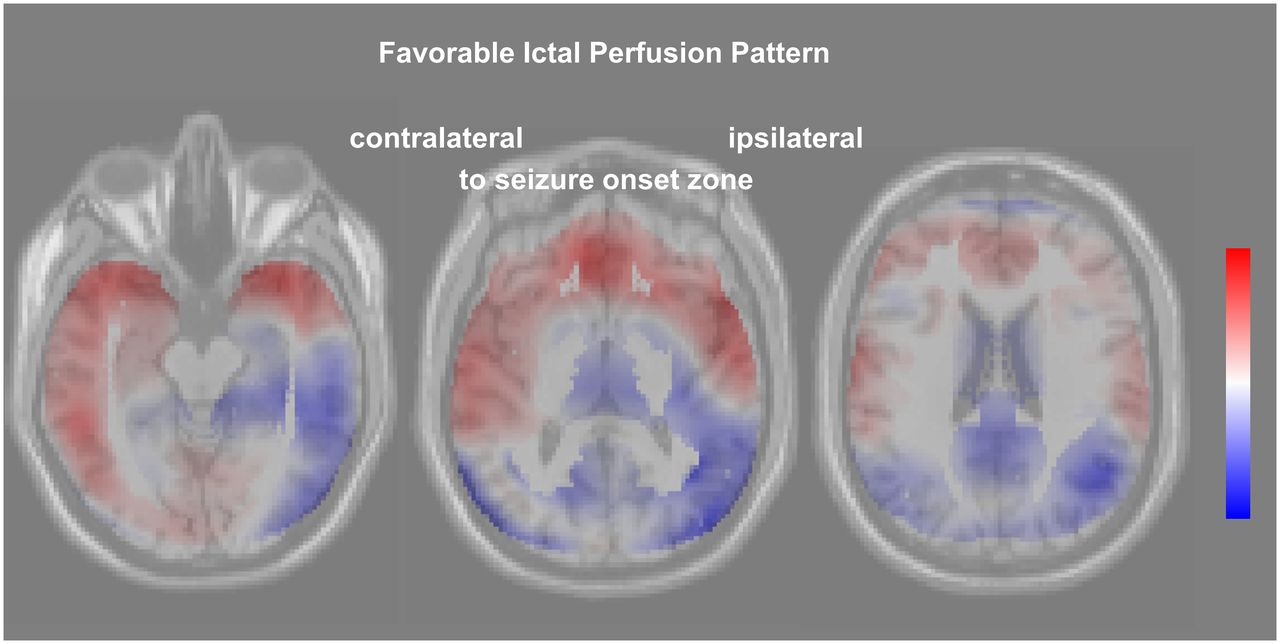
Statistical maps of hyperperfusion (red) and hypoperfusion (blue) obtained by conventional univariate voxel-based 1-sided t tests corrected for injection latency, thresholded at P = 0.005, and overlaid to the statistical parametric mapping (SPM) single-subject template (A). (B) FIPP. C = contralateral to TLE surgery; I = ipsilateral to TLE surgery.
Among the 16 covariance patterns determined by SSM-PCA in the 36 ictal SPECT only 1, the favorable ictal perfusion pattern (FIPP), showed different expression between responders and nonresponders (P = 0.03, Fig. 3B; all other patterns: P ≥ 0.10). The individual expression score of the FIPP provided an area of 0.744 (95% CI, 0.577–0.911; P = 0.004) under the ROC curve for the differentiation of responders from nonresponders (Fig. 4A). Kaplan–Meier analysis revealed a statistical trend toward longer seizure freedom in patients with positive FIPP expression score than patients with negative FIPP expression score (P = 0.06, Fig. 4B). The median estimated seizure-free time was 48 mo (positive expression score) versus 6 mo (negative expression score).
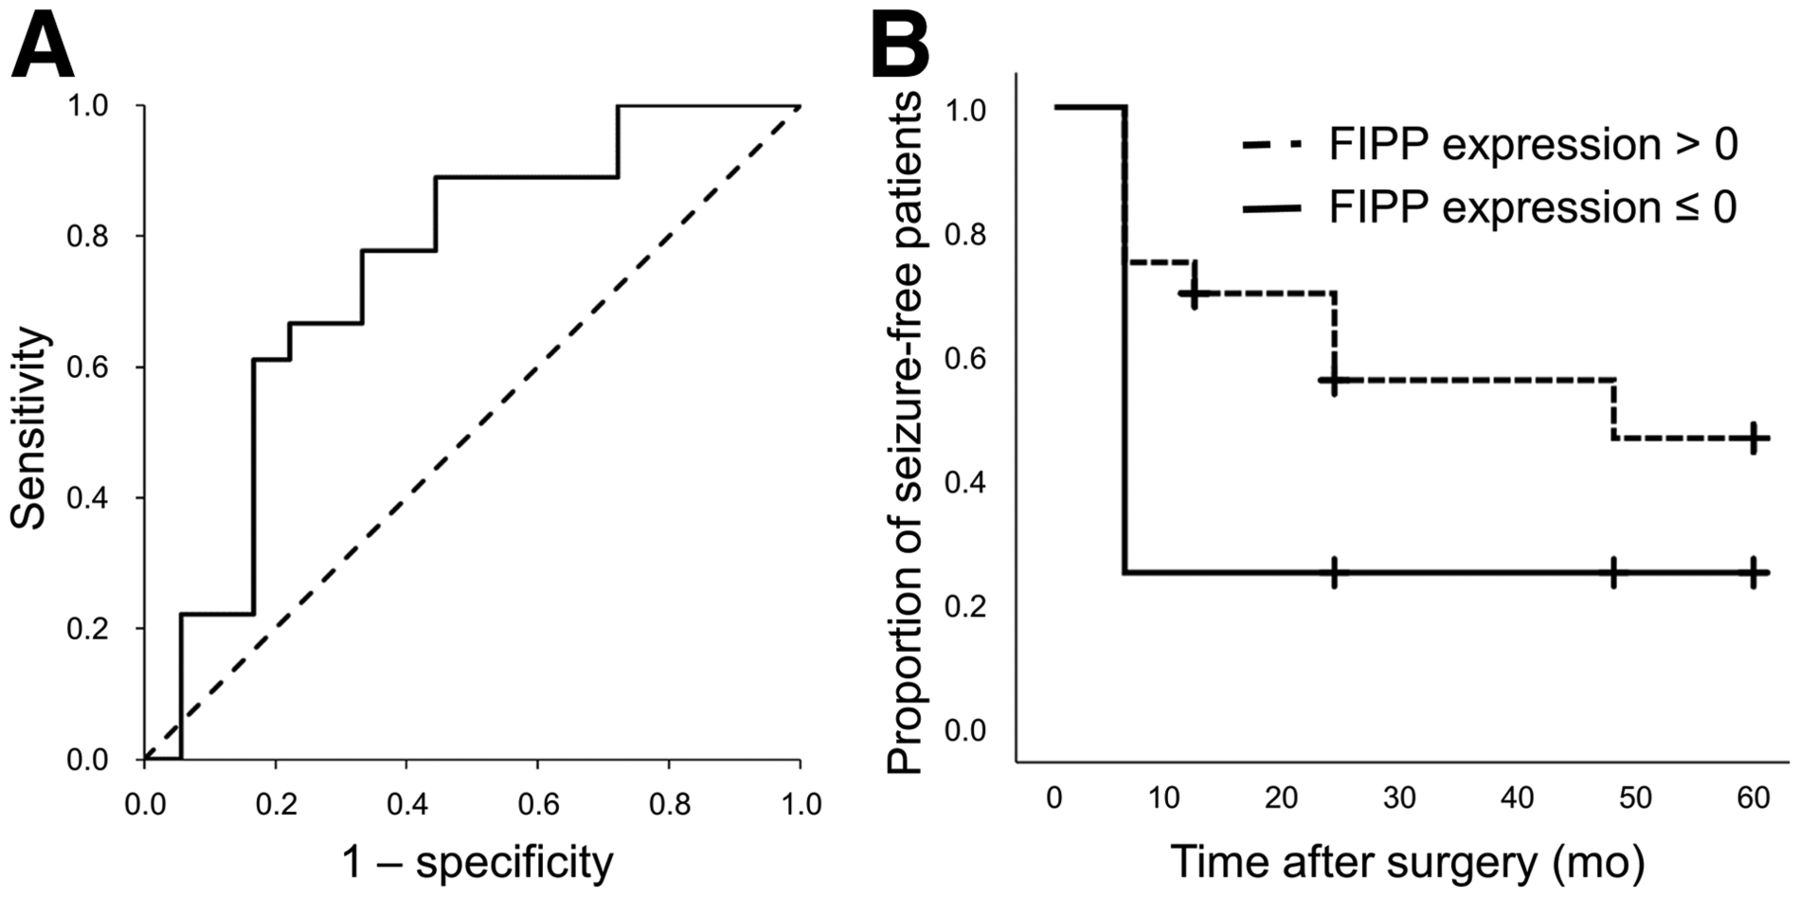
ROC analysis of FIPP expression score for identification of responders (A), and Kaplan–Meier analysis of patients with positive FIPP expression score versus patients with negative FIPP expression score (B).
DISCUSSION
This study used SSM-PCA to identify a covariance pattern (FIPP) in ictal brain perfusion SPECT whose expression is predictive of seizure freedom after TLE surgery. The FIPP expression score is easily computed for new ictal SPECT images to support their interpretation with respect to the chance of the patient to become seizure-free by TLE surgery. The computation is fully automatic and, therefore, does not require special expertise, in contrast to visual interpretation of ictal SPECT images.
SSM-PCA is stable with respect to variable image characteristics associated with different scanners for image acquisition or different software for image preprocessing (18), simplifying widespread clinical use. We hypothesize that the FIPP identified in this monosite study is useful also for other sites.
The FIPP comprises more pronounced ictal hyperperfusion in the anterior part of the ipsilateral (to resection) temporal lobe, less pronounced posterior extension of the ictal hyperperfusion in the ipsilateral temporal lobe, hyperperfusion in the contralateral temporal lobe (less pronounced than ipsilateral), hypoperfusion in the precuneus/posterior cingulate cortex area and in the ipsilateral parietotemporal region, and more pronounced hypoperfusion in the anterior frontal lobe (Fig. 3B). The FIPP resembles the typical perfusion pattern during complex partial seizures in patients with mesial TLE (4,17,19–21). Pronounced ictal hyperperfusion in the anterior ipsilateral temporal lobe is the most consistent finding in ictal perfusion SPECT in mesial temporal epilepsy (3,22). The lack of this pointer is a known risk factor of worse TLE surgery outcome (4). Hyperperfusion beyond the ipsilateral mesial temporal lobe might be explained by seizure propagation (23,24) or intrinsic epileptogenicity of the hyperperfused areas beyond the mesial temporal lobe. The FIPP suggests that hyperperfusion in the contralateral temporal lobe is predictive of good outcome of TLE surgery and, therefore, most likely is due to seizure propagation via interhemispheric connections. A SPECT mirror image defined as ictal hyperperfusion contralateral to the seizure onset that is rather symmetric to the ipsilateral ictal hyperperfusion is observed in ≥50% of epilepsy patients (25). The SSM-PCA was masked not only to group membership (responders vs. nonresponders) but also to the results of visual interpretation and univariate voxel-based analysis. Thus, all images were handled equally by the SSM-PCA. In particular, no difference was made between ictal SPECT with or without mirror image. The aim of SSM-PCA is fully unbiased identification of the covariance patterns explaining the highest proportion of variance in the whole dataset reflecting between- and within-group differences with the same accuracy (9).
Ictal hyperperfusion was stronger in the contralateral than in the ipsilateral temporal lobe in 2 (11%) responders so that visual interpretation suggested the contralateral temporal lobe as SOZ (Supplemental Fig. 3). Both subjects were seizure-free for ≥36 mo after surgery. The FIPP expression score was borderline in both. Incorrect lateralization by visual interpretation of ictal perfusion SPECT in 5%–8% of patients with mesialtemporal epilepsy has been described previously (4,25–27).
None of the tested demographic, clinical, and surgical variables showed a statistically significant difference between the responders and the nonresponders in this study (Table 1). This suggests that the FIPP expression score provides independent prognostic information beyond these variables.
In clinical routine, visual evaluation and univariate voxel-based analysis of ictal perfusion SPECT are usually restricted to the localization of the SOZ. Classification of ictal perfusion patterns (beyond SOZ localization) for predicting surgery outcome is not common in clinical routine. On the other hand, the FIPP expression score alone is not useful for SOZ localization. Thus, visual analysis supported by univariate voxel-based analysis and SSM-PCA are complementary methods.
The following limitations of this study should be noted. First, the latency of tracer injection relative to the electrical seizure start differed between responders and nonresponders. Ictal perfusion patterns are dynamic and, therefore, depend on the injection time (17). To account for this, the latency of the tracer injection was considered as covariate in the conventional univariate voxel-based analysis, although the difference was rather small (median latency 10 s shorter in responders than nonresponders). The fact that the resulting statistical map (Fig. 3A) is compatible with the FIPP (Fig. 3B) suggests that a potential effect of the injection latency on the FIPP is small. Furthermore, variability of the z score maps associated with between-subject variability of the injection latency might have been captured by one (or more) covariance patterns without affecting the FIPP. Second, the FIPP was derived from z score images and therefore might not be applicable to SPECT uptake images. The transformation to z scores was used to allow pooling of 99mTc-ECD and 99mTc-HMPAO SPECT. SSM-PCA of the uptake images in the 99mTc-ECD subsample confirmed the major findings of SSM-PCA of the z score images in the whole sample (section “Identification of a prognostic covariance pattern in the 99mTc-ECD subsample” including Supplemental Table 1 and Supplemental Figs. 4 and 5). It also outperformed region-of-interest–based analyses (section “Region-of-interest based prediction in the 99mTc-ECD subsample” and Supplemental Fig. 6). SSM-PCA might also be applied directly to pooled uptake images, which probably would result in one (or more) covariance patterns covering the regional differences in tracer uptake between 99mTc-ECD and 99mTc-HMPAO. Third, rather restrictive eligibility criteria were used in this study. The use of the FIPP expression score should be restricted to ictal perfusion SPECT that fulfil the same criteria. For example, patients with brain surgery before ictal perfusion SPECT or any other major defect in tracer uptake (e.g., due to a stroke) should be excluded, because the defect might have a relevant impact on the FIPP expression score. Further studies should evaluate the FIPP expression score in independent patient samples and compare it with visual classification by experienced readers.
CONCLUSION
This study identified a covariance pattern in ictal perfusion SPECT whose expression provided independent information for the prediction of complete seizure freedom after TLE surgery. This favorable ictal perfusion pattern (FIPP) resembled the typical ictal perfusion pattern in mesial temporal epilepsy. The expression of the FIPP is easily computed for new ictal SPECT images and, therefore, might be used to support the decision for or against TLE surgery in clinical patient care.
DISCLOSURE
No potential conflict of interest relevant to this article was reported.
KEY POINTS
QUESTION: This study used the scaled subprofile model for unbiased identification of a covariance pattern in ictal brain perfusion SPECT for predicting the outcome of TLE surgery.
PERTINENT FINDINGS: The identified favorable ictal perfusion pattern resembled the typical ictal perfusion pattern in temporomesial epilepsy. The expression score of the pattern provided an area of 0.744 (95% CI, 0.577–0.911; P = 0.004) under the ROC curve for predicting seizure freedom 12 mo after surgery.
IMPLICATIONS FOR PATIENT CARE: The expression score of the favorable ictal perfusion pattern is easily computed automatically for new ictal SPECT images and, therefore, might be used to support the decision for or against TLE surgery in clinical patient care.
Footnotes
Published online Sep. 30, 2021.
- © 2022 by the Society of Nuclear Medicine and Molecular Imaging.
REFERENCES
- Received for publication June 7, 2021.
- Revision received September 9, 2021.
In this issue


Jump to section
Related Articles
Cited By...
- No citing articles found.