


Abstract
Detectors with depth-encoding allow a PET scanner to simultaneously achieve high sensitivity and high spatial resolution. Methods: A prototype PET scanner, consisting of depth-encoding detectors constructed by dual-ended readout of lutetium oxyorthosilicate (LSO) arrays with 2 position-sensitive avalanche photodiodes (PSAPDs), was developed. The scanner comprised 2 detector plates, each with 4 detector modules, and the LSO arrays consisted of 7 × 7 elements, with a crystal size of 0.9225 × 0.9225 × 20 mm and a pitch of 1.0 mm. The active area of the PSAPDs was 8 × 8 mm. The performance of individual detector modules was characterized. A line-source phantom and a hot-rod phantom were imaged on the prototype scanner in 2 different scanner configurations. The images were reconstructed using 20, 10, 5, 2, and 1 depth-of-interaction (DOI) bins to demonstrate the effects of DOI resolution on reconstructed image resolution and visual image quality. Results: The flood histograms measured from the sum of both PSAPD signals were only weakly depth-dependent, and excellent crystal identification was obtained at all depths. The flood histograms improved as the detector temperature decreased. DOI resolution and energy resolution improved significantly as the temperature decreased from 20°C to 10°C but improved only slightly with a subsequent temperature decrease to 0°C. A full width at half maximum (FWHM) DOI resolution of 2 mm and an FWHM energy resolution of 15% were obtained at a temperature of 10°C. Phantom studies showed that DOI measurements significantly improved the reconstructed image resolution. In the first scanner configuration (parallel detector planes), the image resolution at the center of the field of view was 0.9-mm FWHM with 20 DOI bins and 1.6-mm FWHM with 1 DOI bin. In the second scanner configuration (detector planes at a 40° angle), the image resolution at the center of the field of view was 1.0-mm FWHM with 20 DOI bins and was not measurable when using only 1 bin. Conclusion: PET scanners based on this detector design offer the prospect of high and uniform spatial resolution (crystal size, ∼1 mm; DOI resolution, ∼2 mm), high sensitivity (20-mm-thick detectors), and compact size (DOI encoding permits detectors to be tightly packed around the subject and minimizes number of detectors needed).
Over the past decade, many small-animal PET scanners have been developed (1–12), and this technology has played a very important role in the rapidly growing field of molecular imaging. High sensitivity is needed to increase signal-to-noise ratio of the images to reliably detect lower levels of radiotracer uptake and to reduce the injected dose (reducing radiation dose to the subject) (13) and scan time (increasing temporal resolution for dynamic studies). High spatial resolution is required to detect small structures and lesions and to improve quantification by reducing the partial-volume effect. A compromise between sensitivity and spatial resolution due to depth-of-interaction (DOI) effects always exists in small-animal PET scanner design. Most designs use a large detector ring radius (relative to the subject to be studied) or a short crystal length to reduce the DOI effects to acceptable levels. But in both cases, the sensitivity of the scanner is sacrificed.
Much attention in recent years has focused on detector designs with depth-encoding ability. Multilayer detectors consisting of crystal layers with different scintillation light decay times (14–16), comprising different reflector arrangements (17,18), and using a position shift of half a crystal for different layers (19) have been proposed and successfully implemented to measure DOI. The DOI resolution obtained by these methods is limited by the number of layers that can be decoded and is typically 5–10 mm. To eliminate the DOI effect completely, the DOI resolution needs to be about the width of the detector itself. For small-animal PET, the detector widths are typically 0.5–2 mm (8,10,20,21). Therefore, although these designs help reduce DOI-related degradation of spatial resolution, they are still not good enough to allow detectors to be placed close to the subject. Thus, the classic trade-off between resolution and sensitivity remains, with scanners using thinner detectors and larger ring diameters than wanted. The larger ring diameter also has the undesirable effect of increasing the cost per unit sensitivity.
It is therefore important to develop detectors for small-animal PET with DOI resolution that approaches the detector width. A promising approach for obtaining higher DOI resolution is to read out the scintillation light by placing photodetectors at both ends of the crystal array and use the ratio of the 2 photodetector signals to measure the DOI (22–26). An alternative approach being used to estimate DOI for monolithic scintillator crystals measures the distribution of the scintillation light signal on a position-sensitive photodetector array (27,28). In this case, events occurring nearer the photodetector produce a narrower spread of scintillation light on the detectors than events occurring farther from the photodetector, thus providing a foundation for discriminating on the basis of depth. Both of these approaches provide continuous DOI measurement rather than the discrete DOI information supplied by the layered approach described earlier.
Our approach is to measure DOI by using a dual-ended readout of finely pixelated lutetium oxyorthosilicate (LSO) arrays with 2 position-sensitive avalanche photodiodes (PSAPDs) (29–31). Our previous results on individual detector modules have shown that with such a detector at room temperature, crystals arrays as small as 1 mm could be resolved and that an energy resolution of about 15% full width at half maximum (FWHM) and a uniform DOI resolution of 3- to 4-mm FWHM (including the radiation beam width of more than 2 mm) could be achieved (32). In this work, the imaging performance of a prototype PET scanner consisting of 8 detector modules arranged in 2 detector plates is evaluated. First, results obtained from individual detectors used within the scanner, including measurements of the flood histograms calculated by using the energy signals from just 1 PSAPD or both PSAPDs, the performance of the detectors at different temperatures, DOI resolution measured with a smaller radiation beam width of 0.7 mm, and the timing resolution of the PSAPD, are presented. Second, imaging studies are performed with the prototype scanner to measure the effect of the DOI information on reconstructed image resolution.
MATERIALS AND METHODS
The Prototype PET Scanner
A schematic view of the prototype PET scanner is shown in Figure 1. The scanner consists of 2 detector plates, each comprising 4 detector modules. The LSO arrays have 7 × 7 elements, with each crystal measuring 0.9225 × 0.9225 × 20 mm on a pitch of 1.0 mm. The intercrystal reflector (Vikuiti-enhanced specular reflector film; 3M) is 65 μm thick and is glued to the crystals. The LSO arrays were read out by 2 8 × 8 mm PSAPDs placed at opposite ends of the array. Four detector modules and their preamplifier boards were mounted on a frame, which was fixed in a light-tight box. The black boxes were cooled by dry nitrogen gas passed through liquid nitrogen to obtain a stable temperature that could be varied from room temperature down to −20°C. The temperature variation during a phantom scan was controlled to be less than ±1°C by monitoring the temperature of the detector boxes using T-type thermocouple probes and adjusting the flux of the nitrogen gas. Preamplifier boards were designed for the PSAPDs and used a preamplifier (CR-110; Cremat Inc.). Commercially available timing filter amplifiers, constant-fraction discriminators, coincidence modules, and spectroscopy amplifiers were used for this scanner. Multiplexer boards were designed to reduce the number of energy signals coming from each detector plate from 32 to 8 (33). Finally, the 16 position-encoding energy signals that define an event (4 signals per PSAPD, 2 PSAPDs per detector module, 2 detector modules per coincidence) along with digital signals encoding the coincidence detector pair identification were stored in the list-mode data using a data-acquisition system developed in our laboratory (34). For tomographic imaging studies, the 2 detector plates were held stationary and projection data were obtained by rotating the object (phantom) with a stepping motor (model M061-LS-579, Superior Electric).
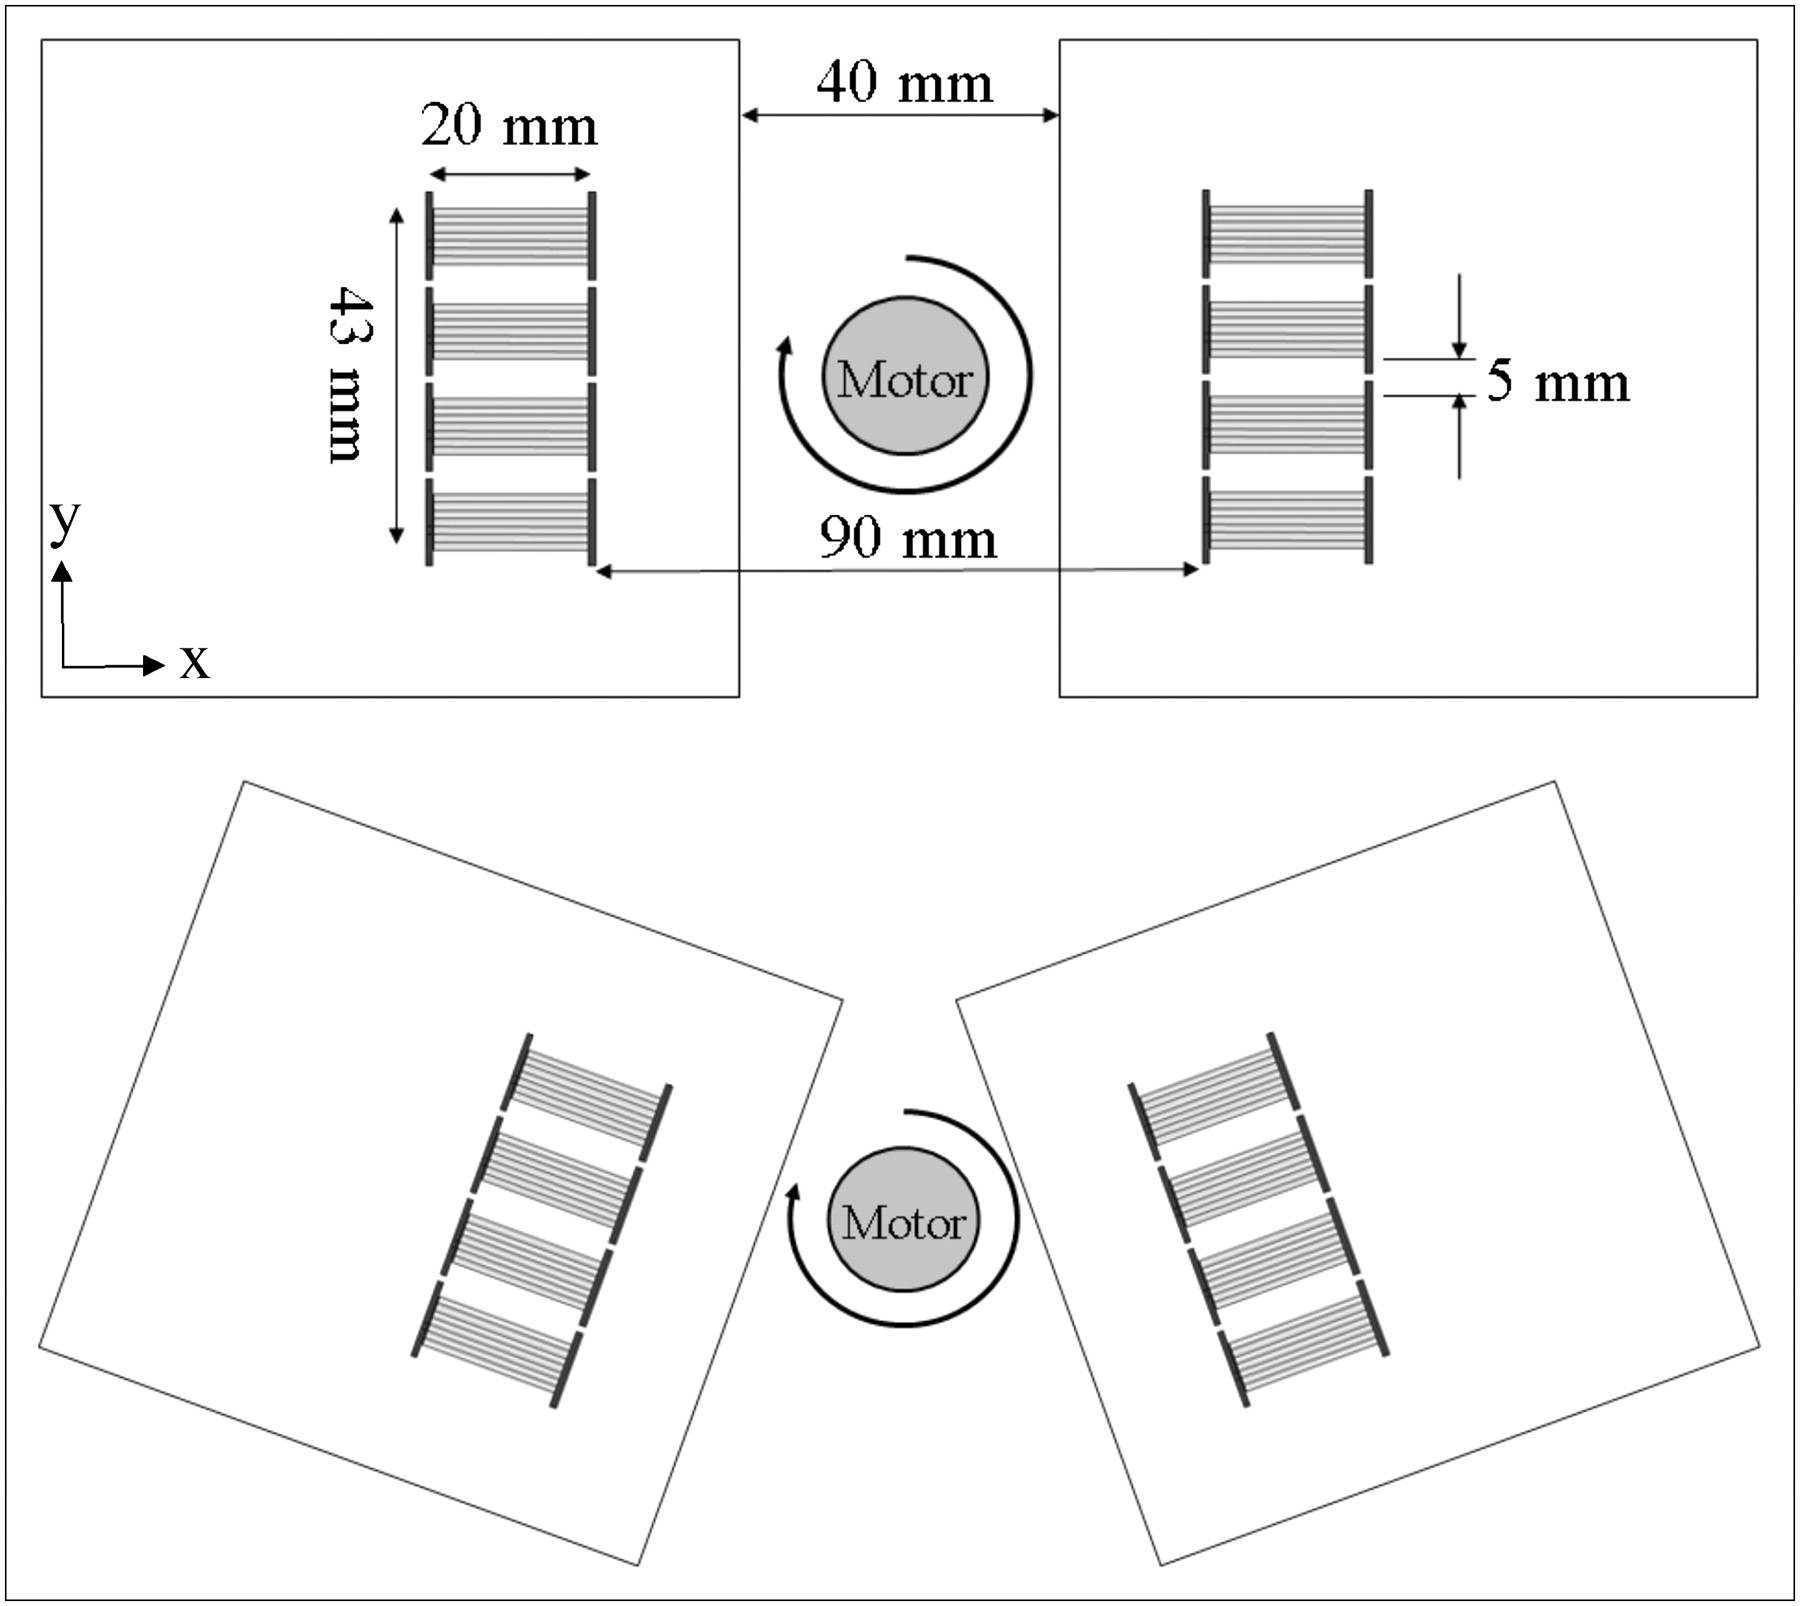
Schematic view of prototype PET scanner: configuration 1 (top) and configuration 2 (bottom).
Individual Detector Module Measurements
A single-detector module was mounted in the scanner black box and measured with the setup previously published (Fig. 1 in the article by Yang et al. (32)). In singles mode, the detector module was uniformly radiated from 1 side by a 0.5-mm-diameter point 22Na source; in coincidence mode, 1 depth of the array was selectively radiated by electronic collimation with an LSO slab detector measuring 16 × 16 × 2 mm. The slab detector was read out with a photomultiplier tube (PMT) (R590; Hamamatsu). The measurements were performed at temperatures of 0°C, 10°C, and 20°C with both a distance from the point source to the slab detector and a distance from the source to the LSO array of 5 cm. On the basis of the geometry, the radiation beam width on the array was 2 mm. The temperature was measured in a location close to PSAPD 2. To minimize the contribution of the radiation beam width to the DOI resolution, the measurements at 10°C were also performed with the distance from the point source to the slab detector measuring about 4 times that of the distance from the source to the LSO array. The radiation beam width estimated from the geometry was 0.7 mm in those measurements. This geometry was not used for all measurements, as data collection takes a long time for the more constrained geometry and only 3 rows of the crystals were irradiated. In all cases, coincidence measurements were performed at 5 irradiation depths of 2, 6, 10, 14, and 18 mm measured from the location of PSAPD 1.
Flood Histograms and Energy Resolution
The x- and y-coordinates of the flood histograms for PSAPD 1 and PSAPD 2 and the combination of the signal from both PSAPDs were calculated using the position-encoding energy signals of the 2 PSAPDs and the following equations:

 Here A1, B1, C1, and D1 are the 4 position-encoding energy signals from PSAPD 1, and A2, B2, C2, and D2 are the 4 position-encoding energy signals from PSAPD 2. The origin of the PSAPD coordinate system was defined as the A corner. The B and C corners of the PSAPDs were defined as the positive x-direction, and the C and D corners were defined as the positive y-direction. E1 and E2 are the total energy measured by PSAPD 1 and PSAPD 2, respectively, and are calculated from the following equations:
 For dual-ended readout, the total detected energy (Etotal) was taken to be the sum of the energy measured by the 2 PSAPDs (Etotal = k × E1+ E2). k is a gain-matching parameter. For each detector module, k is adjusted such that the DOI response of the whole array is centered at a DOI ratio (E2/Etotal) of 0.5. Crystal look-up tables were created from the flood histograms calculated from the combination of the 2 PSAPD signals and used to obtain the energy spectrum (Etotal) for each individual crystal. The FWHM energy resolution of the 511-keV photopeak was calculated by using gaussian fitting.
DOI Resolution
The parameter E2/Etotal was used to represent the DOI. Histograms of the values of this ratio for individual crystals and for all crystals in an array were obtained from the coincidence measurements performed at each irradiation depth. The FWHM DOI resolution was calculated by using a gaussian fitting of the DOI histograms. The FWHM DOI resolution was then calibrated to units of millimeters by using the relationship between the peak of the measured DOI ratio and the known irradiation depth information (32).
Timing Resolution
The timing resolution of the dual-ended readout detector module and the LSO slab detector was also measured at 5 irradiation depths of 2, 6, 10, 14, and 18 mm. The LSO array was a 5 × 5 unpolished array with a crystal size of 1.5 × 1.5 × 20 mm. Standard nuclear instrumentation module electronics were used for the timing-resolution measurements (23,35). The timing signal (the difference of the single PMT timing and the summed timing signal obtained from the 2 PSAPDs) was stored in list mode together with the position-encoding energy signals of the PSAPDs. By applying a crystal look-up table and individual crystal low-energy thresholds (350 keV), the timing spectra of individual crystals at each irradiation depth were obtained. The FWHM timing resolution was calculated by gaussian fitting of the timing distribution.
Phantom Imaging
A line-source phantom and a hot-rod phantom (Ultra-Micro Hot Spot Phantom; Data Spectrum Corp.) were imaged on the prototype scanner in 2 different scanner configurations. In the first configuration, the 2 detector plates were opposite and parallel to each other as shown in Figure 1 (top). In the second configuration (Fig. 1, bottom), 1 detector plate was rotated clockwise by 20° and the other one was rotated counterclockwise by 20° to simulate oblique angles of incidence that would be seen in a complete ring scanner. The geometric center of the 4 detector modules was fixed during the detector plate rotations. The line-source phantom consisted of 3 needles (100-μm inner diameter; 200-μm outside diameter; 50-mm length). The radial offsets of the 3 needles were 0, 7.5, and 15 mm. The hot-rod diameters were 0.75, 1.0, 1.35, 1.70, 2.0, and 2.4 mm, with a rod-to-rod distance of twice the rod diameter. The phantoms were rotated through 40 projection angles covering 180° during the scans. The total number of counts in each projection was fixed during the scans. A plane-source phantom measuring 48 × 20 × 5 mm was used for the detector normalization scan. Only 1 projection dataset, with the plane source placed parallel to the y-direction as defined in Figure 1, was obtained in each of the 2 scanner configurations. Detailed information for all 6 scans is listed in Table 1. All scans were performed with the temperature of the detector enclosures at approximately −5°C. Crystal look-up tables for all 8 detectors were generated from flood histograms obtained from the phantom scan data. In addition, linear DOI calibration parameters were obtained for all 8 detectors from histograms of the DOI ratio measured during the phantom scans. A lower energy threshold of 250 keV was used in selecting the data, which were sorted into 20, 10, 5, 2, and 1 (no DOI) DOI bins to demonstrate the effects of DOI “resolution” on image quality. List-mode data were histogrammed into sinograms of 120 view angles over 180° and 192 radial samples at a 0.25-mm sampling distance. All events were assigned to the center of the corresponding DOI bin. Because of the fine sampling distance, there were sinogram bins that did not receive enough counts, which can cause severe streaking artifacts if not handled properly. To solve this problem, we considered all the sinogram bins with fewer counts than 1/20th of the maximum counts in the normalization file as “poorly sampled.” For all phantom scans, the values of the poorly sampled sinogram bins were set to zero and later filled in by linear interpolation of neighboring nonzero bins after normalization. The value of the threshold in the experiments was 625, which corresponds to a maximum error of 4% in the normalization sinogram. The images were reconstructed by filtered backprojection with a Shepp-Logan filter, cut off at 1.0 and 0.5 of the Nyquist frequency for the line-source phantom and hot-rod phantom, respectively.
Starting Activity, Number of Projection Views, and Counts per Projection for Phantom and Normalization Scans
RESULTS
Flood Histograms
Figure 2 shows the flood histograms calculated by using the position-encoding energy signals from PSAPD 1, PSAPD 2, and the combination of both PSAPDs. The flood histograms obtained using just 1 PSAPD were strongly depth-dependent. The flood histograms degraded, and the dynamic range was reduced as the interaction point moved farther from the PSAPD. The edge crystals could not be well resolved in the flood histogram of the whole array. Several different crystal look-up tables are required for crystal identification if the flood histograms of only 1 PSAPD are used. The combined flood histograms from the 2 PSAPDs were very good at all depths, and no significant depth dependence of the flood histograms was observed. In the flood histogram of the whole array, all crystals could be clearly resolved. Therefore, flood histograms obtained using signals combined from both PSAPDs are used from this point forward.

Flood histograms as function of irradiation depth calculated by using position-encoding energy signals from PSAPD 1, PSAPD 2, and both PSAPDs.
Effect of Temperature on Detector Performance
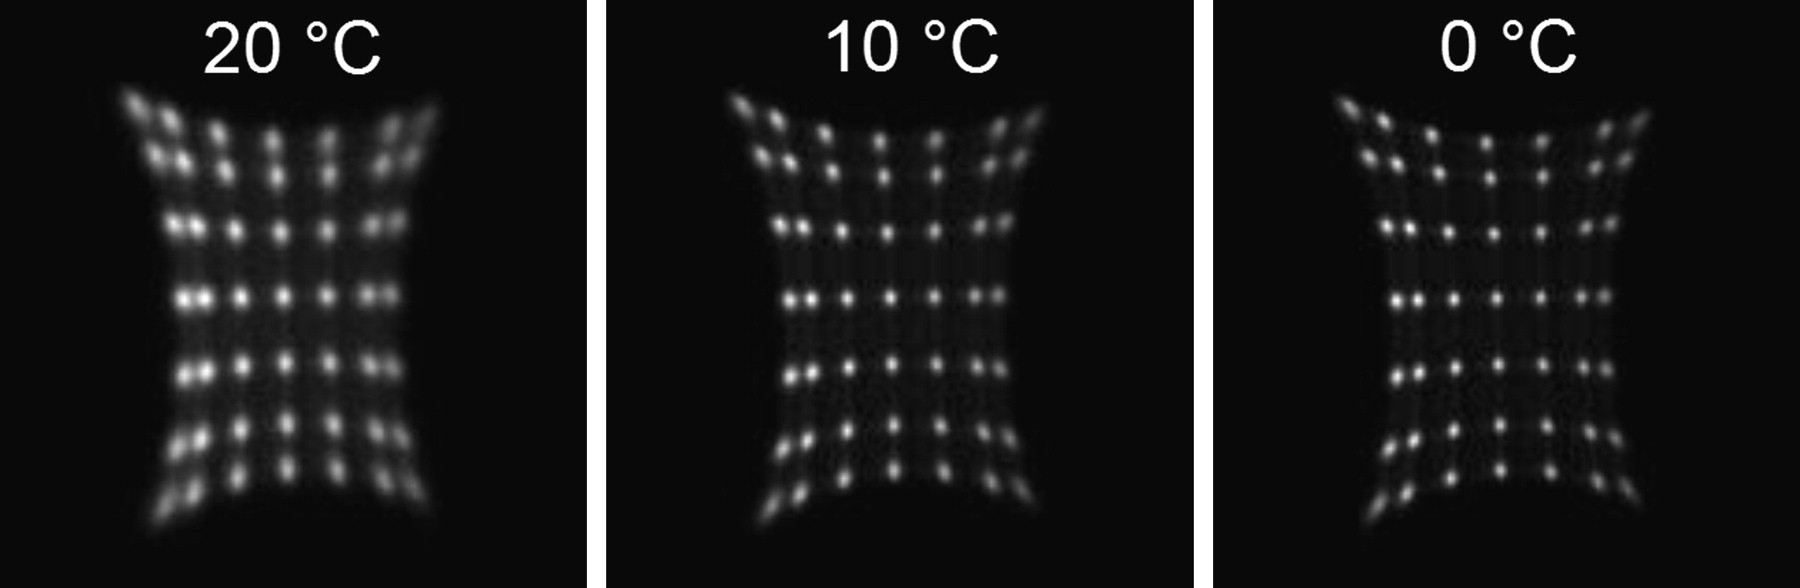
Because a PSAPD is a semiconductor device, its noise decreases as the temperature decreases. Figure 3 shows the flood histograms, and Table 2 shows the energy and DOI resolutions, measured at 0°C, 10°C, and 20°C. The energy and DOI resolutions presented are the average across all depths and all crystals. The radiation beam width was 2 mm for the DOI resolution measurement. Qualitatively, the flood histograms are seen to improve as the temperature was decreased because of the reduction of the PSAPD noise. Energy and DOI resolutions improved as the temperature was decreased from 20°C to 10°C, but no significant improvements were observed as the temperature was further decreased from 10°C to 0°C.

Flood histograms of whole array measured at 3 temperatures.
Average Crystal Energy (FWHM) and DOI Resolutions (FWHM) Measured at 3 Different Temperatures
DOI Resolution
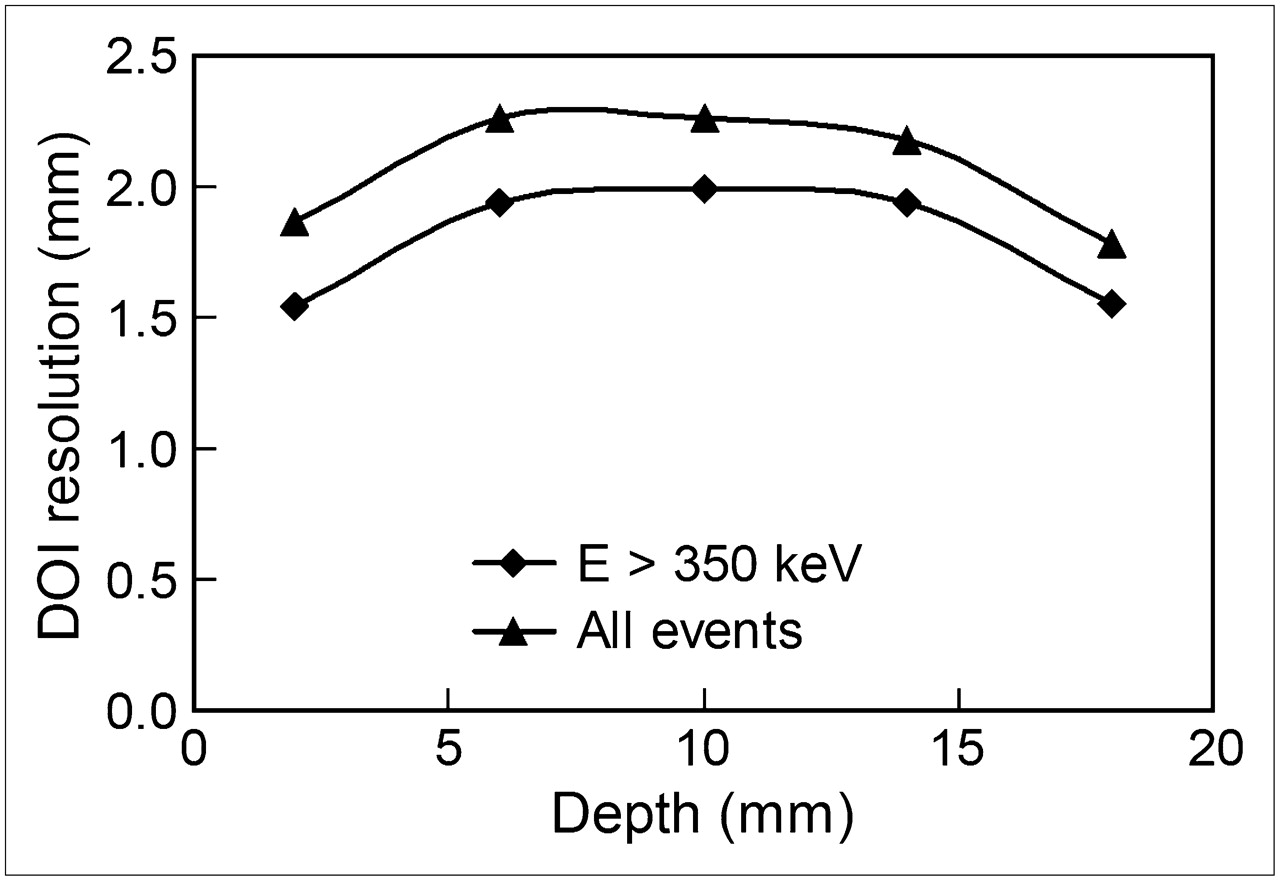
In DOI measurements with a narrow (0.7 mm) radiation beam width, only the 3 middle rows of crystals were in coincidence with the slab detector. Figure 4 shows the average DOI resolution of the 21 crystals in the 3 middle rows at different depths obtained from the DOI profiles of individual crystals. The DOI resolution at the middle of the array was worse than that at both ends. Table 3 shows the average DOI resolution obtained from the DOI profiles of individual crystals and the summed DOI profiles of all 21 crystals for events of different energies. The DOI resolution obtained from the summed profiles was degraded by less than 10%, suggesting that it is not necessary to do DOI calibration for each individual crystal in an array. An average DOI resolution of about 2-mm FWHM was obtained. In agreement with our previous results (32), the DOI ratio was observed to vary in an approximately linear fashion with the irradiation depth (data not shown), allowing simple linear approaches to be used to calibrate the DOI ratio as a function of irradiation depth as described later.

Dependence of DOI resolution (FWHM) on depth. Results are average of all crystals and obtained from DOI profiles of individual crystals.
Average DOI Resolution (FWHM) over All Crystals and Depths for Different Energy Windows
Timing Resolution
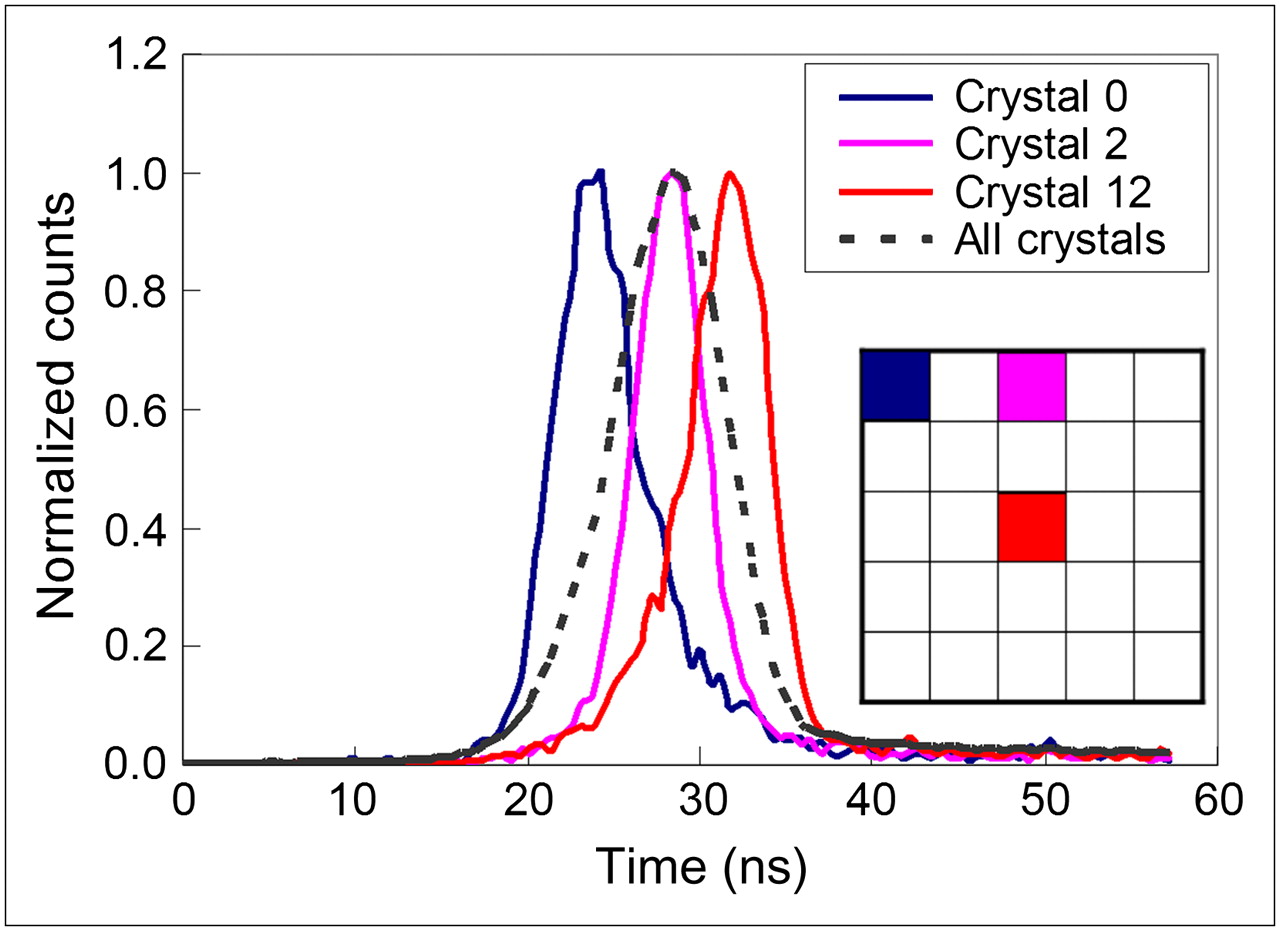
Figure 5 shows the timing spectra for 3 crystals at different locations within the LSO array and the whole detector module (all 25 crystals) measured at a depth of 10 mm from both PSAPDs. Table 4 summarizes the timing-resolution measurement results. The average crystal timing resolution was 5.5 ns FWHM. A time shift was also observed for crystals at different locations in the array. The maximum time shift for signals from the center and corner crystals is as high as 12.5 ns. This position-dependent delay is caused by the resistive readout that is used by the PSAPDs to provide position information. The charge collection time was observed to be longer for crystals over the middle of the PSAPDs than for those over the corner of the PSAPDs. The timing resolution of the whole detector module degraded to about 9 ns FWHM because of the position-dependent time shift. The timing resolution of the whole array was slightly better for irradiation depths at the middle than for irradiation depths at either end of the array. Because our current electronics cannot support crystal-by-crystal time alignment, a coincidence timing window of 40 ns was used for the prototype scanner to ensure that events from all crystal pairs were captured.

Timing spectra of 3 different crystals and all 25 crystals in 5 × 5 LSO array. Note time shift in spectra, with largest difference being between central crystal and corner crystal.
Results of PSAPD Timing Resolution Measurements
Phantom Imaging
Figure 6 shows the flood histograms of all 8 detectors in the prototype scanner obtained from 1 phantom scan. No difference was observed in the flood histograms obtained from each detector for the 6 different phantom scans, which were acquired over an interval of several weeks. Crystal look-up tables for all detectors were created from the flood histograms obtained from the normalization phantom scan (scanner configuration 1) and applied to all other studies.
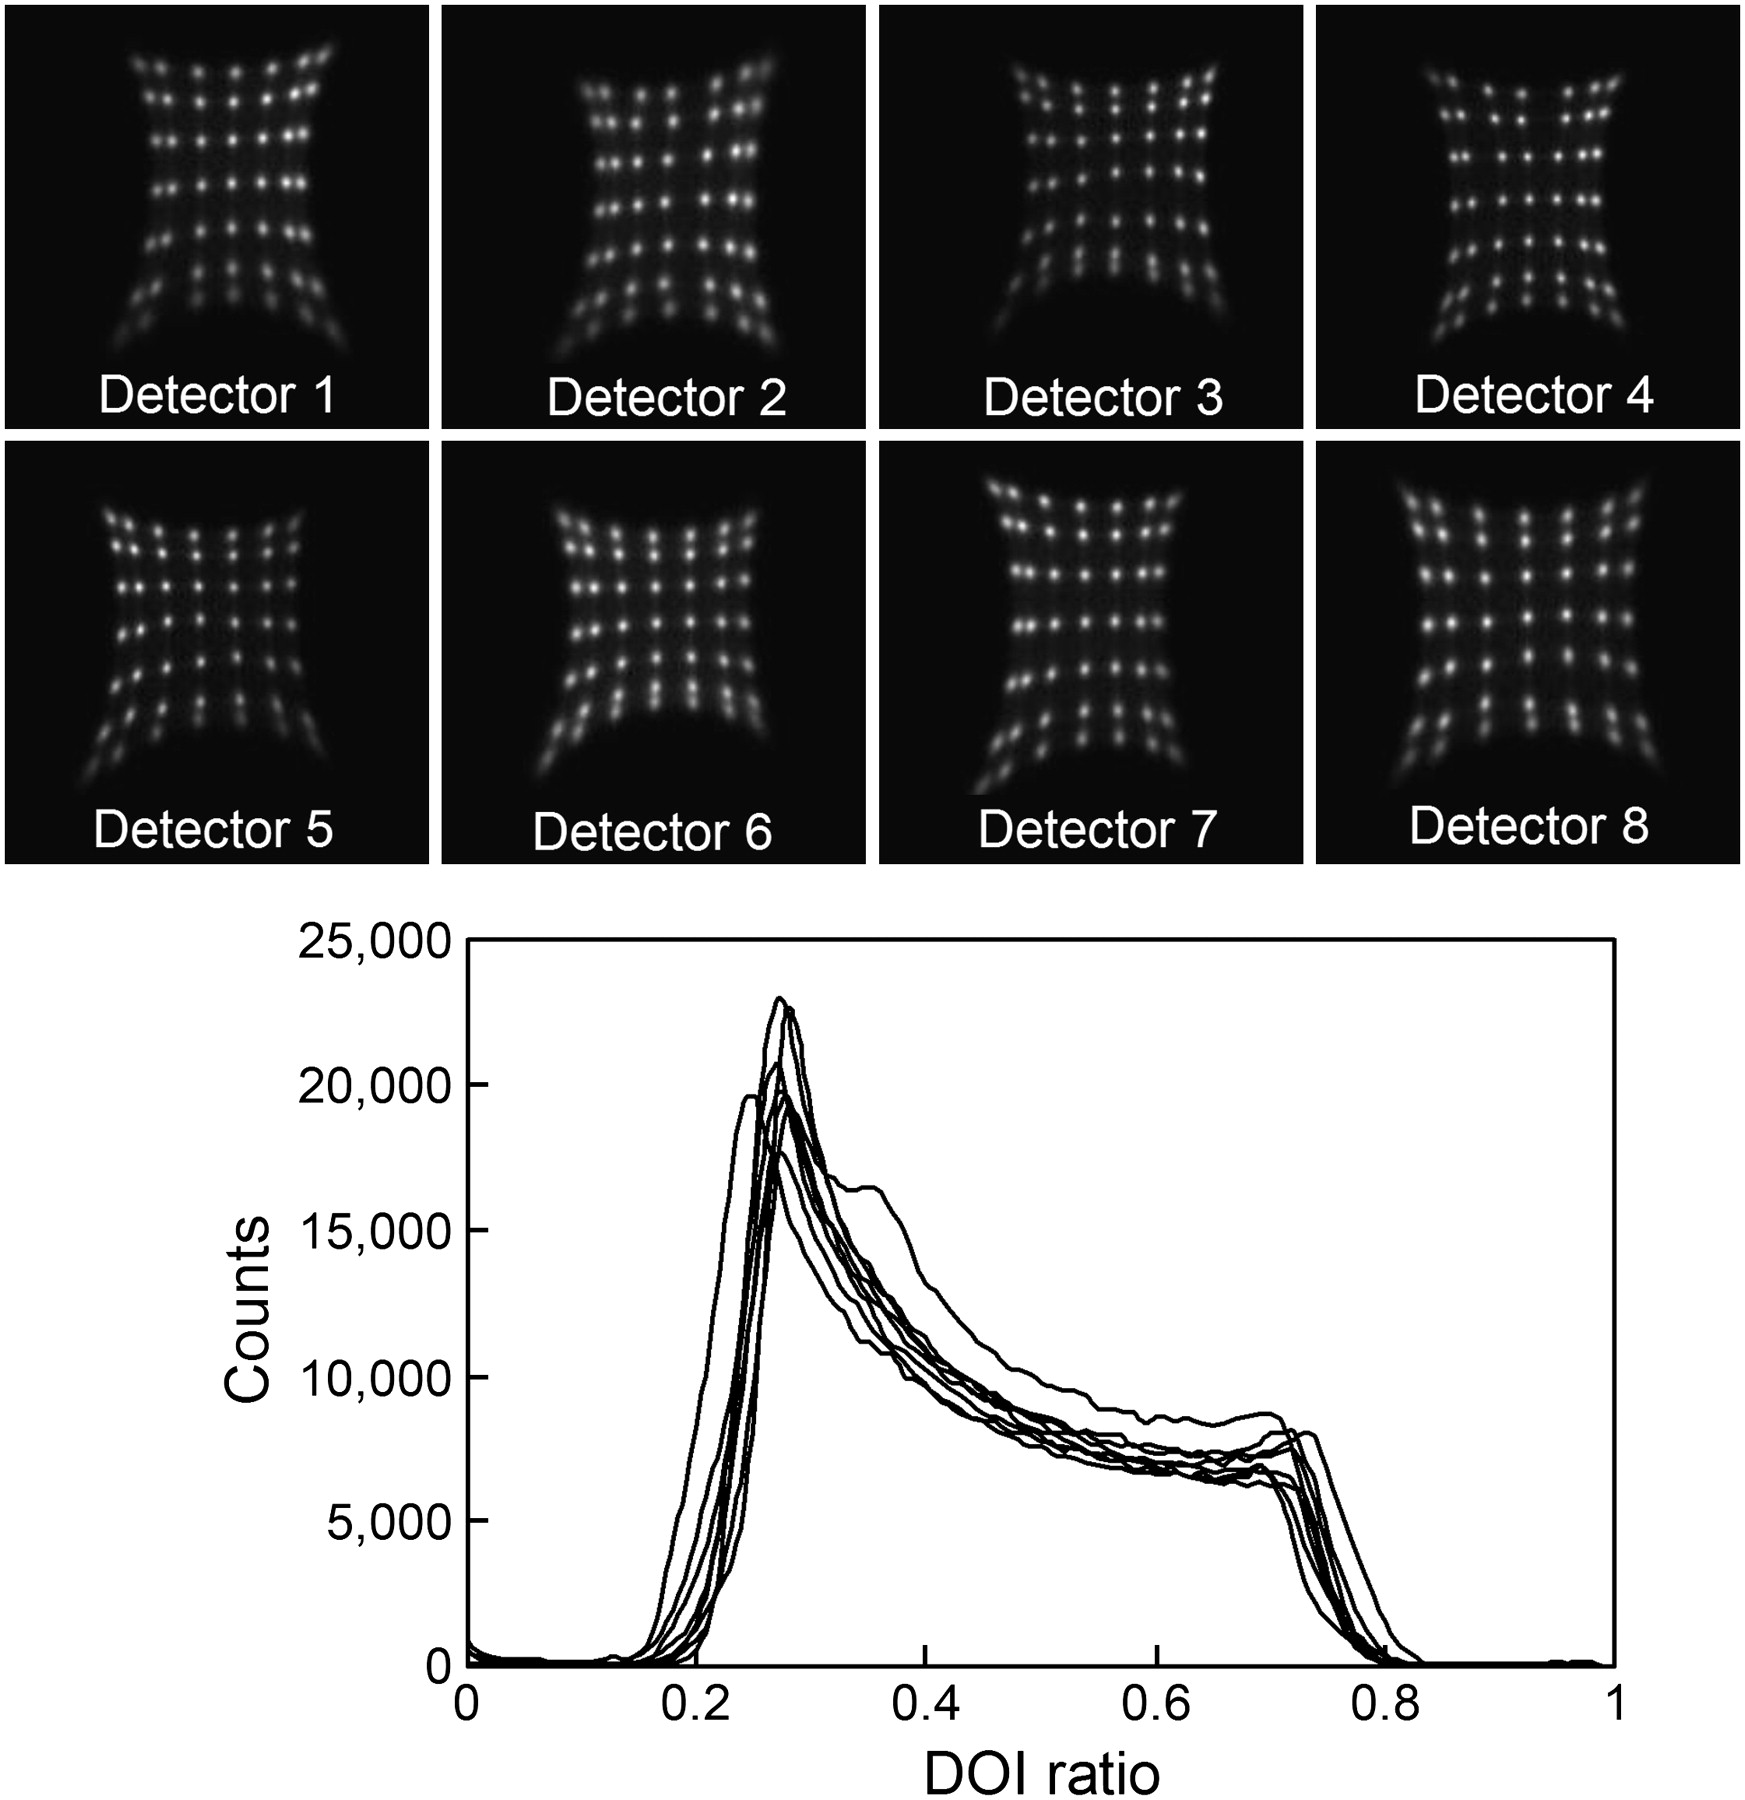
Flood histograms and DOI responses of all 8 detectors obtained from phantom scan.
Figure 6 also shows the DOI response of all 8 detectors obtained from the normalization phantom scan (scanner configuration 1). Because the detector is being irradiated from the front, an exponential falloff in the number of detected events from the front to the back of the detector exists. The measured DOI ratio at half of the maximum counts on the left- and right-hand sides of the curves was treated as corresponding to irradiation depths of 0 and 20 mm, respectively. DOI calibration parameters were then obtained from these DOI response curves simply by linear interpolation between the measured DOI ratio at the 2 ends. Events with calibrated depths of less than 0 mm or greater than 20 mm were positioned at 0 and 20 mm, respectively. Based on the results of the previous section, DOI calibrations were performed for each individual detector rather than for each individual crystal. For different phantom scans, slightly different DOI responses, which are mainly caused by temperature variations in the detector boxes, were observed for some detectors. The gain-matching parameter k was adjusted whenever it was necessary. DOI calibration parameters obtained from the normalization scan of the first scanner configuration were used for all 6 scans.
Figure 7 shows the images of the line-source phantom and hot-rod phantom acquired with scanner configuration 1 (Fig. 1, top) using 20, 10, 5, 2, and 1 DOI bins. Because the measured DOI resolution of the detectors is 2-mm FWHM, the 5 different DOI bins correspond to DOI resolutions of about 2, 3, 4, 10, and 20 mm. Table 5 shows the image resolution of the 3 line sources acquired with scanner configuration 1. The effects of DOI resolution on the reconstructed images are clearly observed. With a DOI resolution of about 2-mm FWHM, hot rods with a diameter of 0.75 mm were resolved. Without use of DOI information (1 DOI bin), rods with a diameter of 1.7 mm were barely resolved. Figure 7 also shows the images of the line-source phantom and hot-rod phantom acquired with scanner configuration 2 (Fig. 1, bottom), in which the average obliquity of the lines of response is increased. Only 2 of the 3 line sources in the line-source phantom were filled with activity for this scan. Table 6 shows the image resolution of the 2 line sources acquired with scanner configuration 2. For scanner configuration 2, much bigger DOI effects were observed as expected. With a DOI resolution of 2-mm FWHM, rods with a 1-mm diameter were clearly resolved. Without DOI information, even the largest rods with a diameter of 2.4 mm could not be resolved, because the effective detector size is about 6.8 mm.

Images of line-source phantom and hot-rod phantom reconstructed with 20, 10, 5, 2, and 1 DOI bins, respectively. Images were acquired with 2 different scanner configurations as shown in Figure 1. Images were reconstructed by filtered backprojection with Shepp-Logan filter cutoff at Nyquist frequency for line-source phantom and 0.5 of Nyquist frequency for hot-rod phantom. Rod diameters in hot-rod phantom are 0.75, 1.0, 1.35, 1.70, 2.0, and 2.4 mm with rod-to-rod distance of twice rod diameter. Note improvement in sharpness of reconstructed images with increasing number of DOI bins.
FWHM Image Resolution of Line-Source Phantom Reconstructed with 20, 10, 5, 2, and 1 DOI Bins
FWHM Image Resolution of Line-Source Phantom Reconstructed with 20, 10, 5, 2, and 1 DOI Bins
DISCUSSION
As shown previously (32), light loss along the crystal length is essential for high-resolution DOI measurement with dual-ended readout. In this work, unpolished LSO arrays were used to provide a strong depth dependence in the scintillation light reaching the 2 ends of the array. This depth dependence also was reflected in the flood histogram measured by 1 PSAPD. The flood histogram degraded as the irradiation depth from the PSAPD increased because less light reached the PSAPD. The reflectivity of the reflector used to make the array is not 100%, so there was also an increase in light cross talk as the irradiation depth was increased relative to the PSAPD location. The dynamic range of the flood histogram calculated using Anger logic was therefore reduced as the irradiation depth was increased. Fortunately the light loss along the length of the crystal is roughly linear, and the cross talk and the total light reaching the 2 array ends are roughly constant; thus, the flood histograms calculated from a combination of the signals from both PSAPDs do not exhibit any strong depth dependence and are of high quality for all irradiation depths.
The signal-to-noise ratio of the PSAPDs decreased as the temperature was increased. The identifiability of crystals in the flood histograms was improved with cooling; however, the positions (centroids) of the crystals in the flood histograms did not change. Therefore, temperature variations do not affect the crystal look-up table. The gain changes of the 2 PSAPDs with temperature are slightly different; therefore, temperature changes do result in small variations in the DOI responses. Temperature variations also affected the detector-energy resolution because the gain of the PSAPDs decreased as the temperature was increased. A stable temperature is preferred for these dual-ended readout detector modules. Although our results showed that the PSAPDs work well at room temperature (32), the temperature of the detector box becomes much higher than room temperature when several PSAPDs, preamplifiers, and other electronics parts are enclosed. To ensure low and stable temperature, the detector boxes were cooled, and the temperature variation of the detector boxes was controlled to be less than ±1°C during imaging. Although the temperature in the box is monitored, the precise temperature within the PSAPDs themselves is not known.
A timing shift of up to 12.5 ns was observed for crystals at the center and corner of the PSAPD. This shift results primarily from the resistive readout properties of the PSAPDs, which cause a position dependence in the charge collection time. This is not a fatal drawback, as most commercial PET scanner electronics have the capability to perform crystal-by-crystal time alignment, which could then correct these timing shifts. The measured crystal timing resolution of the PSAPDs (5.5 ns) is much worse than that achieved with PMTs (typically a few hundred picoseconds to 2 ns). However, this timing resolution would be acceptable for a PET scanner for mouse imaging, where the injected dose is typically less than 7.4 MBq and therefore the rate of accidental coincidences is low.
The effects of DOI resolution on the visual image quality was studied by using different numbers of DOI bins. For scanner configuration 1, the images obtained with 2 DOI bins were much worse than images obtained with 20, 10, and 5 DOI bins. Only a slight difference was seen for the images obtained with 20, 10, and 5 DOI bins, suggesting that a DOI resolution of 4-mm FWHM was sufficient for this scanner configuration. Much bigger DOI effects were observed in the second scanner configuration. A DOI resolution of better than 3-mm FWHM was required to obtain images where DOI effects were negligible. The DOI resolution of our detectors averages approximately 2-mm FWHM, and this seems to be sufficient to accurately reconstruct data, even from geometries that deliberately exacerbate the DOI problem (scanner configuration 2).
Work is ongoing to reduce the inactive area at the edge of the PSAPD, to allow better packing of adjacent detector modules. Currently, the physical size of the packaged PSAPD is 11 × 12.5 mm, and the active area is 8 × 8 mm. In these studies, only the central 7 × 7 mm of the PSAPD is coupled to the LSO arrays. We plan to reduce the physical size of the PSAPDs to 9 × 9 mm and use the whole active area of 8 × 8 mm for final implementation in a multiring scanner. This will be necessary to fully exploit the efficiency benefit of these 2-cm-thick LSO detectors compared with that of the 1-cm-thick detectors used in many commercial animal PET scanners (the coincidence detection efficiencies of 2-cm- and 1-cm-thick LSO detectors at 511 keV are 68% and 34%, respectively).
A question exists as to whether the PSAPDs can work stably for a long time in a scanner. All 16 PSAPDs have already worked in this prototype scanner for more than 6 mo, suggesting that the technology is robust enough for use in an imaging system. Another PET system using PSAPDs but without DOI capability has been in operation for more than a year and has been used for a range of animal studies (35).
CONCLUSION
A prototype PET scanner using detector modules consisting of dual-ended readout of pixelated LSO arrays with 2 PSAPDs was constructed and tested. Measurements performed on individual detector modules showed that a DOI resolution of 2-mm FWHM and an energy resolution of 15% FWHM could be obtained and that all crystals could be clearly resolved in the measured flood histograms of arrays with submillimeter crystal size. Imaging studies performed on the prototype scanner showed that DOI measurements significantly improved the reconstructed spatial resolution. Depth-encoding PET detectors consisting of submillimeter LSO arrays (high spatial resolution) with a 2-cm total thickness of LSO (high efficiency) could provide flood histograms in which all crystals can be identified, DOI and energy resolution are good, and timing resolution is acceptable. This approach is therefore promising for future preclinical PET scanner designs desired to simultaneously achieve high spatial resolution and high sensitivity.
Acknowledgments
We thank Dr. Ciprian Catana for many useful discussions. This work was funded by NIH grant R01 EB006109 and by small business innovation research funding from National Institute of Biomedical Imaging and BioEngineering.
Footnotes
-
COPYRIGHT © 2008 by the Society of Nuclear Medicine, Inc.
References
- Received for publication December 11, 2007.
- Accepted for publication February 28, 2008.


