


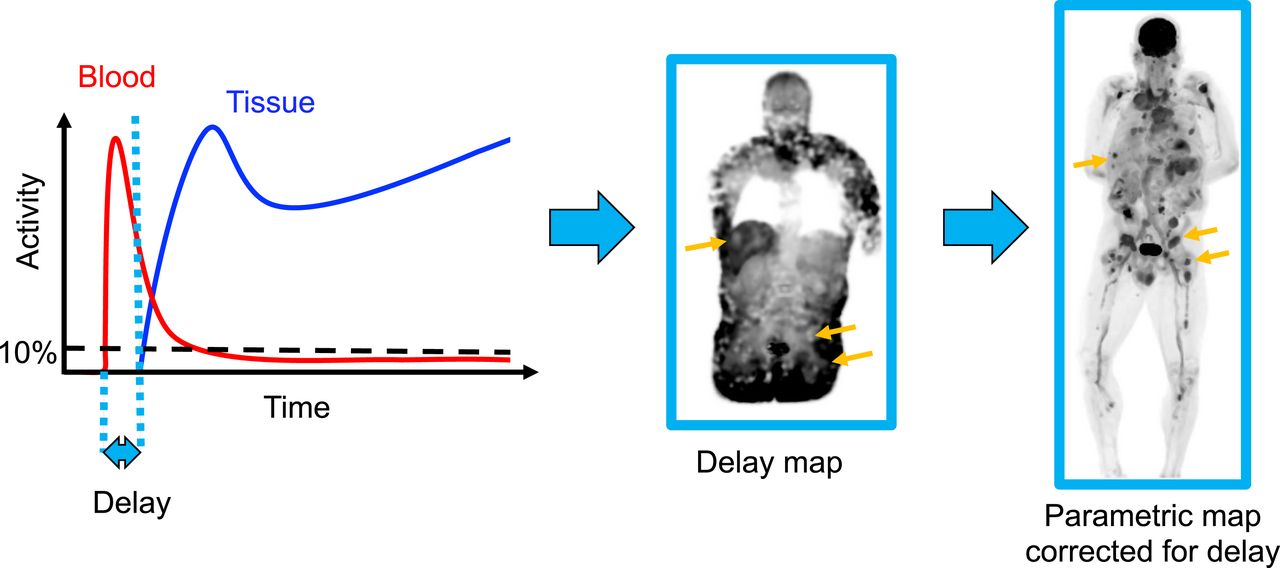
Visual Abstract
Abstract
Quantitative kinetic modeling requires an input function. A noninvasive image-derived input function (IDIF) can be obtained from dynamic PET images. However, a robust IDIF location (e.g., aorta) may be far from a tissue of interest, particularly in total-body PET, introducing a time delay between the IDIF and the tissue. The standard practice of joint estimation (JE) of delay, along with model fitting, is computationally expensive. To improve the efficiency of delay correction for total-body PET parametric imaging, this study investigated the use of pulse timing methods to estimate and correct for delay. Methods: Simulation studies were performed with a range of delay values, frame lengths, and noise levels to test the tolerance of 2 pulse timing methods—leading edge (LE) and constant fraction discrimination and their thresholds. The methods were then applied to data from 21 subjects (14 healthy volunteers, 7 cancer patients) who underwent a 60-min dynamic total-body 18F-FDG PET acquisition. Region-of-interest kinetic analysis was performed and parametric images were generated to compare LE and JE methods of delay correction, as well as no delay correction. Results: Simulations demonstrated that a 10% LE threshold resulted in biases and SDs at tolerable levels for all noise levels tested, with 2-s frames. Pooled region-of-interest–based results (n = 154) showed strong agreement between LE (10% threshold) and JE methods in estimating delay (Pearson r = 0.96, P < 0.001) and the kinetic parameters vb (r = 0.96, P < 0.001), Ki (r = 1.00, P < 0.001), and K1 (r = 0.97, P < 0.001). When tissues with minimal delay were excluded from pooled analyses, there were reductions in vb (69.4%) and K1 (4.8%) when delay correction was not performed. Similar results were obtained for parametric images; additionally, lesion Ki contrast was improved overall with LE and JE delay correction compared with no delay correction and Patlak analysis. Conclusion: This study demonstrated the importance of delay correction in total-body PET. LE delay correction can be an efficient surrogate for JE, requiring a fraction of the computational time and allowing for rapid delay correction across more than 106 voxels in total-body PET datasets.
An input function (IF) is required for fully quantitative PET kinetic modeling and can be derived through arterial blood sampling (1). However, arterial blood sampling is invasive and technically challenging and can introduce errors in the measured IF arrival time and bolus shape, which may result in biased kinetic parameter estimates when left uncorrected (2–4). An image-derived IF (IDIF) can be sampled from the images directly, reducing errors in arrival time and removing the external dispersion introduced by arterial blood sampling. Still, the delay between the IF peak and arrival time at a tissue or voxel of interest must be considered.
The advent of high-efficiency scanners with a long axial field of view, such as the uEXPLORER (United Imaging) total-body PET system (5,6), presents the opportunity for high signal-to-noise total-body kinetic modeling. Short frames with high count statistics are possible for improved estimation of parameters such as delay. Additionally, an IDIF can be derived from the larger vessels, where partial-volume effects are reduced. However, with total-body PET, delay correction becomes more important because the IDIF will be farther from a tissue of interest than a more localized IDIF (e.g., carotid IDIF for gray matter) and incorrect delay estimates may lead to parameter bias (2–4). Because different tissues will also have their own unique delay values, delay correction must be performed for every voxel or regional time–activity curve.
Common methods of delay correction include setting the delay to a predetermined value (2,7), adjusting the IF on the basis of an IDIF near the tissue of interest (2,8), or jointly estimating the delay during the fitting process (4,9,10). However, the widely used joint estimation (JE) method is costly in terms of computation time, especially for voxel-level total-body PET, because it involves nonlinear fitting of kinetic parameters for all possible delay values. Therefore, a much faster method for estimating bolus delay would be beneficial. Applications in which voxel-level parametric imaging is important include the detection and quantification of metastatic lesions, as well as disease processes that result in heterogeneous tracer delivery and uptake within a tissue or organ.
Here, we draw our inspiration from pulse timing methods—including the leading edge (LE) method and the constant fraction discrimination (CFD) method—that are used to efficiently determine the arrival time of electronic pulses from a radiation detector (11). In this work, LE and CFD pulse timing methods were applied to time–activity curves rather than electronic pulses. Delay was defined as td − t0, which is the difference between the arrival times of the bolus in the region chosen to define the IF (t0) and of a tissue or voxel time–activity curve determined using one of the pulse timing methods (td). Implementation of pulse timing methods would greatly reduce the computational burden of the fitting process for a given kinetic model, since the nonlinear least-squares fitting process can be performed for a single delay value, as determined by these methods. Although these methods are computationally efficient, the choice of parameters (LE trigger threshold, CFD attenuation values) can impact delay estimation. Therefore, we investigated the use of pulse timing methods for time delay estimation and correction for quantitative total-body kinetic modeling and parametric imaging.
MATERIALS AND METHODS
Simulations
Computer simulations of time–activity curve data were developed to evaluate the bias and SD of delay estimation approaches. A high-temporal-resolution IF (0.1-s sampling) representing a bolus of 18F-FDG was generated on the basis of the triexponential function proposed by Feng et al. (12,13). The IF was shifted by 100 randomly selected delay values between 0 and 50 s. Brain gray matter time–activity curves were simulated on the basis of these delayed IFs and typical kinetic parameters (vb = 0.05, K1 = 0.06 mL/min/mL, k2 = 0.07 min−1, k3 = 0.07 min−1, and k4 = 0 min−1) from Huisman et al. (14). For each delay value, 500 noisy realizations were generated using a commonly applied time-changing gaussian noise model (15) with a mean equal to the initial activity in frame m (TACm) and SD equal to the scaling factor Sc times the unscaled SD, δm: where
where  is dependent on the radioisotope decay constant λ, frame midpoint tm, frame length
  , and mean activity
  in frame m. The scale Sc was set to 4 noise levels of 0.03, 0.1, 0.2, and 0.3 to encompass time–activity curves with different statistical quality. To mimic zero-mean noise present in measured time–activity curves before bolus arrival, the activity included in
  was modified to have a mean of 0.5% of the maximum activity:
Time–activity curves were then rebinned to frame lengths of 1, 2, 5, and 10 s and used to assess the impact of framing on delay estimates. Supplemental Figure 1A shows an example time–activity curve with Sc equal to 0.1 (supplemental materials are available at http://jnm.snmjournals.org).
For the LE method (11), a trigger threshold was selected and the time at which the signal amplitude passed that threshold was recorded as the arrival time. LE thresholds were set across a wide range (2.5%–50%) of the peak activity in the first 120 s. A 10% LE threshold is shown in Supplemental Figure 1B. For the CFD method (11), the time–activity curves were shifted in time by 2 s for shorter framing, or by 1 frame for frames longer than 2 s. Attenuated and inverted versions of the time–activity curve (attenuated to between 2.5% and 50% of the peak activity) were added to the shifted time–activity curve, and the resulting zero-crossing point marked the arrival time (Supplemental Fig. 1C). LE- and CFD-based estimates for each combination of delay value, frame length, noise level, and percentage peak activity were determined. The average bias and SD of the LE and CFD delay estimates were determined by comparing the estimates with the ground truth. On the basis of the results of these simulations, only the LE method was subsequently applied to human data.
Human Data
Institutional Review Board approval and written informed consent were obtained for 14 healthy volunteers (6 male, 8 female; body mass index, 19.4–37.0 kg/m2; age range, 26–78 y) and 7 male subjects with genitourinary cancer (GUC) (body mass index, 20.1–32.0 kg/m2; age range, 56–76 y). The subjects were injected with an average dose of 357.8 MBq of 18F-FDG (range, 331.9–391.8 MBq) and underwent 60-min dynamic studies on the uEXPLORER scanner (16). Images were reconstructed with vendor-provided time-of-flight ordered-subsets expectation maximization software (20 subsets, 4 iterations, 150 × 150 × 486 image matrix size, 4-mm isotropic voxels) with corrections for attenuation, scatter, randoms, dead time, and decay (17). No point-spread function modeling was applied. For generating parametric images, image data were smoothed using a composite image prior and the kernel method (18). The following framing protocol was used to generate 66 time points: 30 × 2 s, 12 × 10 s, 6 × 30 s, 12 × 120 s, and 6 × 300 s.
For all human data, an IDIF was derived from a region of interest (ROI) in the left ventricle. Tissue compartment model selection was incorporated to account for tissue spaces where 18F-FDG undergoes minimal metabolism, such as the blood pool. Model selection was performed for a range of tissue ROIs and voxel time–activity curves by fitting a 0-tissue 1-parameter (where vb was the only nonzero parameter), a 1-tissue 3-parameter, and an irreversible 2-tissue 4-parameter model (k4 = 0); the model with the lowest Akaike information criterion was chosen. For comparison, parametric Patlak plots (19) were generated with and without using the JE delay estimates from model selection. All results were obtained using a nonlinear least-squares fitting process as described previously (20). Initialization parameters are included in Supplemental Table 1. To assess the impact of delay correction methods, delay was estimated jointly (JE), via the LE method, or not at all (no delay correction). The first 36 dynamic frames, representing the first 120 s of the acquisition, were used to jointly estimate delay before fitting all 66 time points for estimation of the rest of the parameters. For ROI-based analysis, the same LE thresholds used in simulations (between 2.5% and 50% of the peak activity in the first 2 min) were used to determine the IDIF bolus arrival time (t0) and the arrival time at the tissue (td). Both JE and LE estimates of delay (td − t0) were estimated in 1-s steps and were constrained to be between 0 and 50 s. The conventional JE method was considered ground truth, such that the optimal LE threshold could be determined across a variety of ROIs. After determining the optimal LE threshold, a single LE threshold was used for kinetic modeling, and the quality of ROI-based and parametric image–derived parameter estimates was assessed using Pearson r.
ROIs were identified in 6 tissue types (gray matter, liver, lungs, muscle, myocardium, and spleen) and in the left ventricle blood pool. An additional 28 GUC lesions were delineated on the basis of a threshold of 41% of SUVmax, as recommended by Boellaard et al. (21). All ROIs were manually corrected for subject motion. ROIs were delineated using PMOD (PMOD Technologies).
To highlight a variety of tissue types for prototyping of the method, parametric maps of delay and other kinetic parameters (vb, K1, Ki) were generated with both JE and LE methods using the entire image volumes of 1 representative healthy subject and 1 GUC subject. The tissue ROIs were used to generate tissue-specific voxelwise parameter estimates from the parametric images (Supplemental Fig. 2). A vascular ROI was also included to assess the impact of delay within the blood pool in the parametric images.
RESULTS
Simulations
Delay estimates were determined for different framing schemes and noise levels (e.g., Supplemental Fig. 1). From the wide range of LE thresholds and CFD attenuation fractions tested, LE results indicated that higher noise levels resulted in only marginal increases in bias and SD, particularly with 2-s frames and an LE threshold of less than 15%, whereas CFD bias and SD increased with higher noise levels for attenuation fractions of 15% or less (Supplemental Table 2). With 2-s frames, there was less than a 1-s bias in delay for all LE thresholds of 10% or greater, and a 30% LE threshold led to the lowest bias in delay (0.11–0.18 s, Supplemental Table 2, bold). As frame length increased from 2 to 10 s, the effect of frame length dominated the bias, particularly at higher LE thresholds and higher CFD attenuation fractions. This effect was mitigated for LE results by increasing the LE threshold to 25% or greater, which reduced bias to less than 5 s for all noise levels. With a 30% LE threshold, absolute biases for 10-s frames were between 3.80 and 3.96 s for all noise levels tested. The CFD method was not investigated further because of its poorer performance on noisy simulated data and reliance on a user-chosen time shift, traditionally based on waveform rise time (11). The LE method does not rely directly on the rise time, making it the more practical method for total-body PET human subject data. Supplemental Table 3 expands on the LE results, showing data for additional frame lengths. The impact of frame length dominated the bias estimates for large (5- and 10-s) frames; the bias estimates were within 0.5 s of each other across the different noise levels at the same LE threshold.
Although an LE threshold of 25% was the most insensitive to noise level, and a threshold of 30% resulted in the lowest biases and SD for 2-s frames, the simulations focused solely on a gray matter time–activity curve with an ideal bolus injection. Therefore, to assess the performance of the LE method on different tissue types with varying kinetics and the effect of timing walk on LE estimates in slowly rising time–activity curves (e.g., liver), a variety of LE thresholds was tested in human ROI-based analyses.
Human ROI-Based Analysis
Tissue-specific time–activity curves were consistent across organ type among subjects (Fig. 1; Supplemental Fig. 3). The subset of the 28 lesion time–activity curves shown in Figure 1 demonstrates the heterogeneity of tracer arrival time and metabolism. Since there were no noticeable differences between healthy-subject and GUC-patient time–activity curves, ROI-based parameter estimates were pooled across the 14 healthy subjects and 7 GUC patients. Average JE and LE delay estimates, with their standard errors (Figs. 2A and 2B), demonstrated the impact of slower time–activity curve rise times on the LE estimates of liver and muscle, as compared with gray matter, spleen, and GUC lesions, all of which demonstrated a sharp rising edge (Supplemental Fig. 3). On the basis of the simulation results and the timing walk, or overestimation of the delay that occurs for more slowly rising time–activity curves as LE thresholds are increased (Fig. 2B), an LE threshold of 10% was selected for further ROI-based results and implemented for parametric imaging. As shown in Figure 2C, there was good agreement between JE and LE methods in the estimation of delay (Pearson r = 0.96; P < 0.001; slope, 1.00), with a 10% LE threshold for all ROIs.

Normalized time–activity curves in several healthy-subject and GUC patient tissues. Although injection bolus shape was consistent across pooled human subjects, injection time relative to start of scan, delay in arrival time at individual tissues, and initial lesion uptake differed. Single lesion per GUC patient is shown for ease of visualization. a.u. = arbitrary units.

(A) Average JE delay estimates with SE. (B) LE estimates at thresholds ranging from 2.5% to 50% for different ROIs. As LE threshold increases, estimates of LE delay exhibit timing walk for tissues with longer rise times such as liver and muscle. On the basis of A and B, threshold of 10% was selected for further kinetic analyses. (C) Agreement between LE method and JE estimates of delay (r = 0.96; P < 0.001; slope, 1.00) with 10% threshold across all regions.
The impact of delay correction can be seen in Table 1, which shows parameter estimates obtained with and without delay correction. With LE-based delay estimation, mean parameter estimates agreed with JE results for vb (r = 0.96; P < 0.001; slope, 0.98), Ki (r = 1.00; P < 0.001; slope, 0.99), and K1 (r = 0.97; P < 0.001; slope, 0.91) when all regions were pooled (n = 154) (Table 1; Supplemental Fig. 4). When delay correction was not performed, there was little impact on Ki (r = 1.00; P < 0.001; slope, 1.02); however, vb (r = 0.86; P < 0.001; slope, 0.85) and K1 (r = 0.89, P < 0.001, slope: 0.89) were poorly estimated in some tissues, including gray matter, spleen, and GUC lesions. When tissues with negative or zero delay (myocardium, lung) were excluded from pooled analyses, Ki remained constant, whereas there was a drop in vb (69.4%) and K1 (4.8%) without delay correction (Table 1).
Estimated Kinetic Parameters Obtained from Pooled Regions
Table 2 shows the mean and SD estimates of the 42 tissue-parameter pairs. LE estimates strongly agreed with JE methods for most tissues; only 5 of 38 statistically significant comparisons had a Pearson r of less than 0.8, though the LE method did not agree with JE results in some liver and spleen ROIs when estimating vb.
Estimated Kinetic Parameters for Healthy Subjects (n = 14) and GUC Patients (n = 7)
Parametric Imaging
Voxelwise LE results were assessed using datasets from 1 representative healthy volunteer and 1 representative GUC subject. Using a high-performance computational node (Xeon Gold 2.6-GHz, 24-core processor; Intel), JE parametric images were produced at an approximate rate of 180 voxels/s, whereas LE parametric images were produced at an approximate rate of 1,200 voxels/s, representing a 6.7-fold increase in computational efficiency. Parametric results agreed with the results of ROI-based methods but were slightly overestimated for both JE (r = 0.97; P < 0.001; slope, 1.05) and LE (r = 0.99; P < 0.001; slope, 1.06) (Supplemental Fig. 5). Example delay and Ki maps are shown in Figure 3. LE-derived delay maps showed some artifacts near the injection site compared with JE delay maps, but results were broadly comparable across most tissues. Ki was similar between JE and LE and demonstrated improved Ki contrast in the liver and GUC lesions compared with Ki computed with no delay correction or via Patlak plots (Fig. 3; Supplemental Table 4). GUC-subject maximum-intensity-projection images of K1 and vb are shown in Figure 4; delay correction improved visualization of lesions in the thorax, lower torso, and legs. Like the ROI-based results in Tables 1 and 2, voxel-level delay correction resulted in improved estimation of lesion vb and K1 (Fig. 4), both of which are sensitive to the early phases of the scan.

Maximum-intensity-projection parametric images of delay and Ki for representative healthy subject (A) and GUC patient (B). Images were generated using 4 coronal slices (1.6 cm thick). Ten percent LE threshold-derived delay maps showed some differences from JE delay maps, particularly near injection site, but were broadly in agreement across rest of body. Compartment modeling–based Ki maps were similar with JE and LE methods of delay correction, and both methods resulted in improved liver signal (A, arrows) and lesion contrast (B, arrows) compared with Patlak results or compared with no delay correction.

Maximum-intensity projections of K1 and vb parametric maps for representative GUC patient. Overall, LE-derived parametric images were similar to JE-based images. Without delay correction, K1 was increased whereas vb was underestimated in much of abdomen and lower body compared with JE-based vb. Multiple GUC lesions (arrows) demonstrated increased K1 and vb when delay correction was applied, whereas vessels in legs and some lesions in upper abdomen and liver (asterisks) showed reduction in K1 and increase in vb.
Both representative subjects showed some disagreement in LE delay in the muscle and spleen relative to JE delay, though this did not greatly impact Ki or vb estimates. Scatterplots comparing JE and LE results in a representative healthy subject (Supplemental Fig. 6) demonstrated agreement in the estimation of delay (r = 0.99; P < 0.001; slope, 1.01). Estimates of vb (r = 1.00; P < 0.001; slope, 1.00) and Ki (r = 1.00; P < 0.001; slope, 0.99) agreed strongly with JE results. Although not shown, K1 LE estimates also agreed with JE but were underestimated (r = 0.97; P < 0.001; slope, 0.91).
GUC voxelwise estimates of delay were similarly in disagreement in some muscle, spleen, and lesion voxels, and overall, delay was slightly overestimated (r = 0.99; P < 0.001; slope, 1.10) (Fig. 5). There was strong agreement for vb (r = 1.00; P < 0.001; slope, 0.98) and Ki (r = 1.00; P < 0.001; slope, 1.00). Although not shown, GUC-subject K1 estimates were also in agreement (r = 0.99; P < 0.001; slope, 0.97).

Parametric LE vs. JE results for GUC patient were compared across several regions including 8 lesions (L1–L8). Delay was slightly overestimated (r = 0.99; P < 0.001; slope, 1.10) overall and was underestimated in several tissues, namely in muscle, lesions, and gray matter. LE vb (r = 1.00; P < 0.001; slope, 0.98) and Ki (r = 1.00; P < 0.001; slope, 1.00) estimates demonstrate nearly 1:1 ratios with JE.
DISCUSSION
Here we have demonstrated, at both the ROI and the voxel levels, the feasibility of using pulse timing methods (LE and CFD) as a surrogate for jointly estimating tracer delay using the first 120 s of data, across a wide range of tissue types present in total-body PET datasets. Noise, in addition to temporal framing, plays an important role in the choice of threshold in the LE method. In simulations, LE with a 10% threshold or greater provided a satisfactory delay bias and SD in short frames at most noise levels, but a 30% threshold resulted in the lowest measured bias and SD at all noise levels. However, the shape of the time–activity curve itself is important and may explain the discrepancies between simulations and acquired time–activity curves in determining the optimal LE threshold for gray matter. Further, tissues with a long rise time, such as the liver, suffer from timing walk, and spillover from the blood pool can cause early triggering. Threshold optimization may be necessary for these tissues. Since the simulation data showed no advantage from using the CFD approach, the simpler LE method was used for human studies.
After assessing regional delay estimates from various LE thresholds, we implemented a 10% threshold for all human analyses. JE and LE methods were in agreement for all estimated kinetic parameters at both the ROI and the voxel levels. vb and K1 estimates were sensitive to delay correction, whereas Ki was impacted by delay correction only in the liver and GUC lesions of the parametric images. Improved estimation of vb and K1 has implications for perfusion imaging with radiotracers with rapid kinetics (e.g., 15O-water).
The bolus shape is another important consideration; the simulation results indicated that LE methods work well, with a sharp bolus peak for the IF with respect to the frame length such that the timing walk in the tissue and IF curves is as slight as possible. Therefore, these methods are expected to be translatable to other tracers delivered via bolus injection.
Although we implemented model selection in our parametric analyses, special-case tissues (e.g., liver and lung) require additional models that consider dual IFs and dispersion, which were not implemented here but will be a part of our future work. Patient motion is another major challenge with total-body parametric imaging. Short frames capture not only respiratory and cardiac motion but also any gross motion throughout the scan. In practice, application of these methods will likely benefit greatly from incorporation of motion correction in total-body PET (22). Here, we performed simple manual correction of our ROIs and selected image datasets with limited motion for parametric analysis.
Although LE delay correction can be implemented with the Patlak analysis, delay correction has a limited impact on Patlak Ki, indicating that improved lesion contrast seen in this study was a result of implementation of compartment modeling with delay correction.
CONCLUSION
We applied pulse timing methods to dynamic PET images to estimate the arrival time of the radiotracer bolus in ROIs and in every voxel in the body. We demonstrated that pulse timing methods can be an efficient surrogate for JE. Moreover, LE and JE methods of delay correction provided Ki, vb, and K1 estimates that were in good agreement and substantially improved parametric results compared with when no delay correction was performed or compared with Patlak analysis. Further, at the voxel level, LE estimates agreed with JE across a variety of tissue types for both healthy and GUC subjects. The results suggest that delay correction should be implemented for total-body PET kinetic modeling using short (<5 s) frames, and implementing the LE method instead of JE will allow for efficient correction of delay.
DISCLOSURE
This work was supported by NIH R01 CA206187 and R35 CA197608. UC Davis has a research agreement and a sales-based revenue-sharing agreement with United Imaging Healthcare. No other potential conflict of interest relevant to this article was reported.
KEY POINTS
QUESTION: Are pulse timing methods an efficient surrogate for JE of the delay in tracer arrival time for total-body PET kinetic modeling?
PERTINENT FINDINGS: Results from regional and voxelwise studies on 14 healthy volunteers and 7 cancer patients showed strong agreement between LE and JE methods in estimating delay and the kinetic parameters vb, Ki, and K1. Improved regional estimates, as well as increased parametric image contrast of vb and K1 were observed when delay correction was performed.
IMPLICATIONS FOR PATIENT CARE: This study demonstrated the importance of delay correction in total-body PET kinetic modeling and that LE delay correction can be a computationally efficient surrogate for JE, making the methods more translatable for patient studies.
ACKNOWLEDGMENTS
We thank the EXPLORER team members and technologists for their contributions to this work.
Footnotes
Published online Dec. 21, 2021.
- © 2022 by the Society of Nuclear Medicine and Molecular Imaging.
REFERENCES
- Received for publication July 27, 2021.
- Accepted for publication December 14, 2021.


