


Abstract
Multiple myeloma (MM) is an incurable plasma cell malignancy of the bone marrow. MM has 3 components: diffuse marrow infiltration, focal bone lesions, and soft-tissue (extramedullary) disease. The hallmark biomarker in blood or urine is a monoclonal immunoglobulin, the monoclonal protein. Waldenstrom macroglobulinemia is a similar disease with secretion of IgM. Staging is classically performed with the 1975 Durie–Salmon system, which includes conventional radiographs. Recently updated, the Durie–Salmon Plus staging system includes CT, MRI, and 18F-FDG PET/CT. The hallmark radiographic lesion of symptomatic MM is a well-demarcated, focal osteolytic bone lesion. The number of focal bone lesions correlates inversely with outcome. Extramedullary disease is typically an aggressive, poorly differentiated form of MM that confers inferior outcome, with median survival of less than 1 y if present at diagnosis. Achievement of a complete response on 18F-FDG PET before stem-cell transplantation correlates with a superior outcome.
Multiple myeloma (MM) is an incurable malignancy characterized by clonal proliferation of plasma cells in the bone marrow microenvironment. MM is typically characterized by secretion of a monoclonal protein (M-protein), detected in the blood or urine, and by associated end organ disease, including the hallmark sharply defined lytic bone lesions present in 85% of patients with MM. MM typically evolves from an asymptomatic, premalignant condition called monoclonal gammopathy of undetermined significance (MGUS), with M-protein detected in blood or urine in a multistep process involving complex genetic mutations and bone marrow microenvironmental interactions. There is no end organ damage in MGUS or in a more progressed condition called smoldering MM. Accordingly, MGUS and smoldering MM are usually not treated, but there are investigational chemoprevention trials attempting to halt the progression to symptomatic MM. In smoldering MM, bone marrow biopsy shows a 10%–60% diffuse infiltration of plasma cells, and the infiltration is less than 10% in MGUS. Although MM can arise de novo, it usually progresses in a stepwise fashion from MGUS or smoldering MM. If marrow infiltration with plasma cells exceeds 60%, or if end organ damage is present, the patient is diagnosed with active MM (1,2).
MM is the second most common hematologic malignancy, representing 1% of all cancers and 13% of hematologic malignancies. In Western countries, the annual incidence is 5.6 cases/100,000 people. Median age at diagnosis is 70 y, with 37% younger than 65 y and 37% 75 y old or older. In recent years, with a combination of autologous stem-cell transplantation and modern chemotherapy, the 10-y survival of patients presenting at an age less than 60 y is approximately 30% (1,2).
Imaging of MM and related diseases includes anatomy-based modalities (conventional radiography and CT), conventional or whole-body MRI, and functional imaging (PET/CT or 99mTc-sestimibi imaging (3)). The whole-body radiographic series is the metastatic bone survey (MBS). Clinical imaging of MM and related diseases with PET/CT uses 18F-labeled FDG, with other PET radiopharmaceuticals still investigational. 99mTc-sestimibi imaging using planar imaging, SPECT, or SPECT/CT is useful, particularly when 18F-FDG PET/CT is not available (4–6). The classic imaging finding in MM is one or more focal osteolytic lesions seen on radiographs (Fig. 1) or CT, but there is also a systemic bone loss leading to diffuse osteopenia or osteoporosis (7,8).

Stable focal osteolytic bone lesions of skull and right humerus in a patient with MM in complete remission for 5 y. Lateral skull (left) and humeral shaft (right) radiographs of the patient demonstrate multiple focal osteolytic lesions (some with arrows) that will never heal even if patient remains in complete remission for many years.
MM bone loss is due to complex interactions between the tumor and the bone marrow microenvironment leading to both osteoclastic stimulation and inhibition of osteoblastic function. This tumor-induced diffuse bone loss compounds the treatment-induced bone loss from frequent use of high-dose glucocorticoid medications (typically dexamethasone), leading to severe osteoporosis. Much of the morbidity in MM results from insufficiency fractures from the profound bone loss seen in MM. Because the dickkopf 1 protein secreted by MM destroys the osteoblast progenitors (Fig. 2), focal osteolytic bone lesions from MM never heal (7,9).
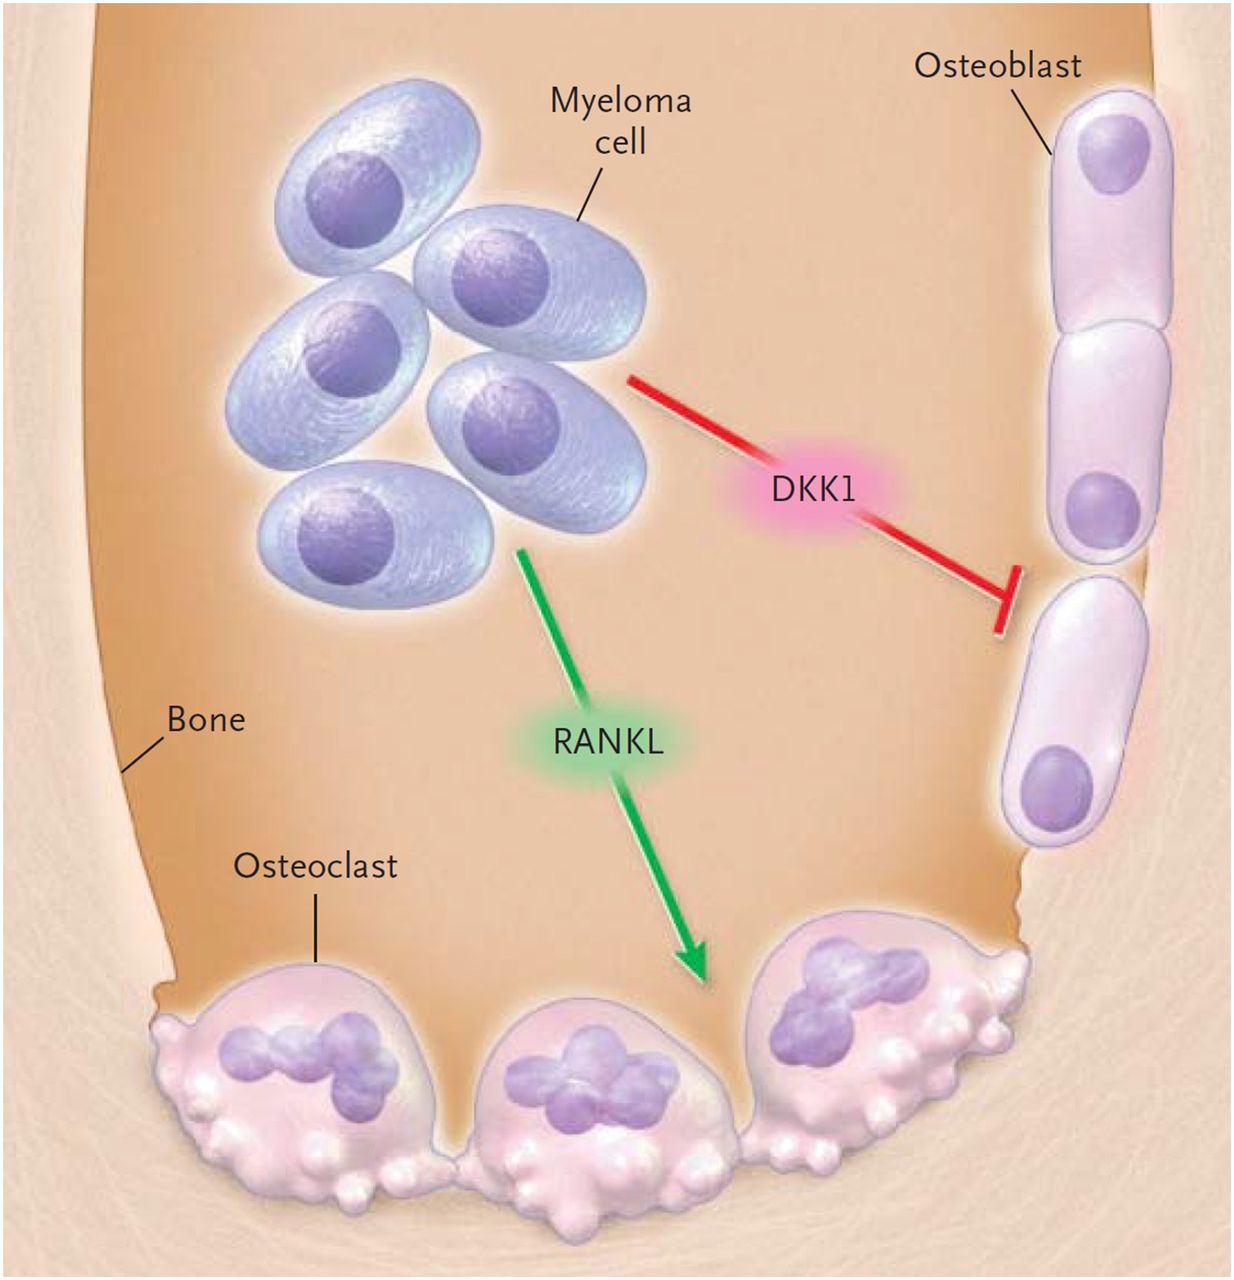
Dual mechanisms of bone loss in MM. Myeloma cells release RANK ligand (RANKL), stimulating osteoclasts, and dickkopf 1 (DKK1), a protein that inhibits osteoblastic function and leads to loss of osteoblastic differentiation and destruction of osteoblast-lineage stem cells, resulting in lytic bone lesions that cannot heal. (Reprinted with permission of (9).)
Diffuse marrow infiltration with plasma cells in MM is often accompanied by focal lesions, with or without focal osteolysis. Active focal lesions of MM are well-circumscribed areas of increased uptake on PET or abnormal signal on MRI that an experienced imaging provider interprets as most likely to represent tumor. To avoid excessive false-positives, a finding must be at least 5 mm in diameter to be considered a focal lesion (10).
A minority of patients at diagnosis will have normal imaging findings. The presence of one or more focal lesions with 10% or greater plasma cell marrow infiltration establishes symptomatic MM. More than one skeletal focal lesion without marrow infiltration identifies a variant of MM called multiple solitary plasmacytomas, in which image-guided biopsy of focal lesions is key to diagnosis (11–14).
About 5% of patients at presentation are thought to have solitary plasmacytoma of soft tissue or bone, though many are actually under-staged MM patients. Central marrow biopsy or additional imaging with MRI or 18F-FDG PET/CT will often demonstrate additional sites of tumor, leading to a correct diagnosis. Correct diagnosis is essential for proper treatment since patients with a solitary lesion seldom require systemic treatment (14–20).
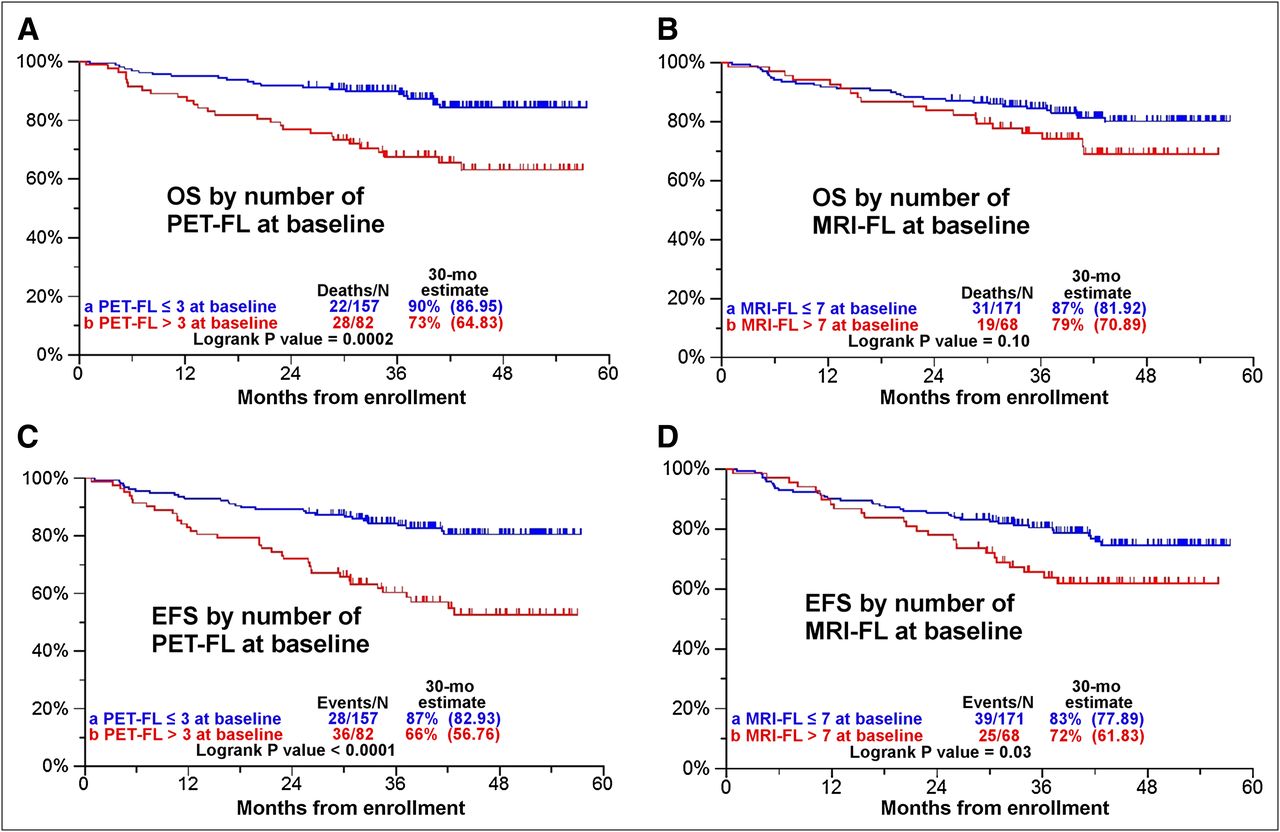
The number of focal lesions at baseline on radiographs, MRI, or 18F-FDG PET/CT is a key finding, inversely and significantly related to both overall and event-free survival (21). The number of focal lesions at baseline on MRI is also inversely and significantly related to event-free survival but not to overall survival (10). The adverse impact on patients of the number of focal lesions at baseline (3 or more on 18F-FDG PET/CT and 7 or more on MRI) is second only to the presence of high-risk disease as identified by gene expression profiling (Fig. 3) (10,21).

Kaplan–Meier analysis of significance of number of PET focal lesions and MRI focal lesions at baseline on overall survival (OS) and event-free survival (EFS). Three or more PET focal lesions (PET-FL) at baseline staging significantly impact OS (A) and EFS (C). On MRI, 7 or more focal lesions (MRI-FL) at baseline staging significantly impact EFS (D) but not OS (B). These data are derived from clinical trial Total Therapy 3. Number of focal lesions for analysis of PET vs. MRI was chosen for greatest significance. (Reprinted with permission from (21).)
Imaging reports for MM should include the number of MRI or PET focal lesions and the presence and approximate number of x-ray focal osteolytic lesions seen on the CT portion of PET/CT (some patients have too many focal lesions to accurately quantify). Untreated MRI or PET focal lesions will result in focal osteolytic bone lesions. PET/CT is superior to PET-only imaging (Fig. 4) because of the direct anatomic correlation that PET/CT provides for an area of focal 18F-FDG uptake (10,22,23). Though an increase in focal lesion size indicates progression of disease, it is the number of focal lesions on MRI or PET, not the size, that correlates inversely with patient outcome. Perhaps the number of focal lesions is a surrogate for tumor heterogeneity and thus is related to the risk for the development of treatment resistance (24,25). Discordant MRI and PET/CT results must be investigated (26). Direct comparison of current examinations to prior examinations is required because the number of focal lesions can remain the same or even decrease and yet new focal lesions can develop, identifying progression or relapse.

18F-FDG PET/CT detects progression of MGUS to MM. Anterior 3-dimensional maximum-intensity-projection images performed at time of diagnosis of MGUS (A) and 30 mo later (B) demonstrate progression to MM, with 2 PET focal lesions (arrows) representing intramedullary lesions without corresponding radiographic lytic lesion and thus invisible by MBS. Axial CT portion of PET/CT through upper right femur at level of superior lesion at baseline (C) shows normal fatty marrow; at 30-mo follow-up (D), focal intramedullary plasmacytoma nodule is visible (arrows).
When tumor progression or relapse on MRI or PET/CT is suspected, standard laboratory evidence is usually supportive and no further verification is required. Restaging of patients with 18F-FDG PET/CT is best done 2 and preferably 4 or more weeks after treatment cycle completion. However, if progression or relapse while on treatment is suspected, 18F-FDG PET/CT can often provide verification and direction for biopsy or change in treatment (27–30).
EXTRAMEDULLARY DISEASE (EMD)
Identification of EMD, tumor growing exclusively in the soft tissues independent of the bone marrow, is vital because its presence identifies a patient at high risk compared with similar-stage patients without EMD. EMD represents an MM entity that is typically poorly differentiated, often nonsecretory, rapidly progressive, and treatment-resistant. Because many MM treatments target the MM–bone marrow microenvironment interaction, these treatments will be ineffective in treating EMD. Median survival for relapsing or refractory patients with EMD at baseline is less than 1 y.
It is important to differentiate between breakout lesions and true EMD. Breakout lesions are regions where the tumor has broken through the cortex into the surrounding soft tissues, but with the tumor still in contact with and dependent on the tumor–bone marrow interactions. Both EMD and breakout lesions can be detected with MRI, PET/CT, or 99mTc-sestimibi imaging. PET/CT and 99mTc-sestimibi are superior to MRI because of their wider, whole-body fields of view compared with conventional MRI examination, though whole-body MRI may be of equal efficacy. EMD (Fig. 5) develops with increasing frequency with the duration of the disease (3,10,21,31–33).
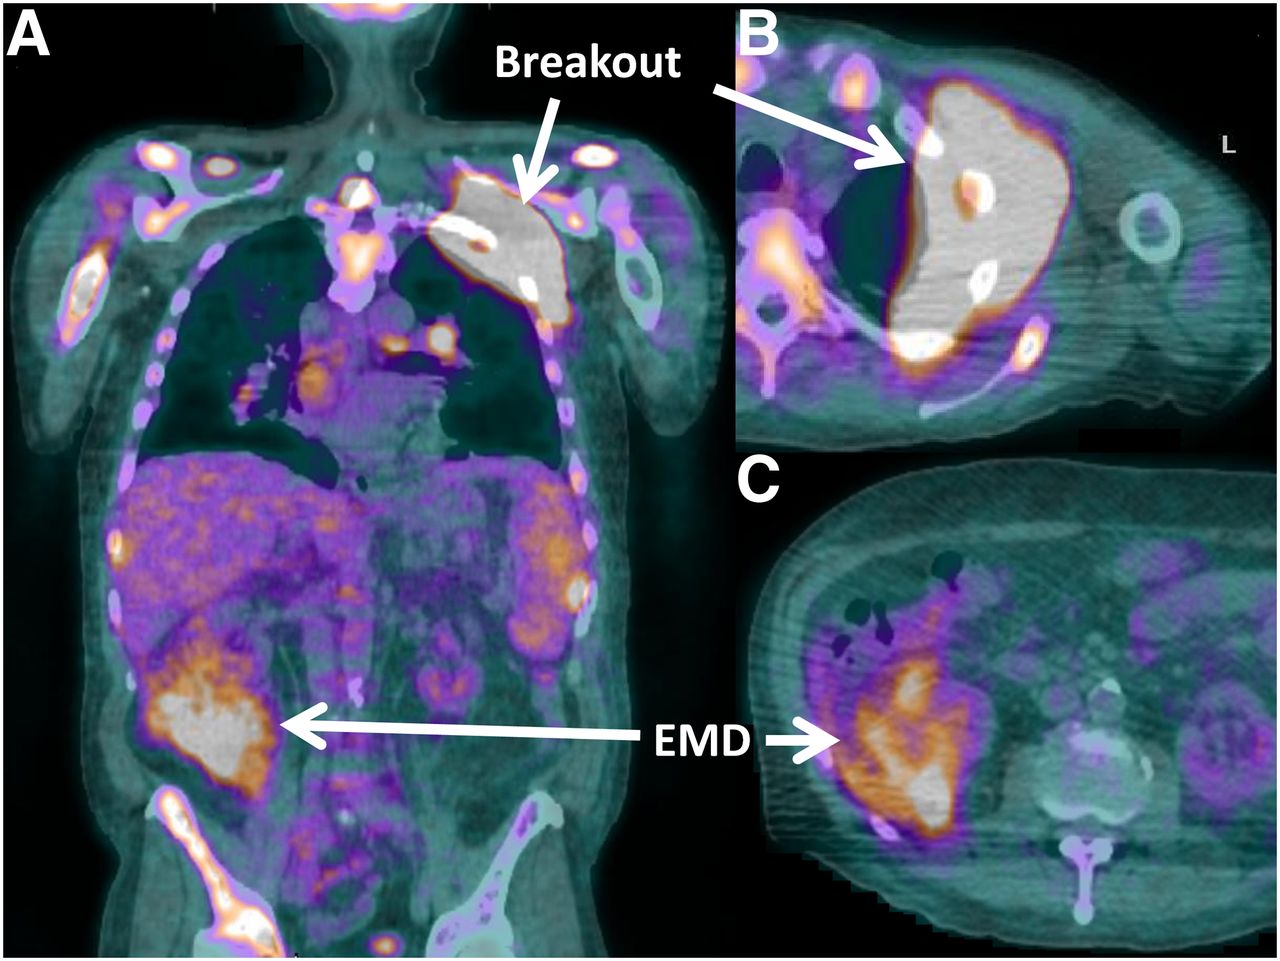
Breakout vs. EMD. Fused coronal (A) and axial (B and C) 18F-FDG PET/CT images in patient with advanced MM demonstrate a breakout lesion in the upper left chest, arising from the upper left rib, still in contact with and dependent on the bone marrow microenvironment. The right perinephric area demonstrates a focus of biopsy-proven, exclusively soft-tissue, MM (true EMD).
HYPOSECRETORY AND NONSECRETORY DISEASE
Most patients with MM demonstrate secretion of the hallmark M-protein. However, in 1%–5% of patients at diagnosis, disease is classified as hypo- or nonsecretory, with no or very low levels of M-protein detected (34,35). Most of these patients will have elevated levels of κ or λ free light chains (light chain fragments of immunoglobulins). When patients with M-protein or elevated free light chains are excluded, less than 1% of MM patients are truly nonsecretory at diagnosis (35,36). In these nonsecretory patients, measuring treatment response is difficult because serial M-protein or free light chain levels cannot be followed. The percentage of patients with nonsecretory disease increases with the duration of survival and, when observed, typically reflects dedifferentiation of the tumor to a more aggressive form. In nonsecretory patients, imaging with 18F-FDG PET/CT is particularly useful for monitoring disease status and treatment response. MRI is also useful in this setting for detection of relapse or progression but not treatment response (10,37–40).
OSTEOSCLEROTIC MYELOMA
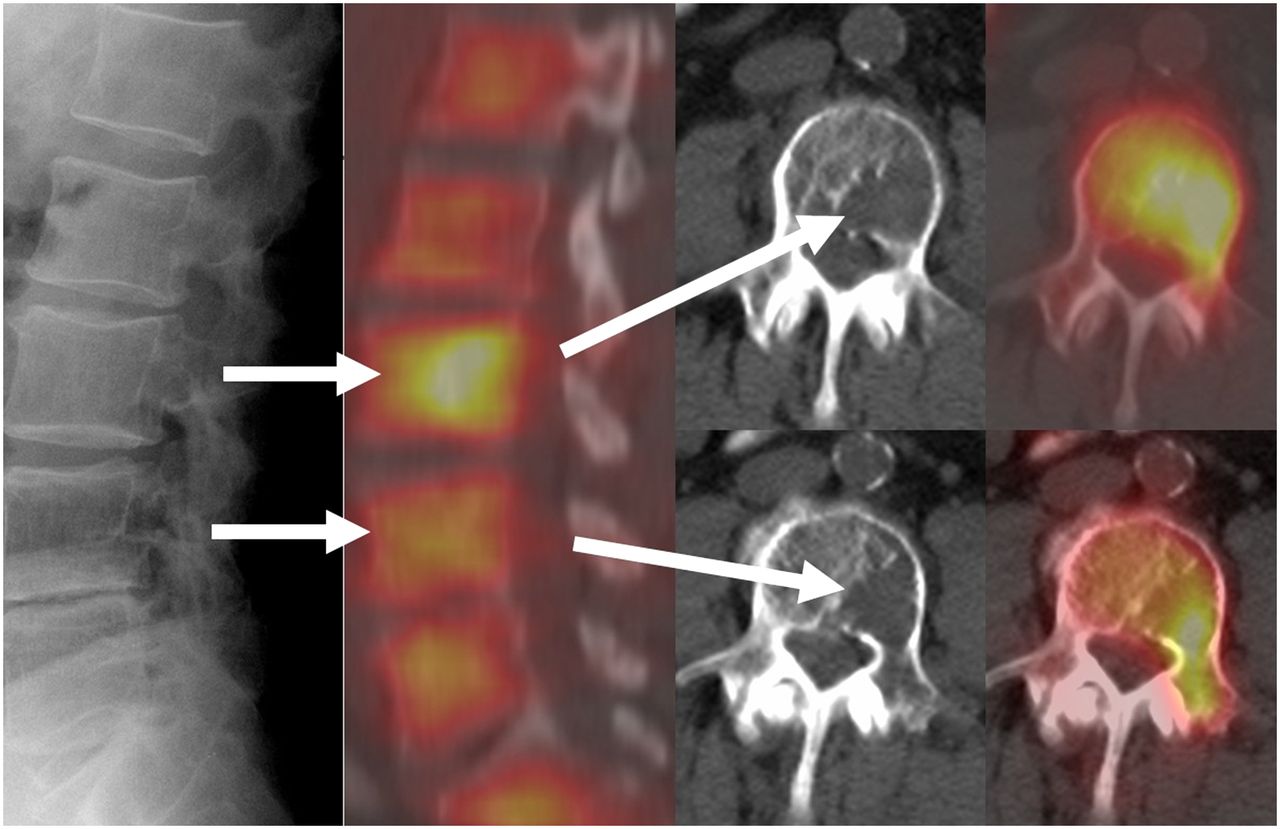
POEMS syndrome (polyneuropathy, organomegaly, endocrinopathy, presence of M protein, and skin changes) is a rare, poorly understood MM variant that demonstrates osteosclerotic changes that can be diffuse or focal. Accordingly, POEMS syndrome is also called osteosclerotic myeloma (41–44). Although the diagnosis of POEMS syndrome is complex, diffuse or focal osteosclerotic bone lesions in the proper clinical setting should suggest the diagnosis (Fig. 6). Occasionally, diffuse osteosclerotic changes occur with focal osteolytic lesions. POEMS syndrome patients have a superior median survival compared with classic MM patients.
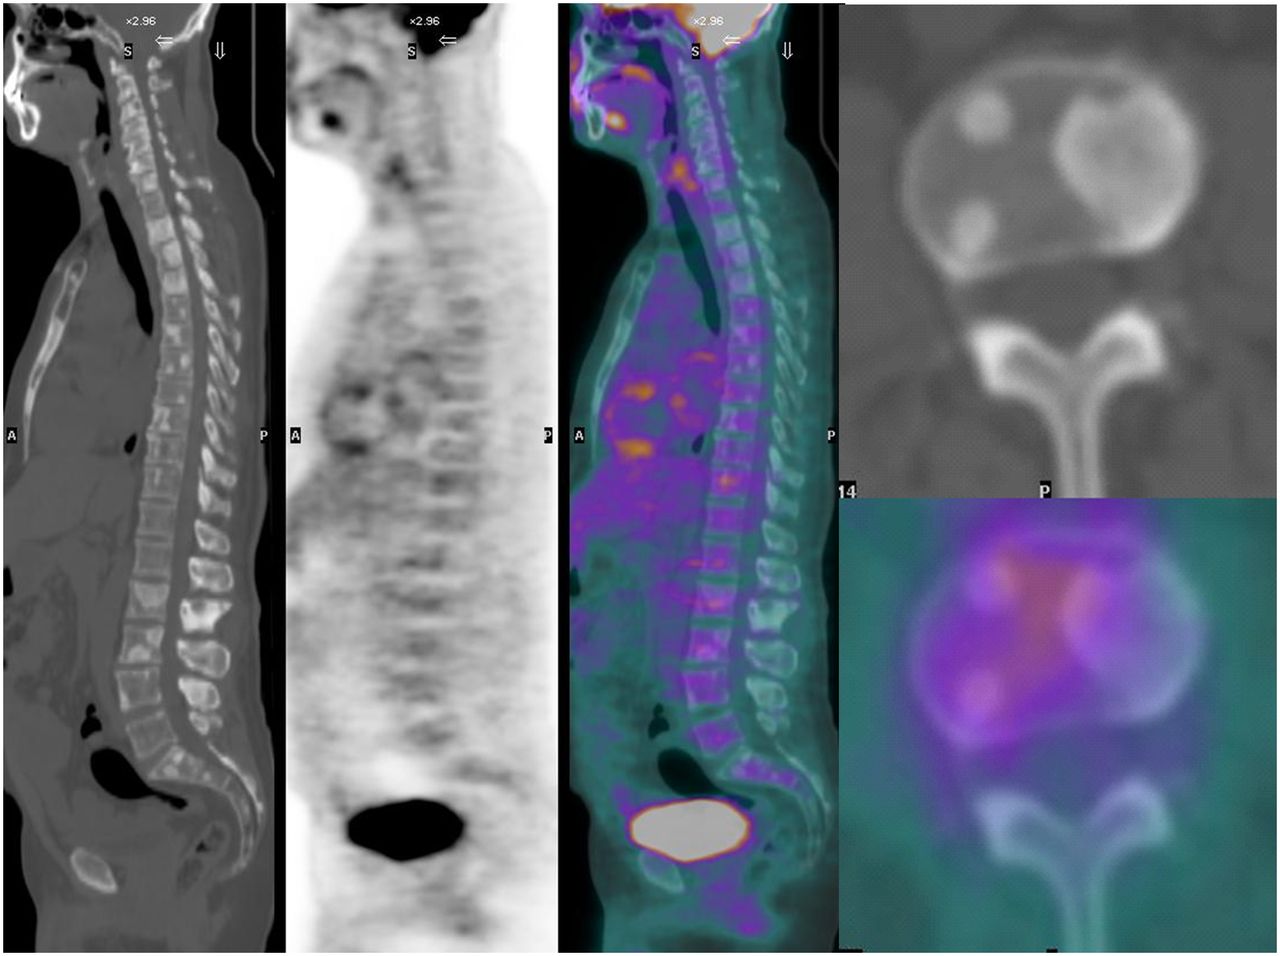
POEMS syndrome as seen on 18F-FDG PET/CT. From left to right are shown sagittal CT, emission PET, fused PET/CT, and axial CT (top) and fused PET/CT (bottom) of patient with laboratory and marrow biopsy evidence of MM but with focal osteosclerotic bone lesions.
INFORMATION TO BE REPORTED ON IMAGING STUDIES
There are key findings directly relevant to clinical care that must be reported when imaging MM and related diseases.
In accordance with the new Durie–Salmon Plus staging, identification and quantification of the number and size of focal skeletal lesions seen on MRI, MBS, or 18F-FDG PET/CT should be reported. This allows for risk stratification based on the number of focal lesions found by MRI or 18F-FDG PET/CT at baseline and restaging (10,21), determination of whether a focal lesion on MRI corresponds via radiography or CT with an area of focal osteolysis (if not, effective treatment can prevent this irreversible end organ damage), detection of EMD (21), and identification of areas for safe or high-yield biopsies, such as the site of greatest uptake on 18F-FDG, EMD, or otherwise dominant lesions (10,11).
Also to be reported are any areas identified as being at high risk for pathologic fractures, allowing possible preemptive action (e.g., vertebroplasty, surgical intervention, or focal radiation therapy), and any treatment-related complications such as avascular necrosis or possible osteonecrosis of the mandible or maxilla (45,46).
Any diffuse marrow infiltration seen on MRI or 18F-FDG PET/CT should be reported (10,21), along with any high-risk areas of tumor that may need immediate aggressive treatment (e.g., epidural tumor endangering the spinal cord or a lytic lesion of the odontoid process) (3), any occult infection detected (47–50), and any important but previously unsuspected comorbid conditions, such as additional primary malignancies or premalignant colon polyps (51).
MBS
The classic Durie–Salmon staging system of MM at baseline and restaging was established in 1975 (52). Recently, Durie developed the Durie–Salmon Plus system (Table 1), including advances in imaging technology developed since 1975 (37,53).
Durie–Salmon Plus Staging System
The MBS remains in widespread use, consisting of plain radiographs of the entire skeleton. Although sensitive in the skull and extremities, the MBS is less sensitive for detecting focal lesions in the more central skeleton because of mixed densities from overlapping bones, air, solid organs, and gut contents that can either simulate or obscure focal bone lesions. Cadaveric studies have shown that at least 50% of focal loss of bone in a vertebral body must occur for a lytic lesion to be seen on a radiograph (Fig. 7) (54). Importantly, MBS cannot detect intramedullary tumor that has not produced a radiographic finding. MBS is limited in the ability to detect EMD. Osteoporosis and osteopenia are late findings on MBS. Although MBS cannot demonstrate a response to treatment, it can reveal relapse or progression if new focal bone lesions appear. MBS is useful when MRI or PET/CT is limited by artifacts, such as from orthopedic hardware. MBS may also reveal unsuspected findings, such as infection or other malignancies (21,55).

False-negative MBS. Focal osteolytic lesions of MM are seen well with 18F-FDG PET/CT, compared with MBS. MBS lateral view of lumbar spine (far left) demonstrates no evidence of tumor. 18F-FDG PET/CT (second from left) reveals diffuse myeloma marrow infiltration (shorter arrows) and focal lytic bone lesions (longer arrows) of L3 and L4. Axial 18F-FDG PET/CT fused images are at far right, and corresponding CT-only images are second from right. (Reprinted with permission from (31).)
CORRELATING 18F-FDG PET/CT AND MRI OF MM
MRI is well established for imaging of MM and related diseases, having been used for the staging and restaging of MM since the 1980s. Though more expensive, MRI is more widely available than 18F-FDG PET/CT and does not expose the patient to ionizing radiation. Accordingly, nuclear medicine physicians will frequently need to correlate MRI examinations with 18F-FDG PET/CT in MM patients. In the MRI protocol for MM, the region of most common tumor involvement, the adult hematopoietic marrow, is imaged. Specific protocols vary between manufacturers and according to the specific scanner, available coils, and other factors. With effective treatment, the marrow signal returns to normal. The diffuse marrow infiltration can normalize in near real time. Focal lesions gradually fill in with scar tissue with low water content, matching the MRI signal of normal central marrow if the patient remains in remission. The normalization of MRI focal lesions can take weeks to years, depending on the size of the focal bone lesion (56–65). Knowledge of the normal appearance of the central marrow for the patient’s age is a prerequisite for proper interpretation of the MR image. The use of marrow-stimulating medications and chemotherapy rebound will cause changes in the marrow MRI signal resembling diffuse MM infiltration. These hypercellular marrow changes are also seen on PET/CT or 99mTc-sestimibi as diffuse, intense radiopharmaceutical uptake in the marrow (3,10).
MRI-defined focal lesions (Fig. 8) can be obscured by either intense diffuse marrow infiltration from tumor or by marrow stimulation or chemotherapy rebound. Because the diffuse infiltration responds more quickly to effective treatment than the focal lesions, underlying MRI focal lesions can become visible as the diffuse cellular infiltration subsides. This clearing of the diffuse marrow infiltration that reveals underlying, persistent MRI focal lesions (Fig. 9) is termed unmasking and should not be confused with progression on treatment (10).

MM patient with innumerable focal lesions seen with PET and MRI. Anterior 3-dimensional maximum-intensity-projection 18F-FDG PET image (A) and sagittal short-tau inversion recovery images of thoracic (B) and lumbar (C) spine reveal innumerable focal lesions and partial compression fractures of upper-end plates of several vertebrae (e.g., L1 and L2).

Unmasking of MRI focal lesion. Sagittal short-tau inversion recovery MRI series at baseline (BL) and at restaging examinations, with indication of number of days relative to baseline. Baseline examination demonstrates diffuse, severely increased marrow signal from diffuse marrow infiltration. By 223 d, diffuse signal has improved, unmasking underlying focal lesions (arrows) because focal lesions respond more slowly to treatment. By 314 d, diffuse marrow signal is normal, MRI focal lesions are slowly decreasing in size and intensity, and patient is in complete remission. By 1,867 d, patient is in durable remission, MRI finally appears normal, and MRI complete remission is finally achieved. (Reprinted with permission of (78).)

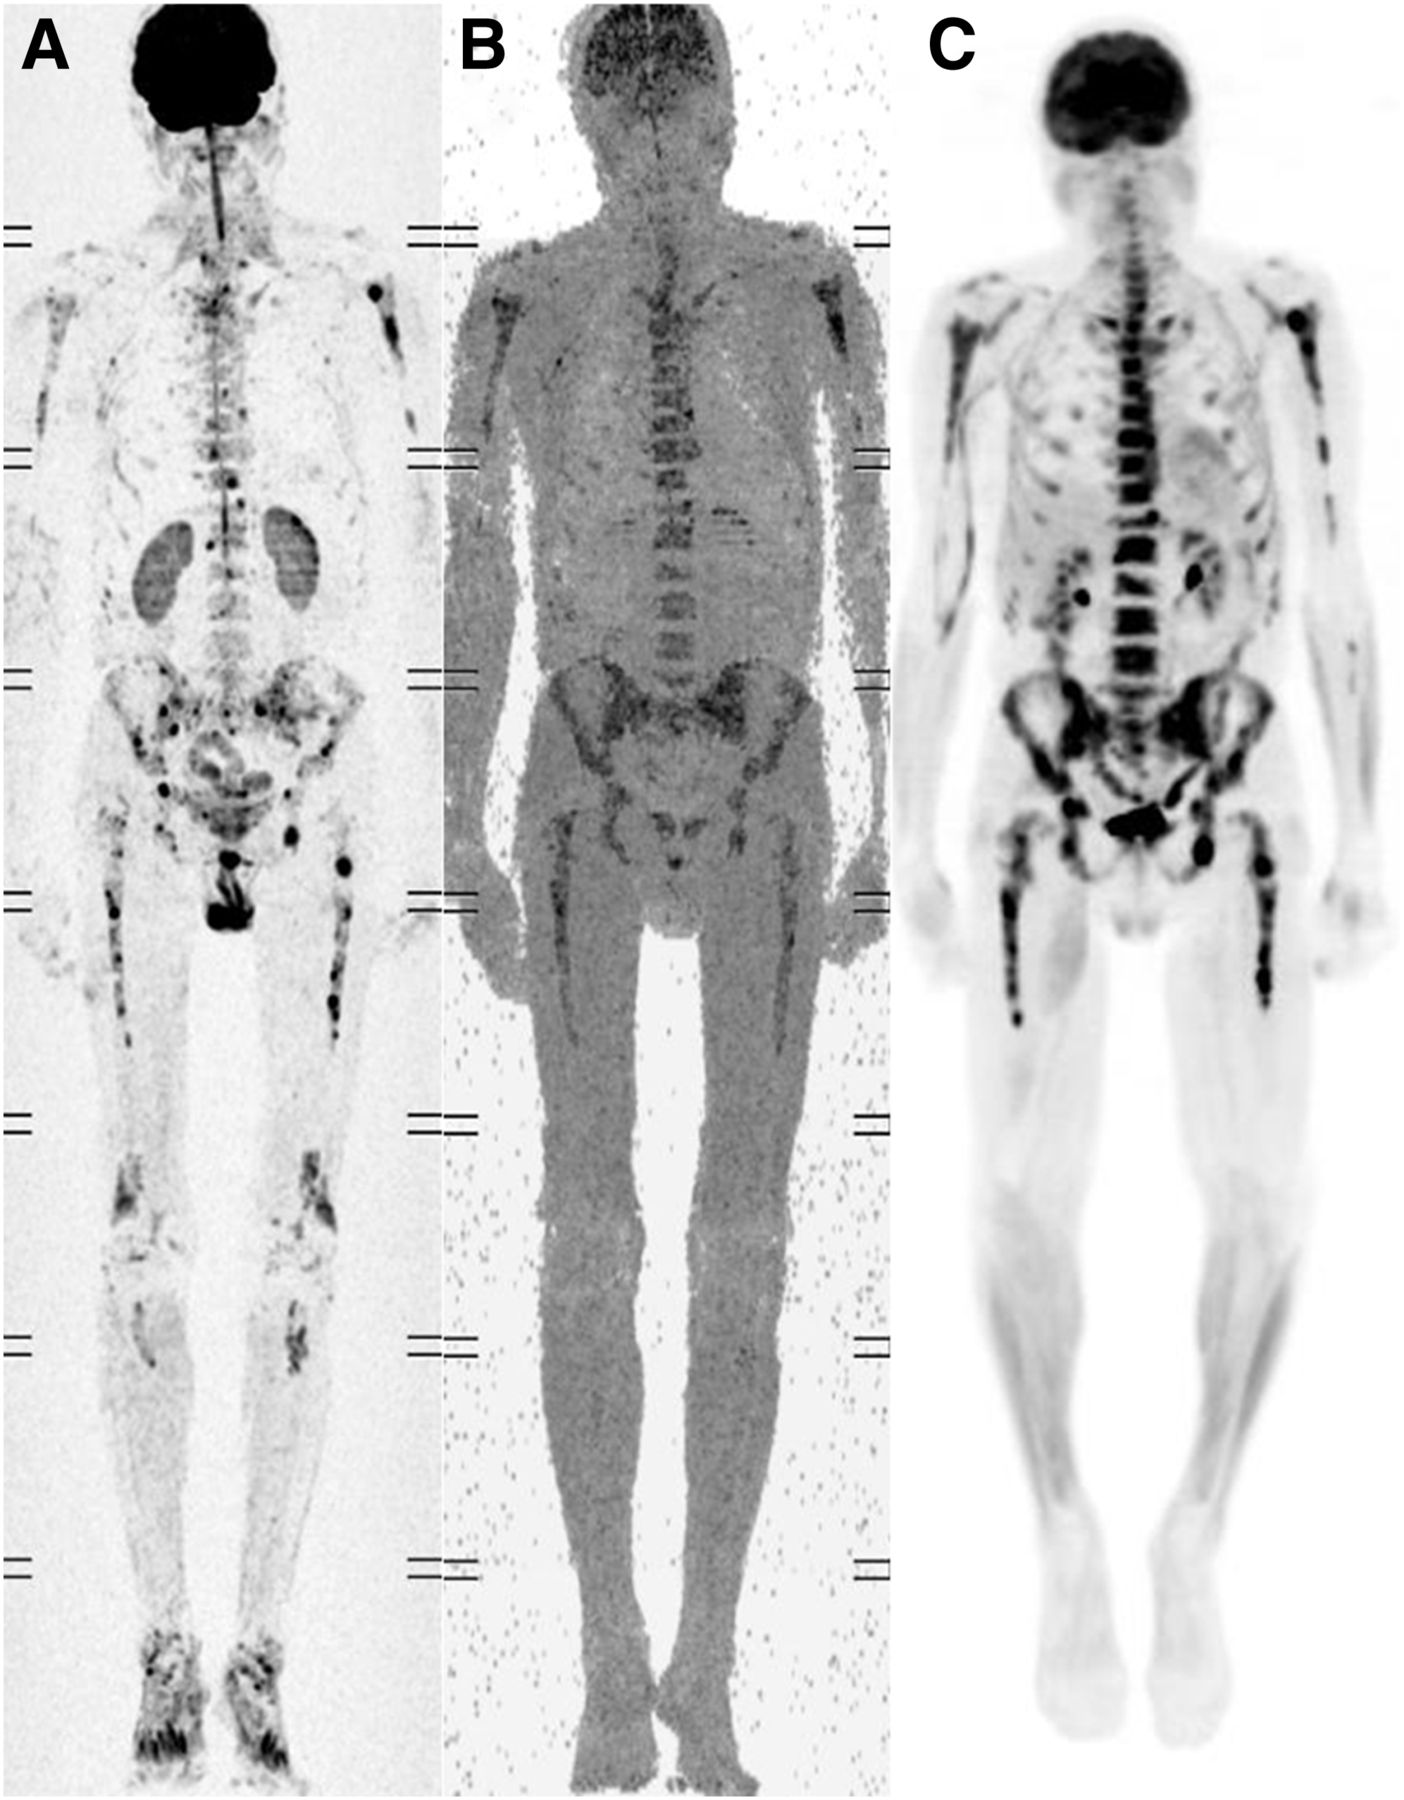
Baseline whole-body anterior MRI (A and B) and 18F-FDG (C) images of patient newly diagnosed with MM. MRI was performed using 3-dimensional maximum-intensity projection with diffusion weighting and restriction on apparent diffusion coefficient. All 3 images reveal severe diffuse and focal marrow infiltration.
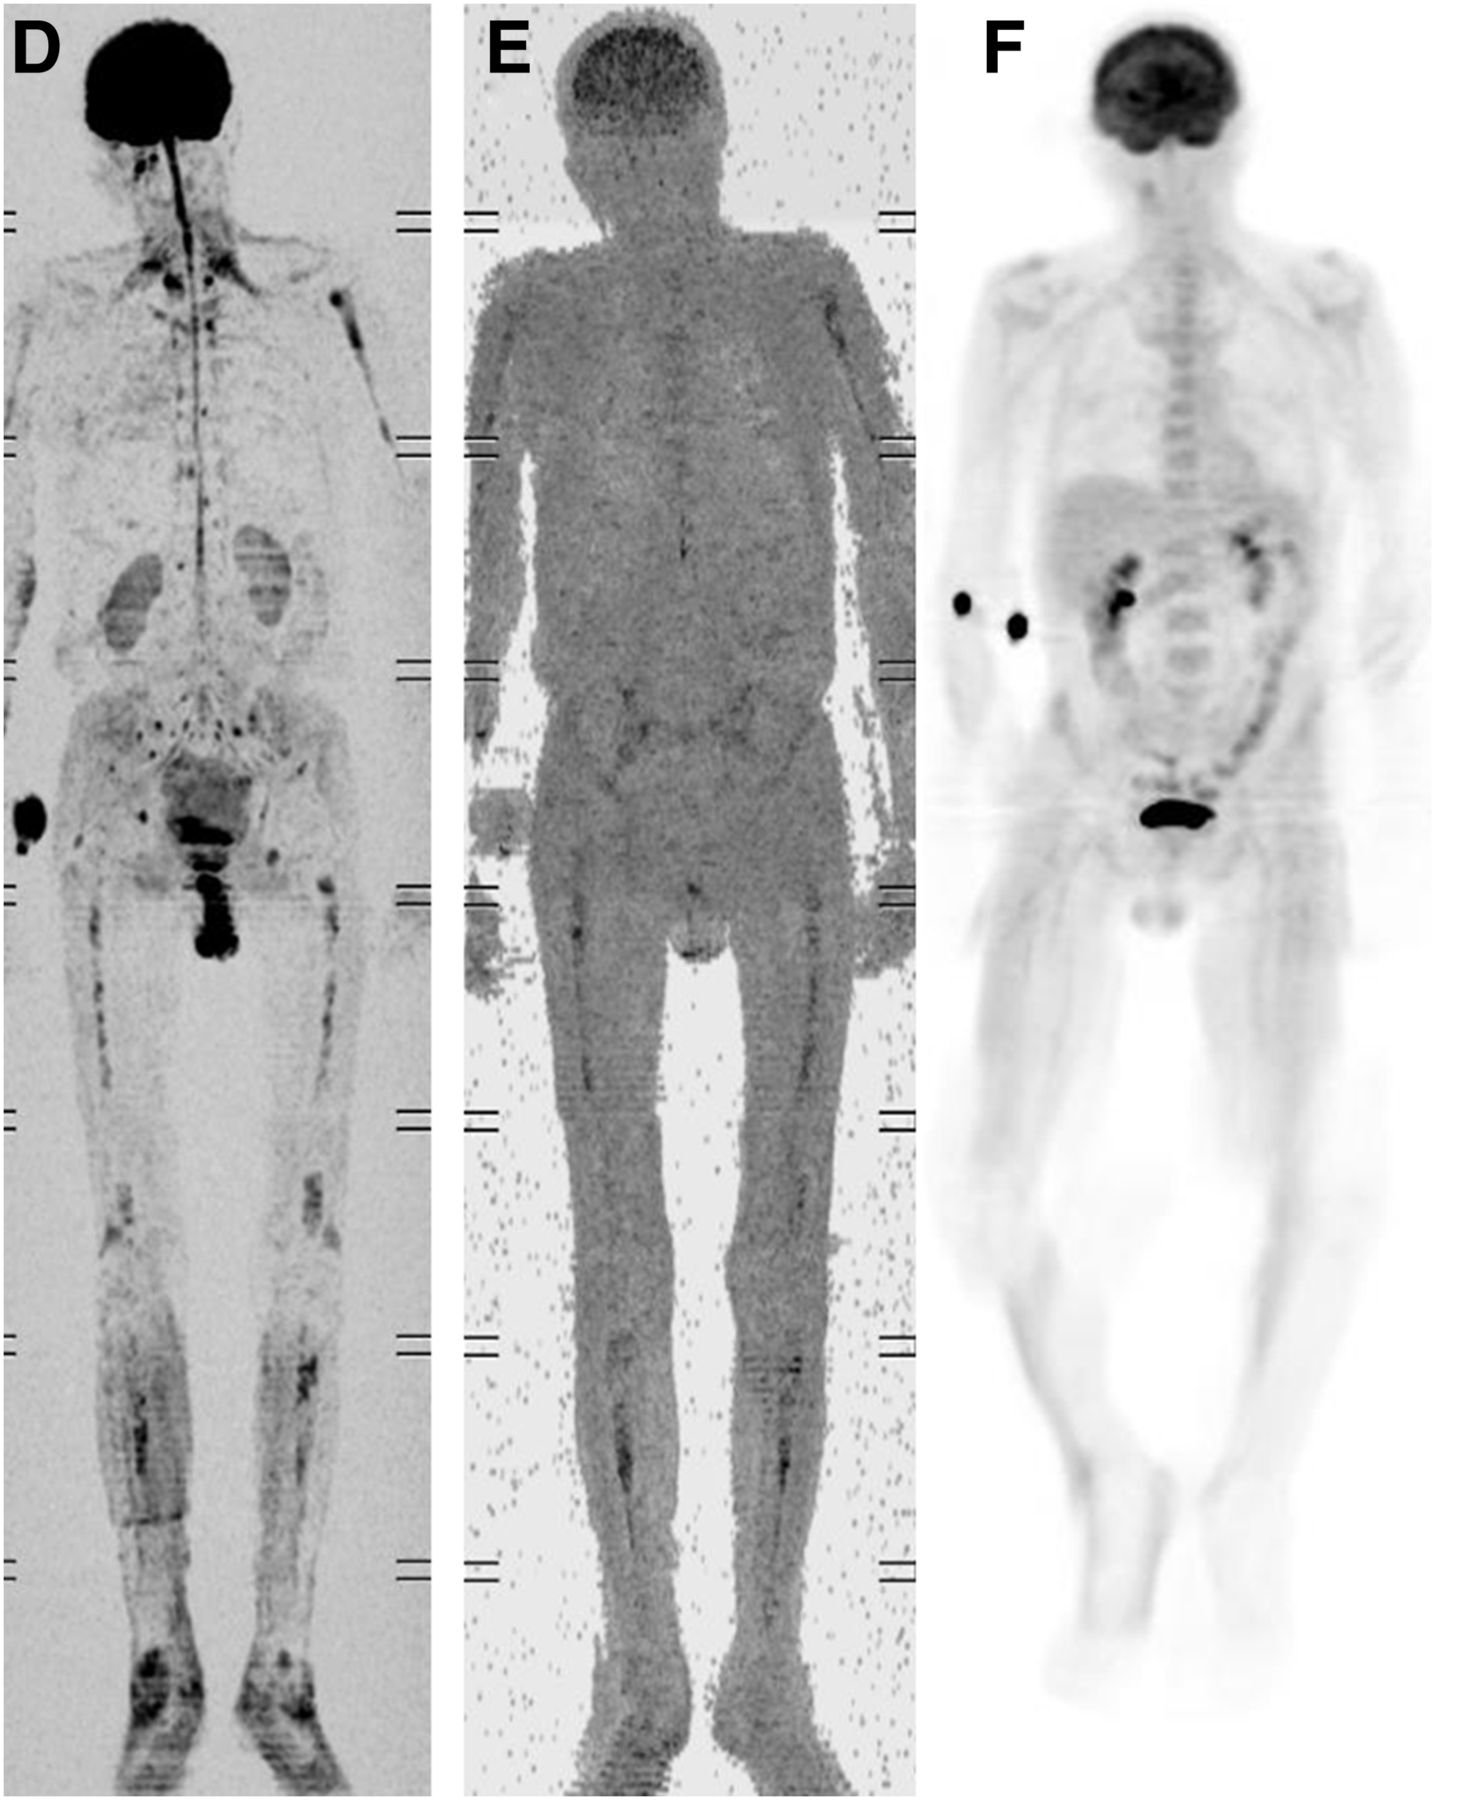
Treatment response seen on whole-body anterior MRI (C and E) vs. 18F-FDG PET (F). Patient is same as shown in Figure 10. MRI was performed using 3-dimensional maximum-intensity projection with diffusion weighting and restriction on apparent diffusion coefficient. Improvement is seen on MRI, with some persistent abnormalities and normalization on PET. By tumor markers, patient was in remission, correlating best with PET image.
Additional MRI findings commonly seen in MM patients include insufficiency fractures, infections, avascular necrosis of the femoral or humeral heads, and osteonecrosis of the maxilla or mandible (3,10,45,46,66).
Although MRI is extremely useful for staging and restaging of MM patients, it has limitations. Some patients cannot be imaged because of implanted devices (e.g., pacemakers or defibrillators). MR images can be limited by artifacts such as from orthopedic hardware, vertebroplasty cement, or cardiac or aortic pulsations. Because MRI often requires 45–90 min, motion artifacts often occur. An extensive MRI examination is typically more expensive than a whole-body PET/CT examination. Gadolinium must be used with caution in patients with renal impairment, common in MM patients, because of the risk of nephrogenic systemic fibrosis (3,67,68).
The relative advantages of MRI over 18F-FDG PET/CT are its superior spatial and contrast resolution—typically 2 mm for a 1.5-T MRI system versus approximately 5–8 mm for the PET portion of current PET/CT scanners. Also, MRI is more widely available. As with other malignancies, 18F-FDG PET can be falsely negative in recently treated patients because of transient suppression of tumor metabolism, whereas MRI is not as limited in this setting. MRI is also superior to all other modalities, including PET/CT, for early diagnosis of avascular necrosis (3,10,45).
Whole-body MRI (Figs. 10 and 11) is an emerging technology with an investigational role in the staging and restaging of MM and related diseases. Several reports have shown exquisite sensitivity for detection of bone marrow involvement in a variety of malignancies, including MM. Whole-body MRI has a field of view superior to that of conventional MRI, analogous to whole-body PET/CT. Whole-body MRI requires about 20–30 min to perform, comparable to whole-body PET/CT. It must be acquired separately from conventional MRI. The expense of whole-body MRI remains undefined since it is still investigational. Preliminary data suggest that response to treatment as seen on whole-body MRI occurs more rapidly than on conventional MRI but not as rapidly as on 18F-FDG PET/CT. Because whole-body MRI is based on the detection of stationary water, images are not tumor-specific and should be correlated with other imaging methods, such as CT or PET/CT. Whole-body MRI provides a possible future alternative to whole-body PET/CT if PET/CT is not available. As with conventional MRI, the patient is not exposed to ionizing radiation. Not all patients can undergo whole-body MRI due to pacemakers, aneurysm clips, or other devices (69–71).
99mTC-SESTIMIBI IMAGING
99mTc-sestimibi imaging is useful for whole-body imaging of MM. Because 99mTc-sestimibi uptake is normally relatively high in the myocardium, liver, and spleen and normally excreted in bile, visualization of MM is limited in these regions, but imaging with SPECT or SPECT/CT can improve the visualization of tumor in these regions, particularly in the abdomen. 99mTc-sestimibi uptake is increased in active disease and normalizes in remission. The uptake of 99mTc-sestimibi can be falsely reduced in drug-resistant MM, resulting in a false-negative scan. 99mTc-sestimibi imaging is of proven utility in distinguishing MGUS from MM. 99mTc-sestimibi imaging is a good substitute when 18F-FDG PET/CT is not available. 99mTc-sestimibi imaging is also less expensive than PET/CT, is more widely available, and is not routinely needed in addition to 18F-FDG PET/CT (4,33,72–74).
CLINICAL RELEVANCE OF IMAGING IN MM
Imaging is essential for accurate staging and restaging of MM, with the updated Durie–Salmon Plus staging system incorporating advanced imaging. Imaging can greatly assist diagnosis by identifying high-yield sites for image-guided biopsies. Image guidance to focal lesions significantly increases the yield of clinically relevant cytogenetic abnormalities over random biopsies, improving early identification of patients with high-risk disease and assisting in the best selection of treatment (11,75).
In the United States, the Centers for Medicare and Medicaid Services has approved broad-coverage reimbursement for imaging of MM with 18F-FDG PET/CT for Medicare recipients at the time of “initial treatment strategy” (initial diagnosis and staging) and for additional PET/CT examinations performed for “subsequent treatment strategy” (restaging). Though still widely used, MBS has known limitations, with subtle changes in patient positioning sometimes simulating or obscuring focal lesions. Thus, excluding the upper skull and extremities, CT should be used to confirm any MBS-suspected finding or change (10,21). Advanced imaging with MRI or PET/CT can detect intramedullary focal lesions before anatomic changes occur and can also detect the diffuse marrow infiltration component of MM. MBS will seldom detect EMD (21). Importantly, neither radiography- nor CT-based MBS can determine whether a given osteolytic lesion contains active disease (Fig. 12). Anatomic imaging is thus inferior to functional imaging for directing treatment or guiding biopsy.

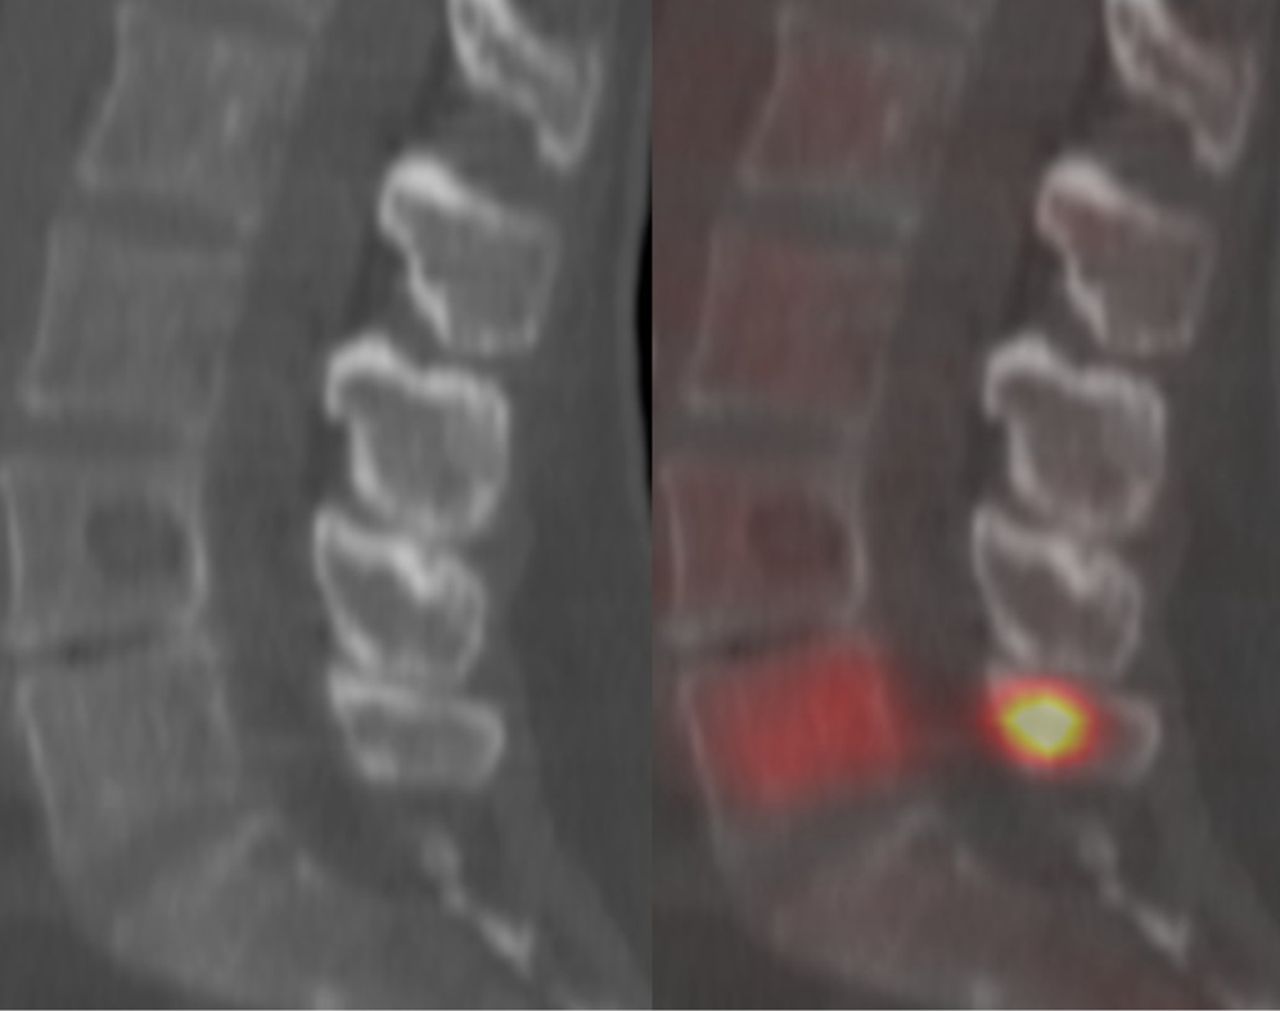
Radiography or CT alone cannot determine functional disease status. Sagittal CT image (left) and corresponding fused 18F-FDG PET/CT image (right) in patient with newly diagnosed MM show that CT cannot demonstrate disease activity or optimum site for biopsy. CT reveals obvious focal osteolytic lesion at L4 and smaller one in S1, each of which is shown to be inactive on fused image. Although CT demonstrated focal bone lesions of symptomatic MM, CT-directed biopsy of focal osteolytic L4 lesion might not yield accurate diagnostic information. If functional imaging were used to direct biopsy to metabolically active disease in L5 vertebral body or L5 spinous process, yield of clinically relevant cytogenetic abnormalities would statistically be higher. (Reprinted with permission of (78).)
Relapse and progression on treatment are readily detected with either MRI or PET, appearing as an increase in the size or number of focal skeletal lesions or sites of EMD. In relapse, the number of focal lesions can be fewer than, the same as, or more than that seen on earlier imaging studies (Fig. 13); thus, it is essential to correlate directly the new imaging study with previous imaging studies to determine whether a particular lesion is progressing or is new (10,21).

Sagittal views of short-tau inversion recovery–weighted MRI series demonstrating baseline diffuse and focal disease, treatment response, and relapse. (A) At time of diagnosis, diffuse tumor infiltration and focal lesions are seen (arrows). (B) Complete response is seen 240 d later, with normal MRI appearance. (C) Relapse is seen 610 d after diagnosis, with slight increase in diffuse, heterogeneous marrow signal, recurrent focal lesion at L4 (bottom arrow), and new focal lesion at L2 (top arrow). (Reprinted with permission of (10).)
High numbers of focal lesions on baseline examinations (3 or more on PET, 8 or more on MRI) confer poor long-term outcome independent of other risk factors, even in patients with gene expression profiling identifying low-risk disease, but do not correlate with short-term response (21). EMD confers a poor prognosis, especially if present at baseline (21). The longer a patient has MM, the more likely the patient is to develop EMD and hypo- or nonsecretory disease, both high-risk entities for poorly differentiated, aggressive disease. As with malignant lymphoma, achieving a PET complete remission (normalization of 18F-FDG uptake in focal bone lesions and sites of EMD) (Fig. 14) before stem cell transplantation is associated with superior durability of remission and improved survival, even in patients who are at high risk by gene expression profiling (21).
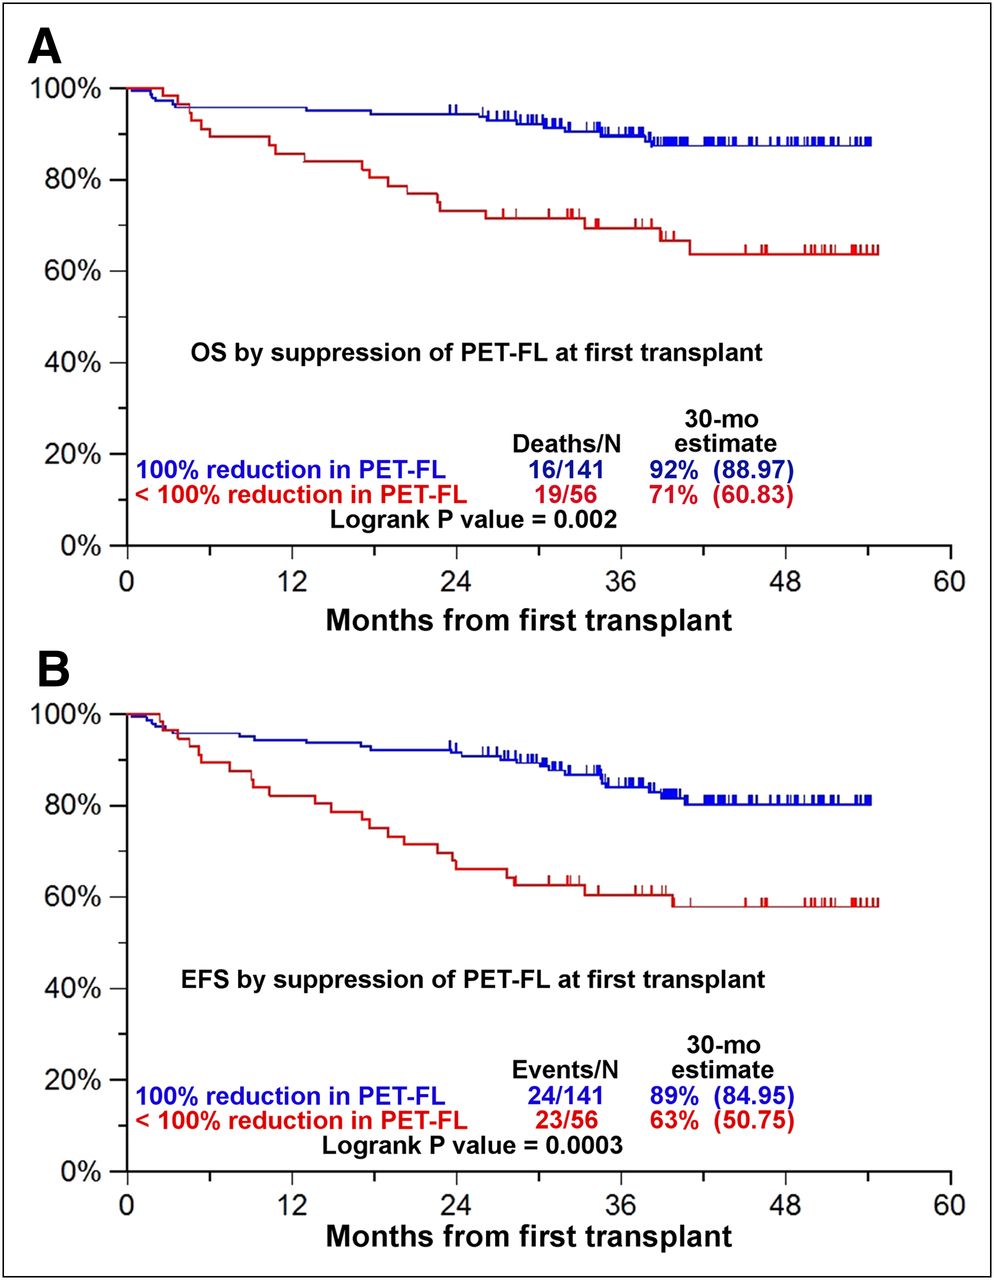
Kaplan–Meier analysis demonstrating superior overall survival (OS, A) and event-free survival (EFS, B) for patients whose baseline focal lesion (FL) or sites of EMD showed complete normalization on PET. Normalization of PET/CT scan conferred superior outcome for patients before first of two autologous stem cell transplantations in clinical trial Total Therapy 3. (Reprinted with permission of (21).)
Occult infection is a significant source of morbidity and mortality for MM patients. The use of chronic high-dose glucocorticoid and pain medications and the frequent presence of tumor-related fever make detection of infection problematic. Melphalan-based myeloablation preparatory for stem cell transplantation, a mainstay of MM treatment, often results in both significant neutropenia and immunosuppression, reducing the accuracy of radiolabeled leukocyte scans to identify a site of infection. A sudden elevation of C-reactive protein is suggestive of but not specific for infection (76). In this difficult setting, 18F-FDG PET/CT is superior to other imaging methods for detection of occult infection (76).
Clinically silent infections in this setting include septic thrombophlebitis of venous catheters, sinusitis, pneumonia, osteomyelitis, diskitis, cellulitis, mastoiditis, and infections of the genitourinary or gastrointestinal tracts. Periodontal abscesses are frequent and must be excluded from tumor involvement or from osteonecrosis of the mandible or maxilla. Although a variety of organisms are responsible for perioral infections, fungal infection is frequently seen, often associated with osteonecrosis. 18F-FDG PET/CT contributes significantly to patient management by identifying the presence and site of possible infection, establishing the extent of infection, and modifying the diagnosis or therapy (47,50,76).
Patients with hematologic malignancies are at high risk for potentially life-threatening lung infections, especially within the first 100 d of stem cell transplantation, seen in about 7%. Though multiple organisms are potential candidates (bacterial, viral, and fungal), Cytomegalovirus (37%) and Aspergillus sp. (30%) are the 2 most common pathogens (77).
CONCLUSION
Advanced MRI, 18F-FDG PET/CT, and 99mTc-sestimibi imaging of patients with MM and related diseases are useful and reliable techniques that assist diagnosis, identify high-yield biopsy sites, and provide results superior to those of conventional imaging with MBS for staging and restaging patients, detecting EMD, and demonstrating response to treatment. Because of the wider field of view of whole-body PET/CT and SPECT/CT, their detection of EMD is superior to that of conventional MRI, though whole-body MRI may prove similar to whole-body PET/CT in this regard. MRI, PET/CT, and 99mTc-sestimibi imaging are effective for secretory and nonsecretory disease. PET/CT and 99mTc-sestimibi imaging are superior to MRI for monitoring treatment response.
18F-FDG PET/CT is especially useful in patients with hematologic malignancies for detection and localization of occult infection—even in patients with severe neutropenia—providing information that often contributes to a change in patient management.
A large number of focal lesions or the presence of EMD identifies patients who are at high risk, have poor long-term prognosis, and may benefit from aggressive monitoring and treatment. Treatment successful in achieving a PET complete response before initial stem cell transplantation confers superior overall and event-free survival. Conversely, imaging identification of disease progression on treatment identifies a patient in need of immediate intervention.
Footnotes
Published online Jun. 12, 2012.
Learning Objectives: On successful completion of this activity, participants should be able to describe (1) the benefits and limitations of both conventional and advanced imaging in evaluating patients with multiple myeloma and related plasma cell dyscrasias; (2) imaging findings of key significance for clinical management of patients with multiple myeloma and related plasma cell dyscrasias; and (3) common and sometimes life-threatening complications of myeloma and its treatment.
Financial Disclosure: The authors of this article have indicated no relevant relationships that could be perceived as a real or apparent conflict of interest.
CME Credit: SNM is accredited by the Accreditation Council for Continuing Medical Education (ACCME) to sponsor continuing education for physicians. SNM designates each JNM continuing education article for a maximum of 2.0 AMA PRA Category 1 Credit. Physicians should claim only credit commensurate with the extent of their participation in the activity.
For CE credit, participants can access this activity through the SNM Web site (http://www.snm.org/ce_online) through July 2013.
- © 2012 by the Society of Nuclear Medicine, Inc.
REFERENCES
- Received for publication April 5, 2012.
- Accepted for publication May 31, 2012.


Jump to section
Related Articles
Cited By...
- New Developments in Myeloma Treatment and Response Assessment
- Characterization of Bone Lesions in Myeloma Before and During Anticancer Therapy Using 18F-FDG-PET/CT and 18F-NaF-PET/CT
- Whole-spine Computed Tomography Findings in SAPHO Syndrome
- How I treat extramedullary myeloma
- Characterizing POEMS Syndrome with 18F-FDG PET/CT
- Multiple Myeloma and Diagnostic Imaging
- Minimal Residual Disease in Multiple Myeloma
- Prognostic implications of serial 18-fluoro-deoxyglucose emission tomography in multiple myeloma treated with total therapy 3