


Abstract
A circular 180° acquisition orbit is considered standard for cardiac SPECT imaging. Theoretically, a 360° acquisition orbit is preferred because of more complete Fourier spectral information on projection data. The differential effect of 180° and 360° acquisition orbits on image accuracy (homogeneity and defect size) was assessed quantitatively in phantom studies. Methods: SPECT imaging with a dual-head gamma camera was performed on normal cardiac phantoms filled with a 99mTc solution, using 180° and 360° circular acquisition orbits. The phantoms were placed in the center of the orbit and at 5, 10, and 15 cm off center. Fillable defect inserts of different sizes were placed in the phantom to simulate myocardial perfusion defects. The homogeneity of count distribution in short-axis slices of the normal phantom was analyzed as the percentage of variability. Defects were quantified as a percentage of the entire phantom volume using circumferential count profiles and normal reference profiles. Results: When normal phantoms were placed in the center of the orbit, percentage variability was not different whether a 180° or 360° acquisition orbit was used (4.2% ± 0.1% vs. 4.4% ± 0.2%, P = not statistically significant). However when normal phantoms were placed off center, SPECT imaging with a 180° acquisition orbit showed increasing inhomogeneity, both visually and quantitatively (e.g., percentage variability for the 15-cm off-center position was 10.8% ± 0.1% (P < 0.0001). SPECT imaging with a 360° acquisition orbit showed similar homogeneity visually and quantitatively, whether the phantom was placed in or off the center (e.g., percentage variability for the 15-cm off-center position was 4.6% ± 0.5%, P = not statistically significant). Quantification of phantom defects acquired with a 180° orbit showed increasing overestimation of defect sizes with increasingly off-center positions. Quantification of phantom defects acquired with a 360° orbit showed no effect from progressively off-center positions, although phantom defect sizes were mildly underestimated. Conclusion: SPECT images acquired with a 180° orbit may have significant erroneous inhomogeneity and overestimation of defect size, in particular when the target object is off the center of the orbit, as is commonly seen in clinical cardiac imaging. In contrast, SPECT images acquired with a 360° orbit may provide more accurate quantitative information.
For almost 2 decades, SPECT has been used extensively in cardiac nuclear imaging. This noninvasive imaging technique permits evaluation of patients with suspected or known coronary artery disease (1,2). Over the last decade, cardiac image acquisition has become well standardized. Guidelines published by the American Society of Nuclear Cardiology state that for cardiac SPECT imaging, the use of a circular orbit and an anterior 180° (right anterior oblique to left posterior oblique) acquisition orbit is standard (3). The guidelines state specifically that the 180° orbit yields higher image contrast than the 360° orbit. This guideline appears to be a continuation of the practice with 201Tl SPECT in the 1980s. Present-day 99mTc-labeled radiotracers have better imaging characteristics than 201Tl, and modern multihead gamma cameras have better electronics, collimators, and gantries that allow for 360° SPECT acquisition orbits without a significant increase in imaging time. Theoretically, a 360° acquisition orbit is preferred because it allows for filtered backprojection using complete Fourier spectral information on projection data. We have shown previously that the position of the heart within the orbit is of importance and that an off-center position may create artifacts (4). The modern multihead cameras with a fixed imaging table do not easily allow for positioning of the heart in the center of the orbit. We have observed also in clinical imaging that patient images reconstructed from 180° acquisition data show greater inhomogeneity than those reconstructed from 360° acquisition data (Fig. 1).
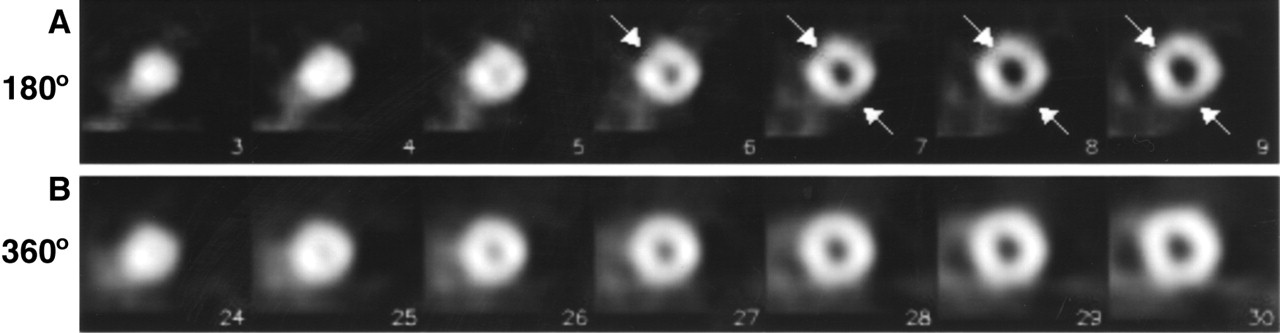
Reconstructed short-axis slices of healthy volunteer, including images acquired using 180° circular acquisition orbit (A) and images acquired with 360° acquisition orbit (B). Images reconstructed from 180° acquisition data show inhomogeneity (arrows) mimicking small anterior and inferior defects (variability, 13%). Images reconstructed from 360° acquisition data show more homogeneous and normal radiotracer distribution (variability, 8%).
The purpose of the current phantom study was to evaluate quantitatively the differential effect of 180° and 360° acquisition orbits, as well as the effect of the position of the target organ within the orbit, on the homogeneity of reconstructed SPECT images.
MATERIALS AND METHODS
A dual-head SPECT camera (Millennium VG; General Electric Medical Systems, Milwaukee, WI) equipped with 0.94-cm sodium iodide crystals and low-energy high-resolution parallel-hole collimators was used for image acquisitions. The system resolutions for a 99mTc (140 keV) source 0, 5, 10, 15, 20, 25, and 30 cm from the detector were 4.15, 5.66, 7.58, 9.66, 11.82, 14.03, and 16.26 mm, respectively.
Phantom Configuration
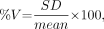
A hollow cylindric phantom (model ECT/P; Data Spectrum, Hillsborough, NC) was used for this study (Fig. 2A). The phantom consisted of a hollow inner cylinder (4 cm in diameter and 7 cm in length) placed within a larger hollow outer cylinder (6 cm in diameter and 8 cm in length). The volume of space (1 cm wide) between the 2 cylinders was 125 mL. This phantom was used as a 3-dimensional model of the left ventricle. The inner cylinder was filled with water, and the hollow space between the 2 cylinders was filled with a thoroughly mixed 99mTc solution with a concentration of 0.092 MBq/mL. The concentration was calculated on the basis of the approximate average myocardial tracer uptake—2.5% of a regular injected dose (1,110 MBq)—for an average heart, weighing 300 g (∼300 mL), in standard clinical cardiac SPECT imaging.

(A) Schematic of cardiac phantom with hollow inner and outer cylinders. Fillable defect inserts are 5, 10, and 20 mL, which respectively represent 4%, 8%, and 16% of simulated left ventricular myocardium (space between 2 cylinders). (B) Cardiac phantom secured in wooden frame. Numbers are distances from center of acquisition orbit, in centimeters.
Phantom Defect Inserts.
Fillable defect inserts (model ECT/FIL/I; Data Spectrum) were filled with water and placed within the hollow space between the 2 cylinders. These inserts were used to simulate myocardial perfusion defects of varying extent. The volumes of the defect inserts were 5, 10, and 20 mL.
The phantom without defect inserts simulated normal left ventricular myocardium, whereas the phantom configurations with fillable defect inserts simulated myocardium with perfusion defects. By placement of inserts in the hollow space of the phantom, defects were created that measured 4%, 8%, and 16% of the volume of the simulated left ventricular myocardium.
Position of Phantoms Within the Gamma Camera Gantry.
An adjustable wooden frame was used to secure the phantom in position for each imaging session (Fig. 2B). The frame facilitated suspension of the phantom on the very edge of the imaging table, thus avoiding photon attenuation by the table. In addition, the wooden frame allowed for reproducible repositioning of the phantom within the gantry.
Each phantom configuration (normal and with defects) was imaged in 4 different positions on the imaging table: at the centerline of the imaging table (center) and at 5, 10, and 15 cm off the center (Fig. 2B). In addition, the various phantom configurations were imaged in 2 different long-axis alignments with the table. One set of images was acquired with the long axis of the phantom parallel to the centerline of the imaging table (Figs. 3A and 3B) and will be referred to as straight, and a second set of images was acquired with the phantom angled at 26.5° to the centerline of the imaging table (Figs. 3C and 3D) and will be referred to as angled. The angled position of the phantom was to simulate the normal anatomic position of the heart in a patient.

Schematics of 4 phantom positions relative to center of orbit, including 180° acquisition setup with phantom in straight orientation (A), 360° acquisition setup with phantom in straight orientation (B), 180° acquisition setup with phantom in angled orientation (C), and 360° acquisition setup with phantom in angled orientation (D).
Image Acquisition
Each image was acquired using 180° and 360° circular orbits. The camera heads were 26.5 cm from the center of the orbit for all image acquisitions. A 15% energy window was set symmetrically over the 140-keV photopeak of 99mTc. SPECT imaging was performed using a step-and-shoot acquisition protocol, with a 64 × 64 matrix size and a pixel size of 6.55 × 6.55 mm. Each acquisition was repeated 3 times to reduce random variation of measurements.
180° Acquisition Orbit.
For 180° acquisitions, the 2 heads of the camera were positioned adjacent and perpendicular to each other (Figs. 3A and 3C). This positioning allowed for the acquisition of geometrically 180° projection data with an actual gantry rotation of 90° from right anterior oblique to left posterior oblique. A total of 60 projections, with an acquisition time of 20 s per projection, were acquired. The total acquisition time was 11.2 min.
360° Acquisition Orbit.
For 360° acquisitions, the 2 heads of the dual-head gamma camera were oriented parallel to and opposite each other (Figs. 3B and 3D). This position of the 2 heads permitted acquisition of geometrically 360° projection data with an actual gantry rotation of 180°. A total of 120 projections, with an acquisition time of 10 s per projection, were acquired. The total acquisition time was 12.4 min. The acquisition time per projection was reduced for 360° acquisitions to obtain images with total counts similar to those for 180° acquisitions during a similar overall time.
Image Reconstruction
The acquired projection images were corrected for nonuniformity and center-of-rotation offset and were subsequently reconstructed using standard filtered backprojection. The reconstructed SPECT images were smoothed using a 3-dimensional Butterworth filter with an order of 2.6 and a cutoff frequency of 0.24 times the Nyquist frequency. No photon scatter or attenuation correction was applied. Ultimately, the SPECT images were reoriented according to the long axis of the phantom. Multiple short-axis, vertical long-axis, and horizontal long-axis slices were thus generated.
Quantification of SPECT Images
SPECT images were quantified using Wackers-Liu circumferential quantification (WL-CQ) (Eclipse Systems, Branford, CT). This method has been described and validated previously (5,6). In brief, the region of the left ventricle in the SPECT slices was determined automatically. Each of the automatically determined short-axis slices from the apex to the base of the left ventricular myocardium was divided into 128 radial sectors. The apex cap was defined by 8 central long-axis slices in the 3-dimensional space, and each long-axis slice defining the apex cap was divided into 64 sectors. Circumferential count profiles were derived from maximal pixel values in each of the radial sectors. Each of the derived circumferential count profiles was normalized to the sector with maximal counts in the corresponding count profile. The normalized count profiles were subsequently extrapolated into 36 count profiles for calculation of perfusion defect size. The 36 count profiles were further compressed by being averaged into 3 composite (apical, midventricle, and basal) count profiles for display purposes and for calculation of the percentage of variability.
Calculation of Variability Percentage
Theoretically, the circumferential count distribution in reconstructed slices of a normal phantom should be homogeneous and thus quantitatively a straight line with a variability of 0%. Because the purpose of this study was to evaluate the differential effects of 2 orbits (180° and 360°), and of different positions of an object within these orbits, on the homogeneity of SPECT slices, the homogeneity of reconstructed slices was quantitatively analyzed as percentage variability. The percentage variability of the 3 composite circumferential profiles mentioned was calculated for each of the phantom configurations as:
 Eq. 1 where %V is the percentage variability and mean and SD are values for the circumferential profile. Mean percentage variability was calculated by averaging the percentage variabilities of apical, midventricle, and basal short-axis slices for 3 repeated SPECT acquisitions.
Normal Phantom Database
Although the normal phantom was filled with a homogeneous solution of 99mTc, the circumferential count distribution in reconstructed slices of the phantom was not homogeneous. This inhomogeneity was presumably caused by photon scatter and self-attenuation and perhaps by imprecise positioning of the phantom. To analyze the differential effects of 180° versus 360° orbits and of different phantom positions on the quantification of defects, we established reference profiles of count distribution. SPECT images were acquired of the normal phantom (without defect inserts) using 180° and 360° circular orbits positioned in the center of the imaging table (straight and 26.5° angled). Each acquisition was repeated 3 times to reduce random variation. After image reconstruction and quantification, 12 sets of circumferential count profiles (180° and 360°, straight and angled; 3 repeated acquisitions for each) representing reference profiles were generated. Lower-limit-of-normal phantom count profiles, that is, the mean − 2 SDs of the 12 datasets, were created for all 36 extrapolated circumferential count profiles derived from the short-axis slices and for the count profile derived from the long-axis slices defining the apex cap, based on reference image data. This step assumes that the observed variation in the 12 sets of reference phantom images was normally distributed and that in 95% of normal tests, the circumferential count profile lay within the defined range (from mean − 2 SDs to mean + 2 SDs).
Quantification of Defect Size
Quantification of SPECT myocardial perfusion defect size was performed using the WL-CQ quantification software described and validated previously (5,6). In brief, the size of a defect in a reconstructed SPECT slice was defined as the area between the derived circumferential count profile and the lower-limit-of-normal circumferential profile, divided by the sum of that area and the area below the derived count profile. The total defect size was calculated as the sum of defects in all short-axis slices and in the long-axis slices containing the apex cap, weighted for the volume of each slice (5). The total defect size was expressed as a percentage of the entire left ventricle.
Statistical Analysis
Data on percentage variability were expressed as mean ± SEM. Single-factor ANOVA was used for multiple-group comparisons, and a 2-tailed unpaired Student t test was used for 2-group comparisons for 180° versus 360° acquisitions and for straight versus angled orientations of the phantom. Probability values < 0.05 were considered statistically significant. Linear regression analysis was performed to assess the correlation between the true defect sizes and the SPECT-quantified defect sizes for 180° and 360° image acquisitions.
RESULTS
Normal Phantom
Center Position.
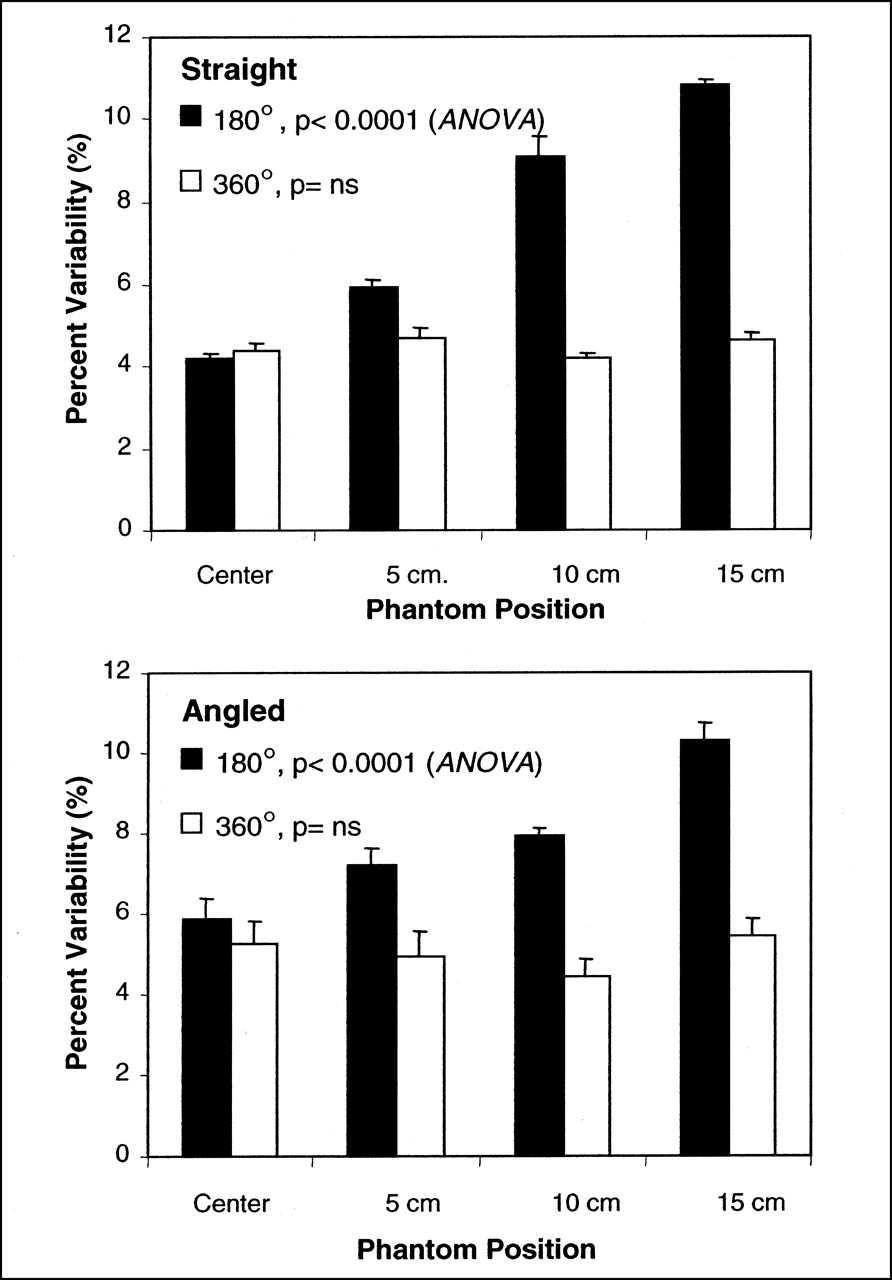
Visually, the count distribution on reconstructed SPECT slices of the normal phantom, positioned in the center of the orbit using either 180° or 360° acquisition, appeared homogeneous (Fig. 4). However, quantitative analysis with circumferential profiles indicated inhomogeneity (Fig. 4; Table 1). The inhomogeneity, expressed as mean variability, was not significantly different when 180° and 360° were compared with the phantom either straight or angled. However, mean variability was statistically different (P < 0.01) when straight and angled orientations were compared (Table 1).

SPECT short-axis slices and corresponding circumferential count profiles for normal phantom in center position and straight orientation using 180° and 360° acquisition orbits. Visually, all images appear homogeneous. Quantitative analysis by circumferential count distribution of apical, midventricular, and basal slices show mild inhomogeneity, possibly caused by slightly imprecise positioning of phantom. Patterns of circumferential count profiles are similar for 180° and 360° acquisition orbits.
Variability in Circumferential Count Profiles of Normal-Phantom Short-Axis SPECT Slices
Off-Center Position, 180° Acquisition.
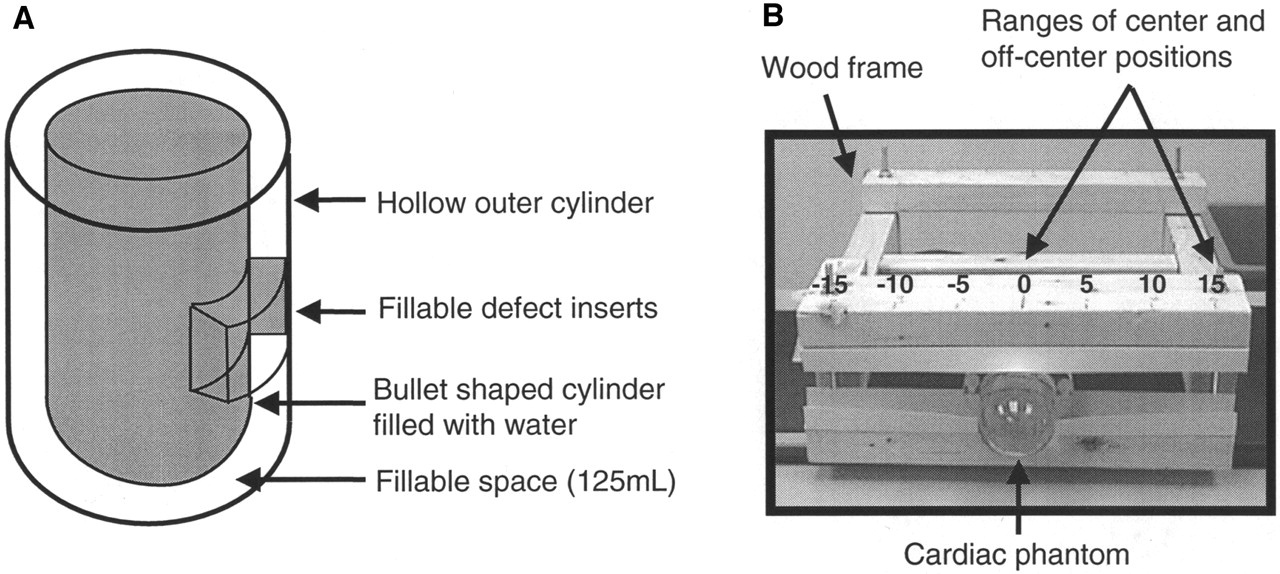
When the normal phantom was positioned off center and SPECT images were acquired with a 180° orbit, reconstructed short-axis slices showed an inhomogeneous count distribution. This inhomogeneity became increasingly apparent and significant (P < 0.0001, ANOVA) with increasingly eccentric positioning of the phantom in both straight and angled orientations (Table 1; Figs. 5 and 6). The mean percentage variability for the normal phantom was significantly greater (P < 0.01) in the angled orientation than in the straight orientation when the phantom was placed 5 cm off center.

SPECT short-axis slices and corresponding circumferential count profiles for normal phantom in 15-cm off-center position and straight orientation using 180° and 360° acquisition orbits. Visually, images acquired with 180° orbit are inhomogeneous (top). Mild defects are present (arrows). These segments of phantom wall were closest to rotating detectors. Images acquired with 360° orbit are visually homogeneous (bottom). Quantitative analysis by circumferential count profiles of apical, midventricular, and basal slices shows marked inhomogeneity of images obtained with 180° orbit. Arrows indicate troughs in profiles that correspond to visual defects in images. Circumferential count profiles of images acquired with 360° acquisition display only mild inhomogeneity similar to that in Figure 4.

Mean percentage of variability in circumferential profiles of reconstructed slices of normal phantoms in straight and angled orientations acquired with 180° and 360° orbits. Using 180° acquisition orbit, variability increased significantly (P < 0.0001, ANOVA) with increasingly off-center position in both straight and angled orientations. In contrast, variability did not significantly differ using 360° acquisition orbit (P = not statistically significant [ns], ANOVA). Variability in straight versus angled phantom orientations was significantly different only in center and 5-cm off-center positions (P < 0.01, unpaired t test).
Off-Center Position, 360° Acquisition.
In contrast, for a 360° acquisition orbit, reconstructed short-axis slices showed a visually homogenous count distribution regardless of the position of the normal phantom relative to the center of the imaging table (Figs. 4 and 5). This visual impression was confirmed by quantitative analysis. As shown in Figure 6 and Table 1, the mean percentage variability did not significantly differ (by ANOVA) with an increasingly eccentric phantom position. The 360° orbit yielded a relatively homogeneous image and count profile regardless of position or angle relative to the center of rotation.
Phantoms with Defect Inserts
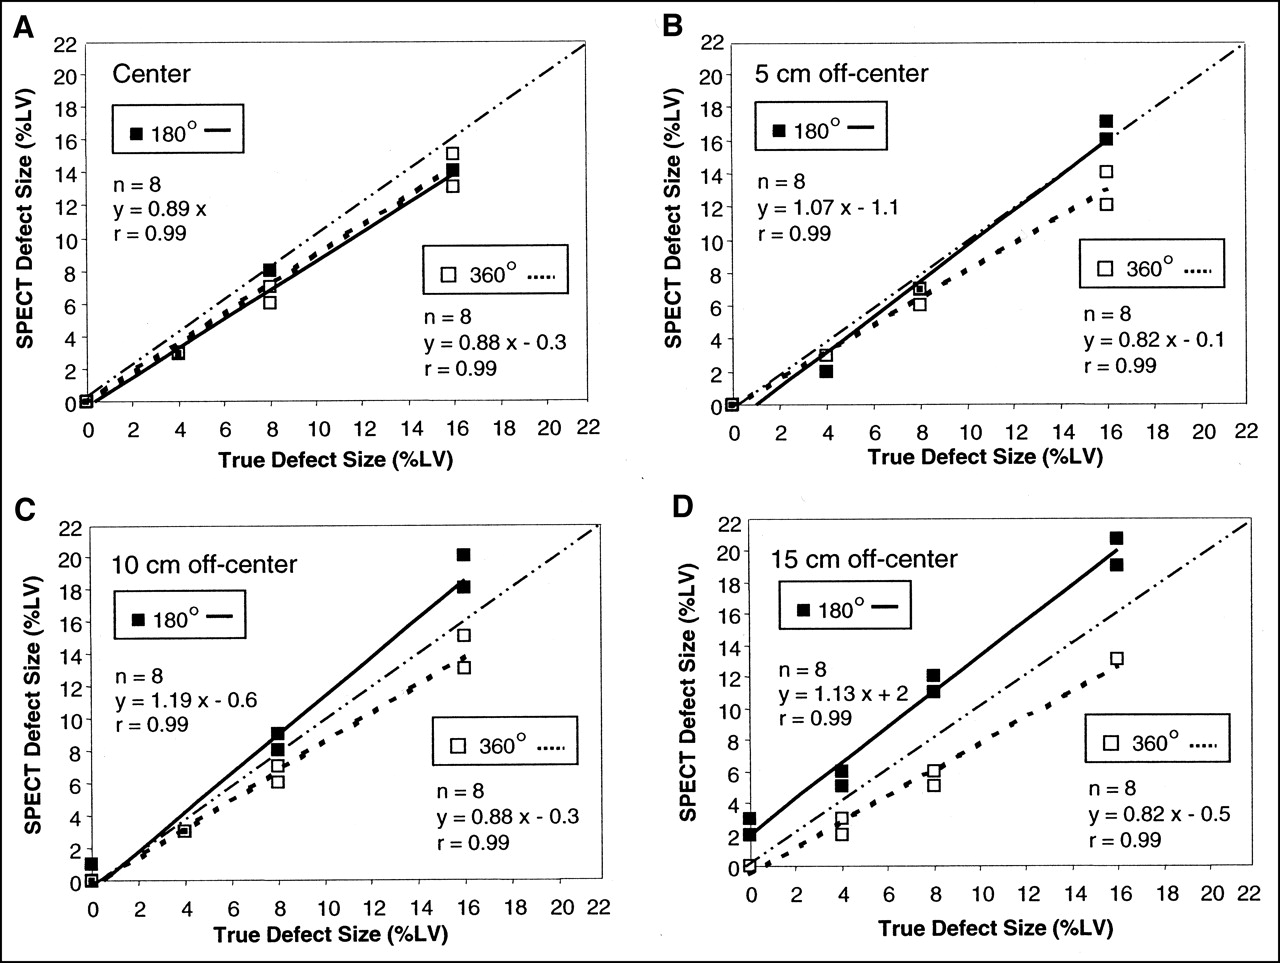
Quantification of defects using the phantom lower-limit-of-normal reference is shown in Figure 7. Overall, linear correlations between true defect size and quantified SPECT defect size were excellent (r = 0.99) for both 180° and 360° acquisitions and for center (Fig. 7A) and off-center (Figs. 7B–7D) phantom positions.

Correlations between true defect size and quantified SPECT defect size for SPECT acquisition using 180° and 360° orbits, in center position (A) and in 5- (B), 10- (C), and 15-cm (D) off-center positions. Each phantom position was analyzed with phantom in straight and angled orientations. Data label (⊡) denotes multiple data points with same (overlapping) SPECT defect value for 180° and 360° acquisitions. Dotted-and-dashed line represents line of identity. With 180° acquisition orbit, quantified SPECT defect size was increasingly overestimated when phantom was placed more eccentrically. With 360° acquisition orbit, quantified SPECT defect size remained in same range of underestimation regardless of whether phantom was positioned in center or off center.
Center Position.
Quantitatively, SPECT slightly underestimated defect size when the phantom was positioned at the center of the table. This underestimation occurred to a similar degree using 180° and 360° acquisition orbits (Fig. 7A).
Off-Center Position, 180° Acquisition.
Quantification of 180° SPECT images of phantoms with defects showed increasing overestimation of defect sizes with progressively off-center positions (Figs. 7B–7D).
Off-Center Position, 360° Acquisition.
Quantification of 360° SPECT images of phantoms with defects showed that progressively off-center positioning had no significant effect on defect size calculations (Figs. 7B–7D). The degree of underestimation of the defect size was similar in all off-center positions.
DISCUSSION
This phantom study showed that acquiring SPECT images with a 180° orbit had a considerable negative impact on image uniformity and the accuracy of defect size quantification. When a normal cardiac phantom was imaged using a 180° orbit, the percentage of variability in circumferential count profiles (inhomogeneity) increased significantly as the phantom was positioned increasingly off center. This effect was true whether the phantom was placed parallel or angled to the centerline of the imaging table. In the cardiac phantom with simulated perfusion defects, the 180° acquisition orbit resulted in increasingly greater overestimation of defect size when the phantom was placed increasingly eccentrically. In contrast, the quantified percentage variability and defect size did not change with a 360° acquisition orbit regardless of the off-center position of the phantom or the angle to the center of rotation. Thus, a 360° acquisition orbit will provide quantitatively more accurate imaging results when imaging is performed with 99mTc-labeled radiotracers.
The relative merits of 180° and 360° acquisition orbits for cardiac SPECT have often been discussed in the nuclear medicine literature (7–17). An important reason to favor 180° acquisition is the apparently enhanced image contrast (3). However, as our study suggested, the enhanced contrast is likely artifactual and caused by inhomogeneity stemming from the acquisition orbit. Previous studies comparing 180° and 360° acquisitions have been restricted to visual analysis of 201Tl SPECT images. Bax et al. (12) and Go et al. (13) observed that enhanced image contrast with 180° acquisitions caused false-positive myocardial perfusion abnormalities and overestimation of myocardial perfusion defect size—findings that agree with ours. Knesaurek et al. (18) and Bice et al. (19), in comparisons of 180° with 360° acquisitions using multiple point and line sources, analyzed the full width at half maximum of the point and line sources. They showed that 180° acquisitions had a substantial differential effect on the full width at half maximum in the x- and y-axis directions. This effect was more severe when the target objects were positioned increasingly off center. In the current study, the differential effect of 180° and 360° acquisition orbits was explored more extensively and was evaluated quantitatively in SPECT reconstructed images of a cardiac phantom.
Although 180° SPECT images generally display better image contrast, reconstructed images are distorted because of inadequate filtered backprojection (4,8,14,18,19). These artifacts of enhanced contrast and geometric distortion are in part caused by the nonuniform and depth-dependent spatial resolution (18) and are further aggravated by the embedded ramp filter in filtered backprojection (16). As shown in the current study, artifacts were generally not present with 360° acquisitions, presumably because of the averaging effect of incorporating opposing projection data before filtered backprojection (18).
Given the advantages of 360° acquisition orbits, it is unclear why the current guidelines recommend a 180° acquisition orbit for all cardiac imaging (3). For 201Tl cardiac SPECT imaging, a 180° acquisition orbit may be favorable in light of the lower energy and the greater attenuation and Compton scatter. However, Bax et al. (12) observed comparable diagnostic accuracy for prediction of myocardial viability with 201Tl using either acquisition orbit. Our study cannot directly address this issue. Our data suggest that for imaging 99mTc-labeled radiopharmaceuticals with a multihead gamma camera system, 360° acquisition orbits are preferable.
In most patients, the heart is off center. Although a circular orbit has become standard, lateral offsetting of the imaging table to center the heart is not well feasible with most modern multihead gamma camera systems and fixed gantries. The current series of experiments confirms and further extends our previous observations for 201Tl SPECT imaging using single-detector gamma cameras (4).
The range of off-center positions of the phantom on the imaging table mirrors the off-center position of the heart observed clinically. The eccentricity of the heart can be appreciated easily by reviewing rotating projection images on a computer screen and by measuring the excursion of the apex of the heart from one side to the other side. In 20 consecutive patients in our laboratory, the mean excursion of the heart (±SD) was 11.5 ± 2.5 cm and the range was 7.8–16 cm. Hence, the off-center positions (range, 0–15 cm) simulated in our phantom experiments were similar to the range of normal heart positions in patients.
Acquisition of SPECT images with a 180° orbit may cause significant inhomogeneity of normal images, in particular when the target organ is positioned off center, as is often the case with the normal human heart. Such image artifacts can be avoided by acquiring SPECT images with a 360° orbit. These observations are of clinical relevance because SPECT imaging with 180° orbits is widely used and even recommended in the American Society of Nuclear Cardiology guidelines for cardiac imaging (3). The primary cause for such artifacts is the eccentric position of the heart within the acquisition orbit and stems from the varying spatial resolution, that is, the nonsymmetric and depth-dependent point spread function of the imaging systems (18). When a patient’s heart is not in the center of the orbit, the γ-detector heads are at varying distances from the heart during rotation through the orbit. Segments of the left ventricular walls closest to the detector are better resolved and show apparent localized thinning (better resolution), which may appear as mild perfusion defects. In patient studies, orbit-related artifactual defects are commonly seen at the 11-o’clock and 6-o’clock positions in the more apical short-axis slices (3).
In addition to the straight orientation, we used an angled phantom orientation to simulate the normal position of the heart in a patient’s chest. Percentage variability was significantly greater in the angled orientation for the centered and 5-cm off-center positions. At the 10-cm and 15-cm off-center positions, there was no statistical difference, presumably because of the much greater effect of the off-center positions.
SPECT images of the normal phantom acquired with a 360° orbit showed improved homogeneity (percentage variability), in comparison with images acquired with a 180° orbit, for each eccentric position of the phantom. It was initially unclear whether such improved homogeneity was achieved at the cost of loss of image resolution and decreased detection of defects. The additional acquisition of SPECT images of phantoms with defects of known sizes was designed to address this issue. Defect sizes were quantified against the lower-limit-of-normal phantom circumferential profiles. Positioned in the center of the imaging table, phantom defect size was only slightly underestimated. This is because of the limited spatial resolution of the SPECT imaging system and is in agreement with our previous data on defect size quantification (5,6). With a 180° orbit, defect size was increasingly overestimated with increasingly eccentric positions of the phantom. This finding may explain the clinical observation of exaggerated perfusion abnormality with a 180° orbit. With a 360° orbit, defect sizes were mildly, but systematically, underestimated over the entire range of eccentric positions of the phantom. Thus, although there may be a slight loss in resolution, the ability to detect and quantify a perfusion defect was not affected.
This study had several limitations. We investigated only the isolated effect of 180° and 360° acquisition orbits on quantification of cardiac SPECT imaging. We did not explore all potential confounding variables that might be relevant to clinical imaging. For instance, we did not take into account the potential effect of patient body habitus. One could extend the current phantom study by repeating imaging using a lung-spine phantom. However, such phantoms imperfectly simulate a patient’s chest. In fact, we believe that the principal reason that the described artifacts are not observed in all clinical patient studies is the marked variation in patient body habitus. Figure 1 shows an example of a patient in whom the inhomogeneous count distribution when using a 180° acquisition orbit is quite evident. Chest circumference, tissue attenuation, and photon scatter are likely to be important variables determining the presence or absence of orbit-related artifacts. We also did not introduce patient and cardiac motion and varying left ventricular geometry in our phantom simulations. The phantom was suspended in air to minimize attenuation by the imaging table. In clinical imaging, attenuation by the imaging table is another possible cause of inhomogeneity.
A wooden frame was used to position the phantom as accurately and reproducibly as possible. However, we may not have been entirely successful. We assume that the wavy “normal” circumferential count profiles of the phantom in the center position may be caused by a slight deviation of the long axis of the phantom from the centerline of the table. Indeed, on inspection of the rotating images of the phantom in center position, we noted a slight wobble on cine display.
We presented imaging data acquired with only 1 dual-head SPECT imaging system. However, we performed complementary experiments also using a triple-head gamma camera system. The data acquired by the triple-head camera were entirely consistent with those acquired by the dual-head system and further support our findings. Therefore, we do believe that the current data are of general applicability.
We did not evaluate the effect of different types of collimators but used the low-energy high-resolution parallel-hole collimators commonly applied for cardiac SPECT imaging. The system resolution (full width at half maximum) with these collimators for 99mTc (140-keV photopeak) ranged from 4.15 to 16.26 mm at a source-detector distance ranging from 0 to 30 cm. Thus, spatial resolution was significantly affected by the distance between the target organs and detectors. It is feasible that the effect shown in this study may be mitigated by the use of different collimators. We also did not investigate the effect of body contour orbits. Our previous work suggested that such orbits can be expected to aggravate orbit-related artifacts (4).
CONCLUSION
Acquisition of cardiac SPECT images using a 180° orbit may result in quantifiable image inhomogeneity. This is more pronounced when the heart is not in the center of the orbit, as is usually the case in clinical imaging. The myocardial perfusion defect size derived from SPECT quantification may also be overestimated when the heart is off center. To avoid artifactual and erroneous myocardial perfusion defects on cardiac SPECT images using 99mTc-labeled agents, a 360° circular acquisition orbit may be preferred over the currently recommended 180° orbit.
Acknowledgments
The authors acknowledge George Zubal, PhD, for constructive discussions and Oleg Drozhinin, MD, and Wendy Bruni for technical assistance. The authors also acknowledge Avi Bar-Shalev of General Electric Medical Systems, Haifa, Israel, for providing the cardiac phantom, the low-energy high-resolution collimator data, and software assistance.
Footnotes
Received Oct. 17, 2001; revision accepted Mar. 26, 2002.
For correspondence or reprints contact: Yi-Hwa Liu, PhD, Section of Cardiovascular Medicine, Department of Internal Medicine, Yale University School of Medicine, P.O. Box 208017, New Haven, CT 06520-8017.
E-mail: yihwa{at}liu.med.yale.edu
REFERENCES
In this issue


Jump to section
Related Articles
Cited By...
- Variability in Heart-to-Mediastinum Ratio from Planar 123I-MIBG Images of a Thorax Phantom for 6 Common {gamma}-Camera Models
- False-Positive Findings on Myocardial Perfusion SPECT
- Effect of Acquisition Orbit on SPECT in Phantoms
- Cardiac SPECT: 360{degrees} Circular Acquisition May Resolve Defects of 180{degrees} Data