


Abstract
It has recently been suggested that, similar to MRI, CT can be used to detect infarcts at high resolution by delayed myocardial contrast enhancement. In cardiac PET/CT, this ability to detect infarcts may increase the versatility and integrative potential of PET and CT study components. We sought to determine the feasibility of delayed CT-enhancement in the PET/CT environment and compared it with PET-defined rest perfusion for the measurement of infarct size. Methods: Experimental myocardial infarction was induced in 10 young farm pigs by occlusion and reperfusion of the left anterior descending coronary artery. After 4–6 wk, the animals underwent 64-slice PET/CT. Rest perfusion was measured by 13N-ammonia PET. Then, 120 mL of contrast were injected, and retrospectively gated helical CT was performed for angiography and after 1.5-, 5-, 10-, and 15-min delays. Two days later, 6 pigs again underwent contrast-enhanced CT, using a low-radiation-dose approach (prospective gating and thicker slices as used for clinical calcium scoring) and the same delay times. Polar maps of PET perfusion and CT myocardial enhancement were created for further analysis. Results: CT Hounsfield units (HUs) in the infarct area started to exceed those of arterial blood at 5–10 min after contrast injection, and the ratios of infarcted myocardium to remote myocardium and of infarcted myocardium to blood plateaued at around 1.9 and 1.2 between 10 and 15 min. Excellent agreement between high- and low-dose CT acquisitions (R = 0.87, P < 0.001) was demonstrated. At 10 min, CT infarct size (area with HU > 3.5 SDs from remote) was 30% ± 8% of the left ventricle, using the low-dose approach. The PET perfusion defect size (area with uptake < 60% of the left ventricular maximum) was comparable at 31% ± 8% of the left ventricle (range, 17%−44%). Using a 16-segment myocardial model, we showed an excellent inverse relationship between regional ammonia retention and contrast enhancement (R = −0.93, P < 0.001). Conclusion: In our animal model, infarct size can be measured accurately and reproducibly using cardiac PET/CT with delayed CT-enhancement. For measurement, a low-dose, prospectively gated acquisition was comparable to higher-dose spiral CT. These results provide a rationale for further clinical work to explore whether delayed CT-enhancement can improve the accuracy of myocardial viability assessment, substitute for rest studies in perfusion imaging, or improve localization of PET-derived molecular signals.
Delayed enhancement of the contrast agent gadolinium–diethylenetriaminepentaacetic acid has been successfully imaged with MRI to identify location, extent, and transmurality of myocardial infarction (1,2). Delayed enhancement has been used clinically to detect occult infarcts (3,4), to predict functional recovery after revascularization (5,6), and to identify risk for future cardiac events (3,7).
More recently, the feasibility of multislice CT for the measurement of delayed radiographic contrast enhancement has been demonstrated in preclinical and clinical studies (8–13). This method has been validated against MRI and against ex vivo measurements of infarct size (9–11,13). Although the reported clinical experience is still limited, delayed CT-enhancement promises to equal the longer-established MRI approach.
Delayed CT-enhancement adds a new perspective to imaging systems. An increasing fraction of PET/CT and SPECT/CT cameras is now equipped with multislice CT components, which allow for the combination of diagnostic nuclear cardiology and CT procedures within a single session (14,15). Delayed CT-enhancement may be used as part of imaging protocols to refine the measurement of infarct size, the assessment of myocardial viability, and the localization of molecular nuclear imaging signals in the infarct area and its border zone.
Therefore, we sought to conduct an initial proof-of-concept study to investigate the feasibility of delayed enhancement in the PET/CT environment by studying the kinetics of the contrast agent, by comparing different CT acquisition protocols, and, finally, by comparing CT-derived infarct size with that from rest perfusion PET in an animal model of chronic myocardial infarction.
MATERIALS AND METHODS
Animal Model
Myocardial infarction was induced in 10 young farm pigs (25–35 kg), as previously described (16). Balloon occlusion of the mid–left anterior descending coronary artery (LAD), immediately distal to the second diagonal branch, was performed for 150 min under fluoroscopic guidance and general anesthesia (induced with ketamine, xylazine, and telazol maintained with 1.2%−2.0% isoflurane). To prevent fatal arrhythmia, lidocaine was administered prophylactically and ventricular fibrillation was treated by rapid cardioversion. Postoperative treatment included narcotics and nonsteroidal antiinflammatory drugs (ketorolac tromethamine). PET/CT was performed at 4–6 wk after the procedure, with the animals under general anesthesia. The experimental protocol was approved by the Institutional Animal Care and Use Committee, and the animals were maintained in accordance with the guiding principles of the American Physiologic Society.
PET/CT Image Acquisition
All imaging was performed using a Discovery Rx VCT scanner (GE Healthcare), equipped with a lutetium yttrium orthosilicate PET component and a 64-slice CT component.
PET.
The animals were positioned supine in a cradle; a CT scout scan and a low-dose CT scan (120 kV, 80 mA) for attenuation correction of PET were performed. Then, 370–555 MBq of 13N-ammonia were infused, and list-mode PET data (VIP; GE Healthcare) were acquired for 20 min. List-mode data were resampled to static (5-min prescan delay) and ECG-gated (8 bins for the cardiac cycle) datasets, and attenuation-corrected images were reconstructed using an ordered-subset expectation maximization iterative algorithm (slice thickness, 3.3 mm). Alignment between PET and CT for attenuation correction was checked using commercial software (ACQC; GE Healthcare) and was excellent in all animals, probably because of the lack of motion during general anesthesia.
Contrast-Enhanced CT.
Immediately after the PET scan, diagnostic CT was started. The animals were not medicated in advance with β-blockers or nitrates. Ventilation was stopped for each acquisition, for breath-hold simulation. A total of 120 mL of contrast agent (iodixanol [Visipaque], 320 g/mL; GE Healthcare) was injected at a rate of 5 mL/s through a femoral vein, and a first CT image was acquired with a fixed delay of 25 s for coronary angiography. The same CT acquisition was then repeated at 1.5, 5, 10, and 15 min after contrast injection to measure myocardial contrast kinetics. The standard scan parameters used for a high-resolution coronary angiography were used in our study and were the same for all acquisitions (retrospective ECG-gating; helical acquisition; pitch, 0.24; slice thickness, 0.65 mm; rotation time, 350 ms; 120 kV; 600 mA; effective dose, ∼18 mSv).
Two days later, 6 of the 10 animals underwent a second study and were again positioned in the PET/CT scanner, under general anesthesia. Another series of delayed CT scans was acquired, using the same contrast injection and image timing protocol as that used in the first study (no early angiography was performed with this low-dose protocol). For this low-dose CT acquisition, scan parameters similar to those used for clinical coronary calcium scoring were used (prospective gating, 70% delay from R wave, step-and-shoot, 3.3-mm slice thickness, 120 kV, and 500 mA; effective dose, ∼2 mSv).
Data Analysis
PET.
Left ventricular (LV) myocardial activity on PET images was volumetrically sampled, and polar maps were generated using previously validated software (17) (Fig. 1). Polar maps were normalized to the individual maximum, and a threshold of 60% was applied to measure defect size (18), which was expressed in percentage of the polar map and thus percentage of the left ventricle. Additionally, the standard American Heart Association 17-segment model was applied to determine regional ammonia retention. To match CT data, the apical segment was excluded from the analysis, leaving 16 segments for comparison.
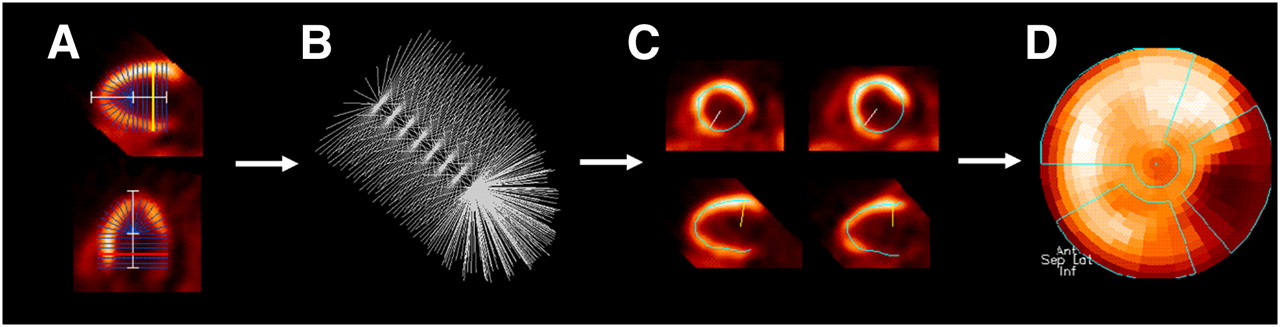
Schematic of PET polar map analysis. (A) Long axis of left ventricle is defined in 2 different views. (B) A 3-dimensional brush of 460 search rays is placed along long axis and used for volumetric sampling. (C) Segmental myocardial activity is defined as maximum along each search ray. (D) Activity for all segments is displayed in polar map. Polar maps show apex in center, base in periphery, anterior wall on top, septum on left, inferior wall on bottom, and lateral wall on right.
Contrast-Enhanced CT.
All CT datasets were reformatted to LV short-axis images (thickness, 3.3 mm), to achieve comparable thickness for all methods. As previously described for delayed-enhancement MRI (19), epi- and endocardial contours of the entire left ventricle were semiautomatically traced. Mid-myocardial circumferential density in Hounsfield units (HUs) was automatically calculated within all short-axis slices, excluding the LV outflow tract and the most apical slice to avoid partial-volume effects. The mid myocardium was defined as the second and third quarter of the distance between the endocardial and epicardial contours in 36 radial segments per short-axis slice. To create a polar map to match the PET format, circumferential profiles of mid-myocardial density were created from short-axis slices and transformed (Fig. 2). Regions of interest were then placed manually in the remote inferolateral myocardium on the polar map (covering an area of ∼15%) and in the center of the LV blood pool on 3 continuous short-axis slices (diameter of each, ∼2 cm). Infarct size was measured on the polar maps using 3 different thresholds of HUs above 2.5, 3.5, or 4.5 SDs from the mean of the remote myocardium. Additionally, the standard American Heart Association 17-segment model was applied to determine regional HUs in 16 segments (apex excluded because of short-axis image analysis).

Schematic of CT polar map analysis. (A) Volumetric CT data are reoriented along cardiac long axis, and short-axis slices from apex to base are created. (B) Myocardial contours are semiautomatically defined in all short-axis slices. Mid-myocardial density is used for further analysis and defined as average of second and third quarter of distance between endo- and epicardium. (C) Circumferential density profiles are created for each slice. (D) All slices are combined and density is displayed in polar map. Apex is omitted to avoid partial-volume effects in short-axis slice analysis.
Statistical Analysis
Data are presented as mean ± SD. The Med-Calc statistical software package (version 9.3.0.0; Mariakerke) was used. Two-tailed, paired t tests were used to assess differences between continuous variables. Pearson correlation coefficients were calculated to define the relationship between PET and different CT parameters, with Fisher r-to-z conversion used to determine significance. Additionally, the Bland–Altman method was used to analyze for agreement. The coefficients of variability (SD of the difference between 2 measurements over the mean of the 2 measurements) were calculated as a measure of agreement between PET and CT infarct sizes. A P value of less than 0.05 was used to define statistical significance.
RESULTS
PET
All animals showed rest perfusion defects in the distal anteroseptal wall, consistent with prior experimental LAD occlusion or reperfusion. Polar map analysis revealed an infarct size of 31% ± 8% of the left ventricle (range, 17%−44%). Gated studies showed regional hypokinesia in the area of the perfusion defect, with an LV ejection fraction of 41% ± 6%.
Kinetics of Radiographic Contrast
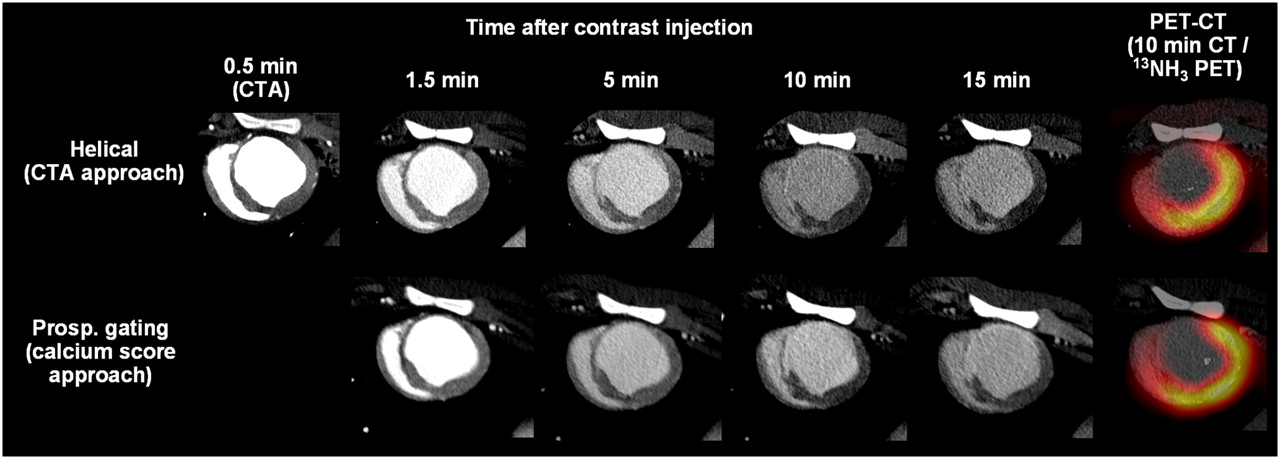
Figure 3 shows representative examples of CT images at different times after contrast injection. Maximum HUs were 191 ± 25, 200 ± 26, 177 ± 27, and 162 ± 25 in the anteroseptal infarct zone and 126 ± 23, 115 ± 16, 96 ± 14, and 86 ± 15 in the noninfarcted remote myocardium at 1.5, 5, 10, and 15 min after injection, respectively. Average arterial blood HUs were 302 ± 56, 214 ± 29, 167 ± 25, and 147 ± 22 at 1.5, 5, 10, and 15 min, respectively. Infarct-to-blood and infarct-to-remote ratios at different times are summarized in Figure 4. Infarct HUs started to exceed those of blood between 5 and 10 min, and both infarct-to-blood and infarct-to-remote ratios started to plateau between 10 and 15 min, suggesting that robust infarct imaging can be done as early as 10 min after contrast delivery.

Corresponding mid-ventricular short-axis slices for different CT acquisitions in representative animal. Shown are images at various times after contrast injection for higher-dose helical CT acquisition (top) and lower-dose CT acquisition using calcium score protocol (bottom). Note improved enhancement in anteroseptal infarct area vs. blood and remote myocardium over time. Also shown are fusion images of CT and rest perfusion PET (right). CTA = CT coronary angiography; Prosp. = prospective.
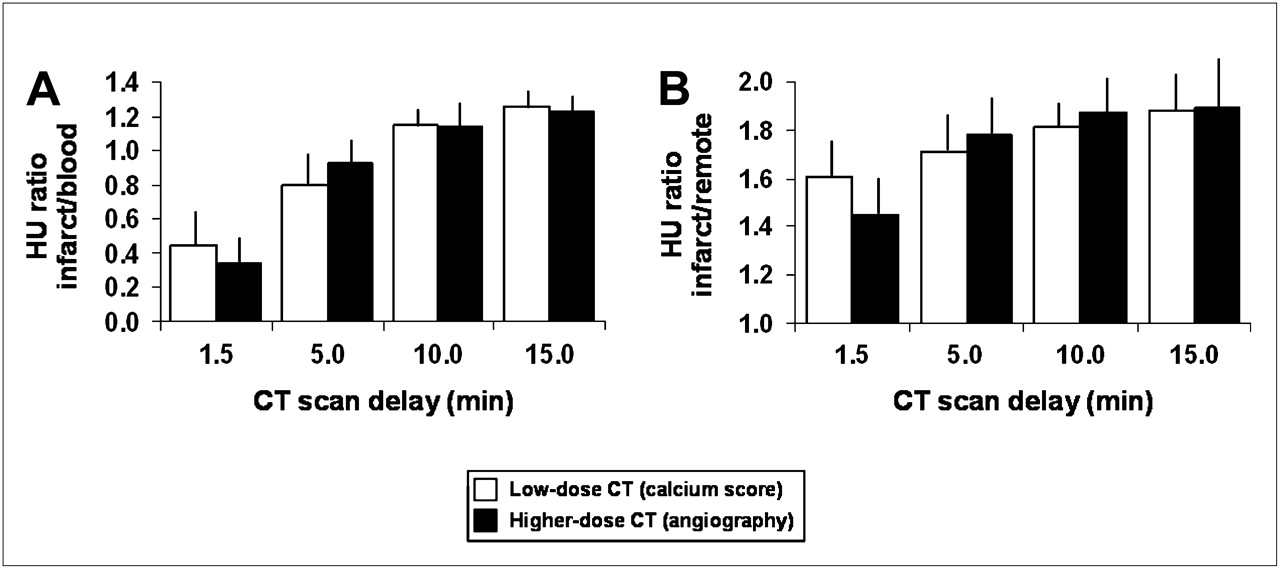
Bar graphs for mean and SD of ratio of HUs in infarct area vs. blood (A) and infarct area vs. remote myocardium (B). Mean ± SD of 6 animals that underwent both CT acquisition protocols are shown.
Comparison of Low-Dose and Helical CT Protocols
No significant differences in infarct-to-blood and infarct-to-remote ratios were observed between the low-dose (calcium scoring) CT and the higher-dose helical (angiography) CT approaches (Fig. 4). Also, there were strong, significant correlations and good agreement between the low- and the high-dose approaches for average HUs in infarcted myocardium, remote myocardium (Fig. 5), and blood (R = 0.93, P < 0.001), and there were significant correlations for infarct-to-blood and infarct-to-remote ratios between CT approaches (R = 0.89 and R = 0.72; P < 0.001, respectively).
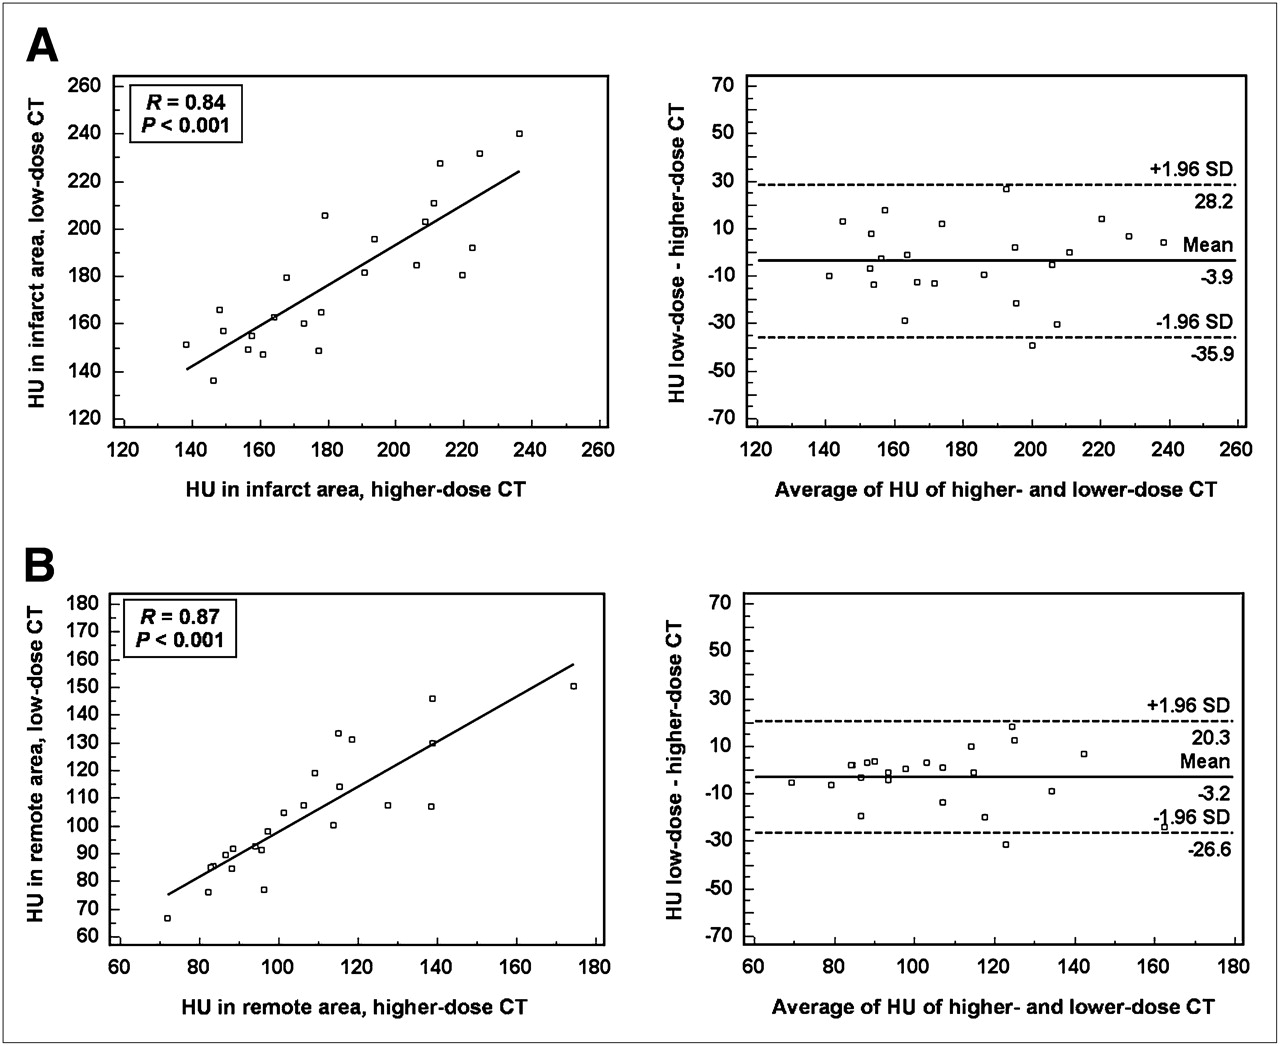
Linear regression plots (left) and Bland–Altman plots (right) for HUs in infarct area (A) and remote myocardium (B) using low-dose (calcium score) CT acquisition vs. higher dose (angiography) CT acquisition. Acquisitions at all times after contrast injection for available 6 animals were used.
Quantification of Infarct Size by CT
Polar maps of 10-min delayed images were chosen for comparison of different thresholds for quantification of infarct size. For the high-dose CT approach, infarct size was 27 ± 7, 30 ± 8, and 37% ± 7% of the left ventricle for HU thresholds of 4.5, 3.5, and 2.5 SDs, respectively, above the average of remote myocardium (n = 10). For the low-dose approach, the respective infarct sizes were 29 ± 5, 33 ± 5, and 40% ± 5% of the left ventricle for the 3 thresholds (n = 6). Infarct size measurements from high- and low-dose approaches correlated significantly (R = 0.91, P < 0.001).
Comparison of Ammonia PET and Delayed CT-Enhancement
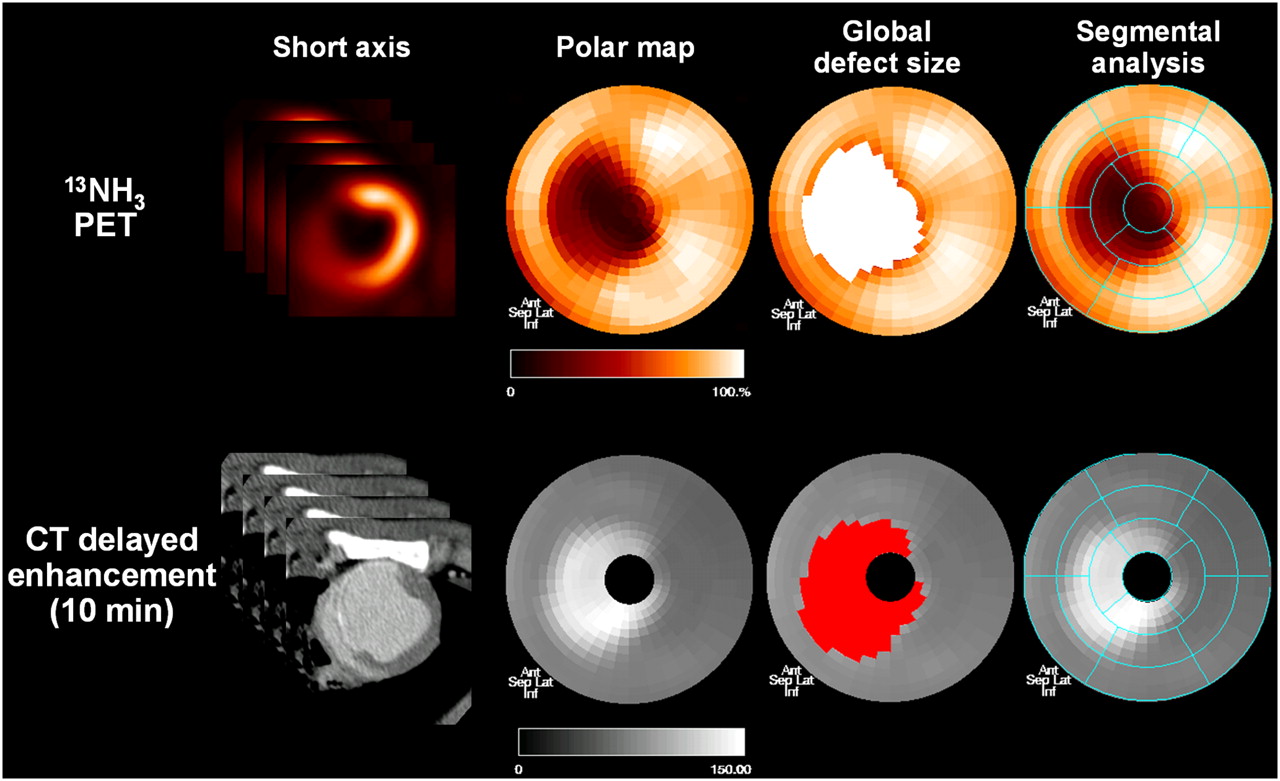
Representative examples of PET and CT polar maps are shown in Figure 6. Although CT infarct size on 10-min delayed images using a 4.5-SD threshold was on average 6% lower than the PET defect size (P = 0.02), infarct size tended to be on average 4% higher using the 2.5-SD threshold (P = 0.09). The best quantitative agreement was seen for a 3.5-SD threshold (2% difference for PET, P = 0.29). The coefficient of variability for PET defect and CT infarct size was lowest at 6% for the 3.5-SD threshold (vs. 12% at 2.5 and 21% at 4.5 SDs).

Representative rest perfusion PET (top) and low-dose delayed CT-enhancement images (bottom) in pig with chronic LAD infarction. Shown are mid-ventricular short-axis slices, polar maps of entire LV myocardium, polar maps showing global defect sizes in colored area after threshold analysis (60% of maximum for PET, 3.5 SDs above mean of remote myocardium for CT), and polar maps showing segmental model for regional analysis. Polar maps show apex in center, base in periphery, anterior wall on top, septum on left, inferior wall on bottom, and lateral wall on right.
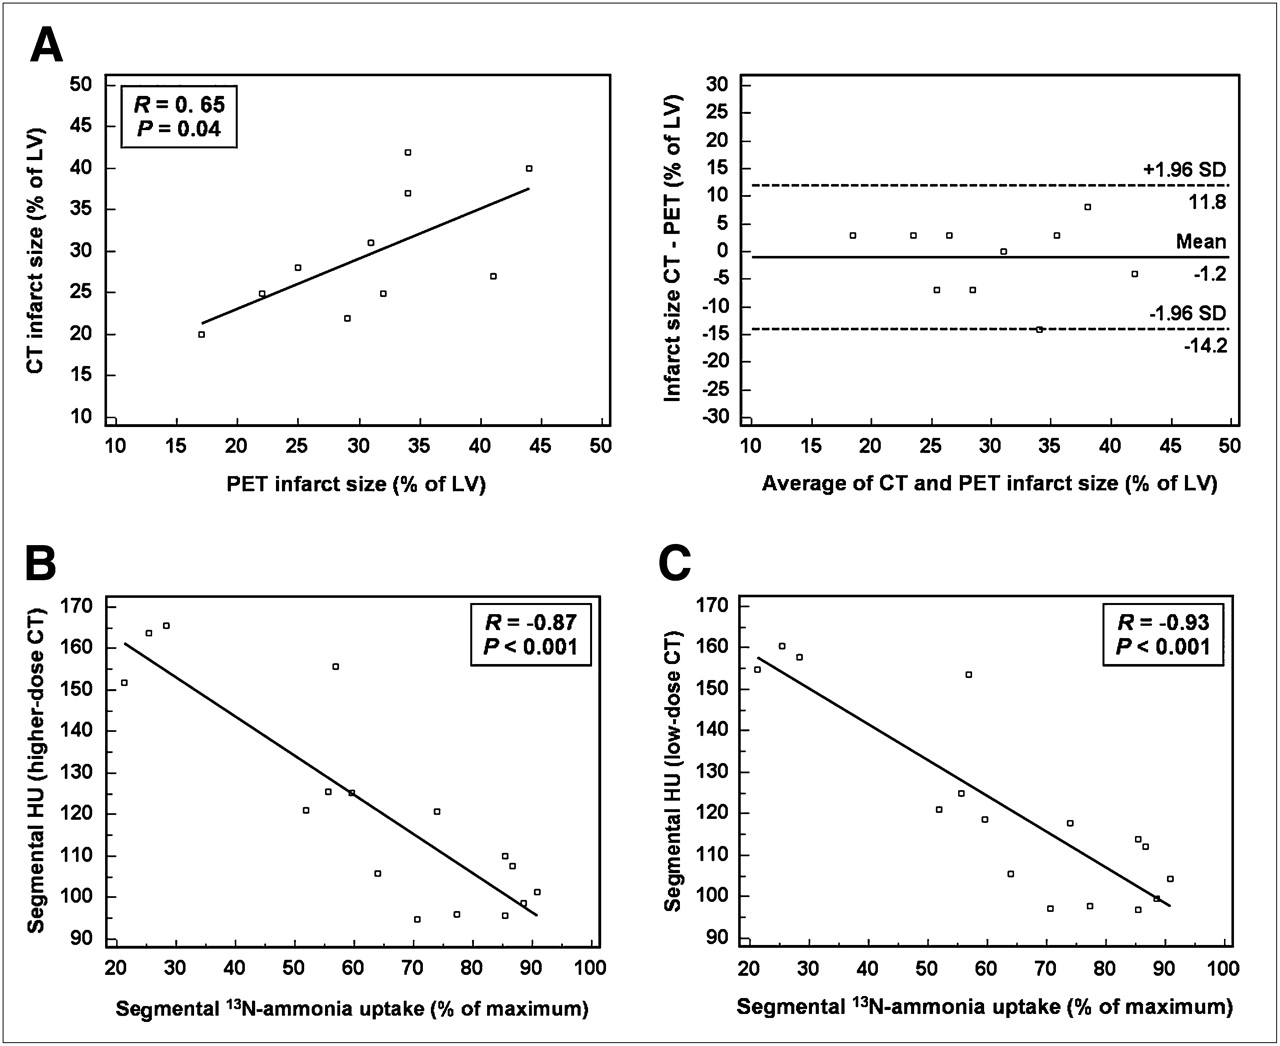
Global infarct size in all animals correlated significantly between PET and CT, despite the limited range and small sample size (R = 0.65, P = 0.04; Fig. 7A). In addition, the regional PET and CT signal in 16 myocardial segments (excluding the apex) showed an excellent inverse relationship between segmental 13N-ammonia retention and delayed CT-enhancement (R = −0.93, P < 0.001; Figs. 7B and 7C).

Agreement of CT and PET. (A) Regression plot and Bland–Altman plot for global infarct size measured by 10-min delayed enhancement using higher-dose angiographic acquisition and defect size from 13N-ammonia PET (thresholds used are 60% of maximum for PET, 3.5 SDs above mean of remote myocardium for CT; n = 10). (B) Regression plot for average retention of 13N-ammonia at rest in 16 myocardial segments vs. average HUs per segment at 10 min after contrast injection, imaged by high-dose and low-dose (C) CT. Data for B and C are derived from 6 animals imaged by both CT techniques.
DISCUSSION
Our results using PET/CT show that imaging of delayed contrast enhancement by CT is feasible, reproducible, and accurate in a porcine model of chronic myocardial infarction. For the purpose of infarct imaging, a low-dose CT acquisition (as is used for clinical calcium scoring) yielded comparable results to a higher-dose CT acquisition (as is used for clinical coronary angiography). Contrast enhancement in the infarct area relative to remote myocardium and blood plateaued at 10 min after the injection. In addition, the quantification of global infarct size (using a threshold of 3.5 SDs above the mean of remote myocardium for mid-myocardial HUs) and regional enhancement in 16 myocardial segments correlated well with the results of rest 13N-ammonia perfusion PET.
The mechanism of delayed myocardial hyperenhancement in injured myocardial territories on CT after iodinated contrast administration is thought to be similar to that proposed for delayed gadolinium enhancement in MRI (20) and probably related to an increase in extravascular, extracellular volume in damaged myocardium. Early hypoenhancement has also been proposed as a hallmark of myocardial damage. Hypoenhancement, however, may not always be encountered in the case of reperfusion of the infarct territory, especially in chronic infarction (11), and its detection may be complicated by artifacts from hyperdense contrast in the cavity, which is next to the thin, chronically infarcted wall. Our analysis was, therefore, limited to delayed CT-hyperenhancement. This signal has been validated in several studies, against histologic infarct staining (10,13,21,22) and against delayed MRI-enhancement (8,10,11); thus, these independent techniques were not included in our present study.
13N-ammonia uptake has been shown to correlate with flow and viability over a wide range of physiologic conditions (23–26), except for the extreme situation of severely hypoperfused but viable myocardium (27), which is not expected in our model of reperfused chronic infarction. The quantification of infarct size using a threshold of 60% of the LV maximum has previously been shown to be accurate for the measurement of infarct size in a validation study in human explanted hearts (18), and rest perfusion defects are frequently used to identify infarcts in the clinical setting of rest–stress perfusion imaging (28,29). The excellent, inverse relationship between delayed CT-enhancement and rest 13N-ammonia uptake and the agreement of defect sizes, therefore, support the feasibility of CT for infarct detection and quantification.
The aim of our study was to stimulate novel approaches to the practice of cardiac PET/CT. The availability of multislice CT components in PET/CT systems is continually increasing, and diagnostic contrast-enhanced CT angiography is likely to be combined more frequently with PET in cardiac PET/CT sessions (14,15). If confirmed in further clinical studies, delayed enhancement imaging may increase the versatility of cardiac PET/CT protocols by enabling the detection of myocardial infarction at high resolution, using the contrast dose that has already been injected for angiography. Several clinical scenarios may be tested. First, delayed enhancement imaging may substitute for the rest perfusion study in rest–stress perfusion imaging for the workup of coronary artery disease. Second, implementation of delayed CT-enhancement imaging in the assessment of PET/CT myocardial viability protocols may refine diagnostic and prognostic power. Finally, integration of a CT-derived infarct area and infarct border zone with PET-derived molecular imaging signals may facilitate the implementation of novel imaging strategies (16,30,31).
Radiation exposure is an increasing concern for diagnostic cardiac imaging studies (32) and has also been a concern for delayed CT-enhancement studies because of the repeated CT acquisition. Our study included a comparison of a standard helical cardiac CT acquisition as used for CT angiography with a lower-dose CT protocol with thicker slice sampling and prospectively gated acquisition as clinically used for unenhanced coronary calcium scoring. The latter results in an average effective dose of 2 mSv according to dose–length products, which represents a reduction of dose by 89%. Both CT techniques were found to be comparable for the measurement of infarct size, probably because high resolution is not needed for myocardial imaging. In the clinical studies that may follow our experimental proof of concept, delayed CT-enhancement can thus be measured using calcium-score–like acquisition protocols. The radiation exposure from a rest 13N-ammonia study as in our protocol would be equal at 1.5–2 mSv. The advent of novel step-and-shoot approaches for CT angiography, which will reduce radiation exposure from angiography to 2–5 mSv (33,34), provides a combination of stress perfusion PET (2 mSv), CT angiography (2–5 mSv), and delayed CT-enhancement infarct imaging (2 mSv) that can be performed under 10 mSv and thus at a radiation exposure that is in the range of most current clinical protocols for myocardial perfusion SPECT (32). The risk of nephrotoxicity from contrast would remain, although it should be considered that delayed CT-enhancement would make use of contrast injected previously for CT angiography.
Some limitations of our study need to be considered. First, we used a model of LAD occlusion and reperfusion, which resulted in mostly transmural chronic myocardial infarction in the distal anteroseptal wall. Therefore, it is difficult to extrapolate our results to other infarct locations and smaller nontransmural infarcts. The detection of nontransmural infarcts may be more difficult with CT, where the blood-pool contrast may interfere, than with MRI, where the blood pool can be suppressed by sequencing. Our initial results should nevertheless be seen as a stimulus for subsequent larger clinical trials, including more heterogeneous patterns of myocardial damage. Second, the measurement of infarct size from a CT scan was performed using mid-myocardial density, to avoid contamination from the blood signal in case of inaccurate endocardial contour definition. This method worked well for our mostly transmural infarcts but may need to be reevaluated for subendocardial infarcts, which may be underestimated. Other issues to be considered for translation of our technique to the clinical setting are the contrast dose and the type of contrast agent. We used iodixanol at a volume of 120 mL, which is well within the range of volume for clinical contrast-enhanced CT studies. Our contrast protocol was similar to that of a prior validation study (13). But the absolute concentration of contrast per body mass in our young animals was higher than that expected in humans, and other contrast agents may theoretically show slight differences in their tissue kinetics. Also, we did not compare our in vivo results with ex vivo measurements of infarct size because animals were kept alive for other research purposes that were not included in this project. Several studies, however, have already shown that both delayed CT-enhancement and 13N-ammonia perfusion defects correlate well with histology (10,13,18). Our study is new and is the first, to our knowledge, to compare PET and CT signals obtained by the same imaging system. Further work is necessary to establish clinical protocols and translate our experimental groundwork into clinical practice.
CONCLUSION
In a pig model of chronic myocardial infarction, infarct size can be measured accurately and reproducibly by cardiac PET/CT and delayed CT-enhancement. A low-dose prospectively gated acquisition can be applied as early as 10 min after contrast injection to achieve measurements comparable to those found by rest perfusion PET. Our experimental results provide a rationale for further clinical work to explore whether and how CT-delayed enhancement can refine clinical cardiac PET/CT protocols.
Footnotes
-
COPYRIGHT © 2009 by the Society of Nuclear Medicine, Inc.
References
- Received for publication July 22, 2008.
- Accepted for publication October 15, 2008.


Jump to section
Related Articles
Cited By...
- Molecular Hybrid Positron Emission Tomography/Computed Tomography Imaging of Cardiac Angiotensin II Type 1 Receptors
- Comparison of Initial Cell Retention and Clearance Kinetics After Subendocardial or Subepicardial Injections of Endothelial Progenitor Cells in a Canine Myocardial Infarction Model
- Integration of Infarct Size, Tissue Perfusion, and Metabolism by Hybrid Cardiac Positron Emission Tomography/Computed Tomography: Evaluation in a Porcine Model of Myocardial Infarction
- Cardiac Positron Emission Tomography