


Abstract
The aim of this study was to assess the prognostic and predictive value of early quantitative 18F-FDG PET to monitor therapy with an antibody to the insulinlike growth factor 1 receptor (IGF-1R antibody) in patients with Ewing sarcoma family of tumors (ESFT). Methods: 18F-FDG PET images at baseline and approximately 9 d after initiation of IGF-1R antibody therapy in 115 patients with refractory or relapsed ESFT were prospectively obtained as part of the Sarcoma Alliance for Research through Collaboration trial. Responses were centrally evaluated by PERCIST 1.0 in 93 patients. The 9-d PET responses were correlated to overall survival (OS), progression-free survival (PFS), and clinical benefit after 6 wk of therapy based on clinical observation and CT response by World Health Organization anatomic criteria. Results: The median OS was 8.1 mo (95% confidence interval, 6.4–10.0 mo). When PERCIST was used, patients with progressive metabolic disease showed shorter OS (median, 4.7 mo) than patients without progression (median, 10.0 mo; P = 0.001). Progressive metabolic disease on day-9 PET was associated with a significantly higher risk of death (hazard ratio, 2.8; 95% confidence interval, 1.5–5.5). Changes in 18F-FDG uptake after 9 d of therapy had an area under the curve of receiver-operating characteristic of 0.71 to predict 1-y OS. The area under the curve was 0.63 to predict progression at 3 mo and 0.79 to predict clinical benefit after 6 wk of therapy. Conclusion: Treatment response by quantitative 18F-FDG PET assessed by PERCIST 1.0 as early as 9 d into IGF-1R antibody therapy in patients with ESFT can predict the OS, PFS, and clinical response to therapy.
R1507, a recombinant human monoclonal antibody to the insulinlike growth factor 1 receptor (IGF-1R antibody), showed a modest activity in unselected patients with relapsed or refractory Ewing sarcoma family of tumors (ESFT) (1,2). The subgroup of patients with ESFT who will benefit the most from the IGF-1R antibody therapy has not been determined. A pretreatment predictive assay, or an assay of treatment efficacy performed soon after treatment was initiated, would be valuable if it could predict the efficacy of antitumor treatment.
In previous studies, 18F-FDG uptake measured during induction chemotherapy in pediatric patients with ESFT was predictive of progression-free survival (PFS) (3). In another group of patients with osteosarcoma, after only 1 cycle of chemotherapy 18F-FDG PET could predict histologic response (4). The association between early response to targeted therapy assessed by 18F-FDG PET and overall survival (OS) has not been reported in patients with ESFT to our knowledge.
Patients with recurrent or refractory ESFT treated with R1507 from the Sarcoma Alliance for Research through Collaboration (SARC) prospective phase II trial were studied. The goals of this imaging substudy were to evaluate whether early 18F-FDG PET response after 9 d of IGF-1R antibody therapy in patients with ESFT has prognostic value for OS and predictive value for clinical benefit.
MATERIALS AND METHODS
The patients were 2 y or older, had no clinically significant unrelated systemic illness, no immunosuppressive agent within the last 6 mo, no prior therapy with IGF inhibitor, and no other malignant disease diagnosed within the previous 5 y, except for treated nonmelanoma skin cancer or intraepithelial cervical neoplasia. The patients were enrolled from December 2007 through April 2010. There were 31 study locations from North America, Europe, and Australia participating in the trial. Eighty-five patients received 9 mg/kg of R1507 intravenously once a week. In 6 patients who were younger than 21 y, a dose of 27 mg/kg was given every 3 wk for safety assessment. No difference in sarcoma response or patient outcomes was observed between the 2 patient cohorts receiving different drug schedules. Further details regarding the treatment data are available in a previous publication (1). The ClinicalTrials.gov identifier is NCT00642941. The institutional review board approved this study, and all subjects signed a written informed consent form.
Of 115 eligible patients enrolled in the SARC trial, 14 did not undergo baseline 18F-FDG PET (PETbaseline), and 1 patient did not undergo day-9 18F-FDG PET (PETday9) (Fig. 1). Image data for 7 patients had an error to preclude SUV computation, because the data were in counts per second. Quantitative assessment of PET response was possible in 93 patients. Minor technical variations from the imaging protocols necessary to implement PERCIST were found in the images of 79 patients. The details of the technical variations are available in Supplemental Table 1 (supplemental materials are available at http://jnm.snmjournals.org). They were included in the analysis with an exception of 2 patients with a liver average SUV greater than 10.0.

Schema of 18F-FDG PET images included in this study.
18F-FDG PET was obtained at baseline within 4 wk before IGF-1R antibody therapy began, and at a target date of 9 d after the start of therapy (acceptable window of 8–14 d after therapy began), per the SARC-funded therapy protocol. The 18F-FDG PET data were obtained to perform an exploratory analysis of the correlation of 18F-FDG changes in sarcoma with outcomes. The PET data were not used for clinical decision making and did not alter the patient’s therapeutic plans. The PET scanning was performed at the 31 participating institutions using their routine clinical PET scanning protocols. For this study, the digital PET images were collected, quantified, and read at Johns Hopkins by the Image Response Assessment Team, with 2 nuclear medicine physicians reaching a consensus. All images were loaded onto the same reading system, and quantitative data were computed using Mirada XD3 software (Mirada Medical).
For our study, response by 18F-FDG PET was assessed quantitatively by PERCIST 1.0 (5). PERCIST response is based on the measurement of the SUV corrected for lean body mass in a 1-cm3 sphere region of interest from the hottest tumor lesion (SULpeak). The percentage change in SULpeak (%ΔSULpeak) is defined as ([PETbaseline SULpeak − PETday9 SULpeak] ÷ PETbaseline SULpeak × 100). The 4 response categories by PERCIST are complete metabolic response, partial metabolic response when %ΔSULpeak decrease is at least 30% from the baseline and by 0.8 units of the absolute SULpeak, stable metabolic disease, and progressive metabolic disease (PMD) when the increase is greater than 30% and 0.8 units, or a new lesion develops. The PET responses were dichotomized by metabolic response, and the complete metabolic response, partial metabolic response, and stable metabolic disease responses were collectively considered as nonprogressive metabolic disease (non-PMD).
Clinical response at 6 wk was based on observation by the site investigator and the CT findings. CT was obtained at baseline and 6 wk after IGF-1R antibody therapy was initiated. CT studies were performed at each of the participating institutions, and the response was also determined at the treating institution according to World Health Organization criteria (6), which uses bidimensional measurements as a surrogate for tumor burden and 4 response groups: complete response, partial response, stable disease, and progressive disease. The criteria for stopping treatment included unacceptable adverse events, patient decision to withdraw from the study, death, or disease progression as judged by the investigator. Patients having progressive disease response on CT or clinical signs of progression that prevented further treatment were considered as the clinical-nonbenefit group; and the patients with complete response, partial response, and stable disease responses on CT as well as no off-study criteria as seen by the investigator were collectively considered as the clinical-benefit group.
Statistical Analysis
We alternatively defined PET non-PMD at day 9 using a classification tree with 1 split to best separate the survival based on the %ΔSULpeak. Associations of the clinical benefit at 6 wk and the 18F-FDG PET measurements were summarized using box plots and evaluated with Wilcoxon–Mann–Whitney tests and κ statistics.
OS was calculated from the time of the first IGF-1R antibody treatment to the date of death or last clinical follow-up. PFS was calculated from the time of first IGF-1R antibody treatment to the date of progression or death and censored at the last follow-up if no events occurred. Survival times were summarized using the Kaplan–Meier method and were compared using log-rank tests. Hazard ratios were estimated using univariate Cox proportional hazards models. Receiver-operating characteristic (ROC) analysis was done to assess the predictive value of the %ΔSULpeak for clinical nonprogressive disease after 6 wk of therapy. To evaluate the prognostic accuracy of the %ΔSULpeak at day 9 of treatment and of clinical benefit, time-dependent ROC analysis was performed to examine the sensitivity and specificity over time to predict OS and PFS outcomes (7,8). Statistical analyses were performed using the R statistical package (version 2.15.1; The R Project for Statistical Computing).
RESULTS
Of the 115 patients, 101 patients died, and 14 were censored. The age of the patients ranged from 1 to 77 y (median, 21.9 y); 75 were male and 40 were female. The primary tumor location was in the bones in 65 patients and was extraskeletal in 50 patients; and all patients had metastatic disease at the time of enrollment.
Day-9 PET Versus Week-6 Clinical Response
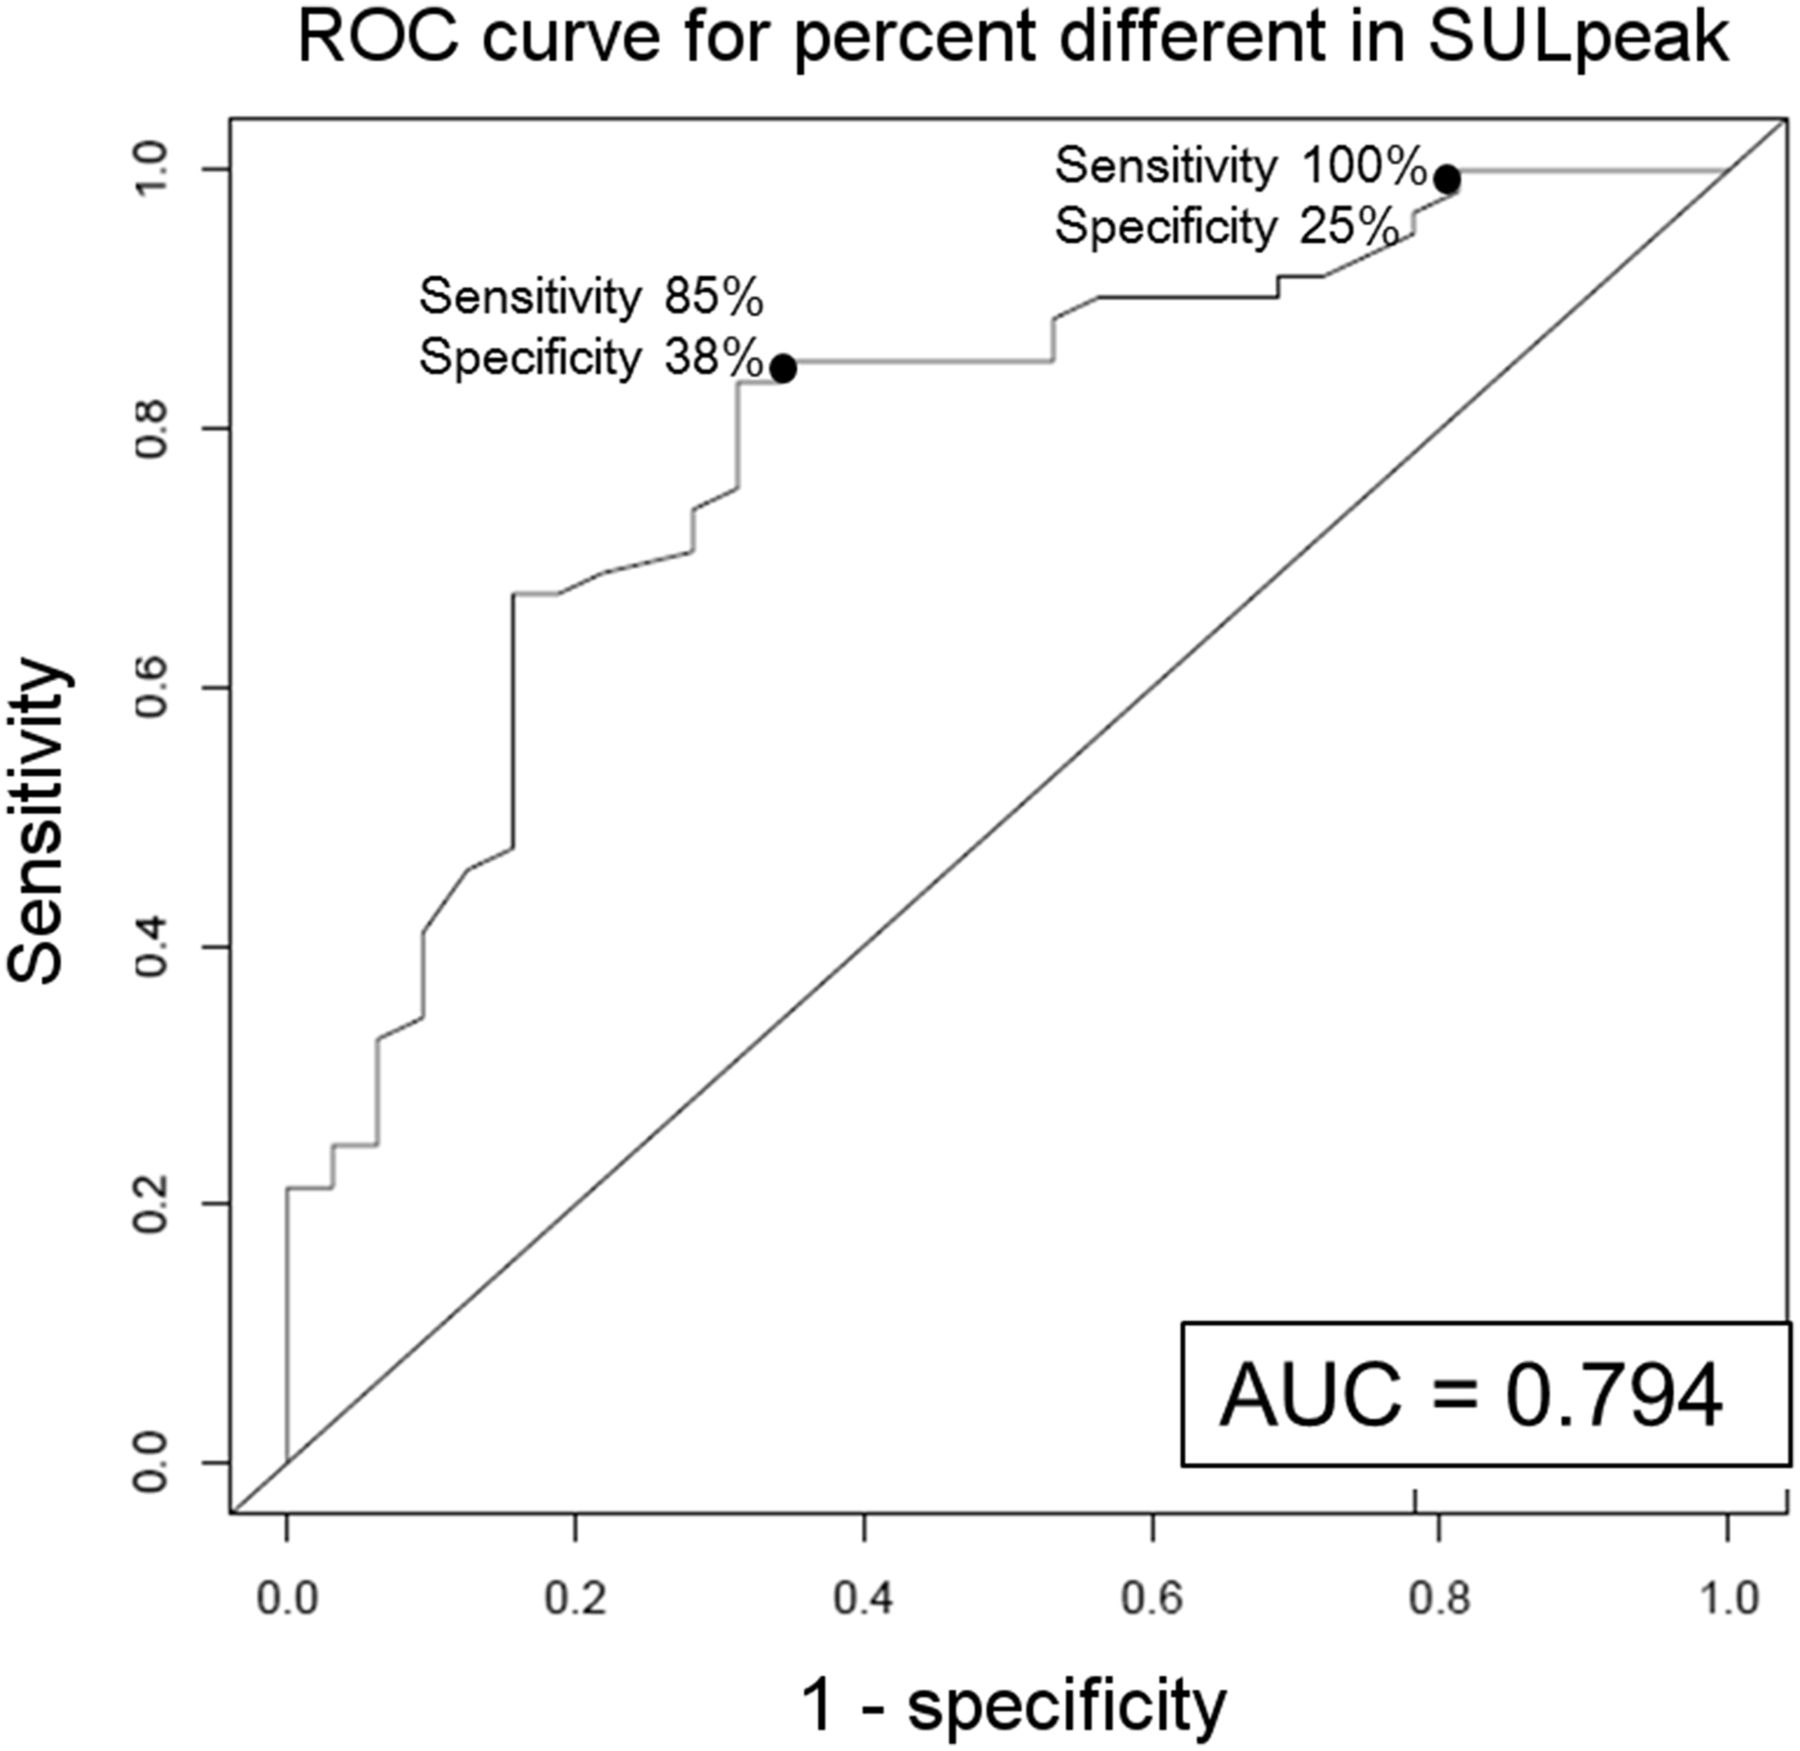
The 18F-FDG PET uptake changes from baseline to 9 d after IGF-1R therapy were measured quantitatively by %ΔSULpeak of the hottest tumor at each time point. The PET measurements according to dichotomized clinical responses at week 6 are shown in box plots in Figure 2. The baseline SULpeak of lesions was not predictive of clinical benefit at 6 wk. The group with clinical nonbenefit had a significantly higher SULpeak on PETday9 and smaller declines in absolute and percentage ΔSULpeak than the clinical-benefit group. The box plots including the outlier data points are in Supplemental Figure 1. The area under the ROC curve (AUC) was obtained, and the correlation of the %ΔSULpeak with the week-6 clinical nonprogressive disease group was 0.79 (Fig. 3).
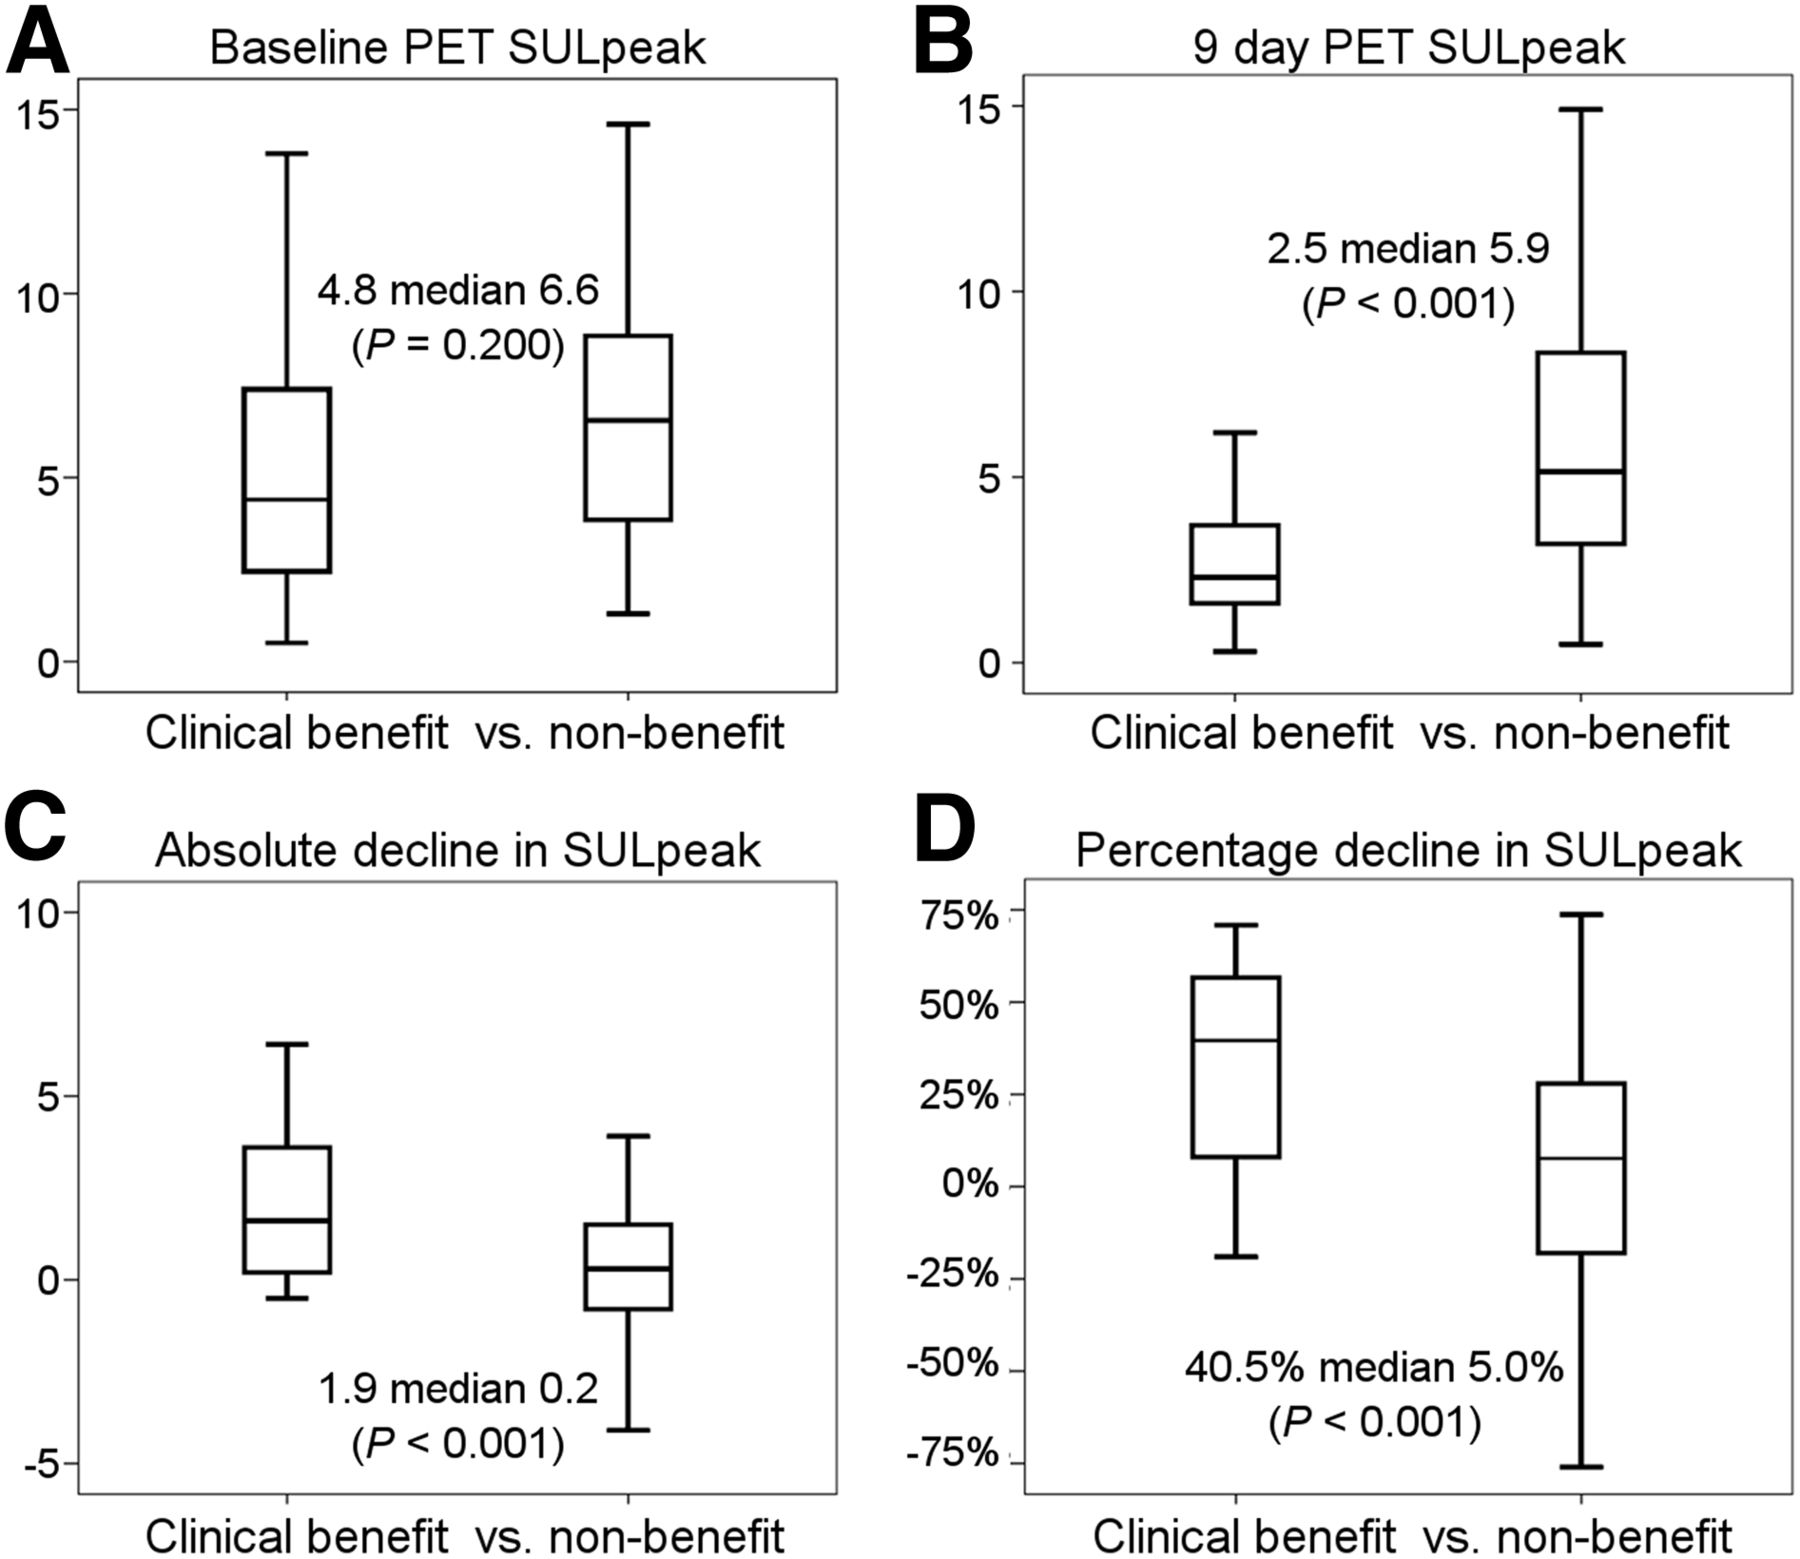
Box plots of SULpeak measurements at baseline and 9 d after therapy and status of clinical response at 6 wk after therapy. Median SULpeak from PETday9 was significantly higher in clinical-nonbenefit group. Absolute and percentage decline in SULpeak was significantly greater in clinical-benefit group.

ROC curve of clinical nonbenefit at 6 wk, using %ΔSULpeak from baseline to 9 d after therapy.
Day-9 PET Versus Week-6 Clinical Response to Predict OS
The median OS was 8.1 mo (95% confidence interval [CI], 6.4–10.0 mo) for the 115 patients. The PET responses 9 d after therapy and the Kaplan–Meier OS estimates are shown in Table 1. Patients with PMD on PETday9 had a significantly shorter survival time than the patients with complete metabolic response, partial metabolic response, or stable metabolic disease.
PET and CT Responses and OS by Each PET Response Category
The Kaplan–Meier estimation of OS using dichotomized PETday9 and week-6 clinical response groups is shown in Figure 4. Day-9 response by PERCIST showed shorter OS in patients with PMD (median, 4.7 mo; 95% CI, 1.2–7.0 mo) than non-PMD (median, 10.0 mo; 95% CI, 6.9–12.9 mo; log-rank P = 0.001). When again dichotomized by best-split cutoff for this study sample, the patients with a %ΔSULpeak decrease less than 10.5% showed shorter OS (median, 5.5 mo; 95% CI, 4.2–6.8 mo) than patients with a decrease greater than 10.5% (median, 11.7 mo; 95% CI, 8.9–18.1 mo). The patients with clinical nonbenefit at week 6 also had shorter OS than patients with clinical benefit (median, 5.6 mo, and 95% CI, 4.2–7.7 mo, vs. median, 13.9 mo, and 95% CI, 10.3–18.6 mo; log-rank test P < 0.001).

Kaplan–Meier estimation of OS by dichotomized day-9 PET response assessed by PERCIST (A), %ΔSULpeak from PETbaseline to PETday9 (B), and week-6 clinical response based on World Health Organization criteria assessment of week-6 CT and clinical observation. CMR = complete metabolic response; PMR = partial metabolic response; SMD = stable metabolic disease.
The dichotomized clinical response, based on the week-6 CT plus clinical observation, and the dichotomized PERCIST response, based on PETday9, had a slight agreement with concordance in 44% of the cases (κ, 0.10). When dichotomized again using the best split cutoff of 10.5% decline in %ΔSULpeak, the concordance was 70% (κ, 0.41).
The different PET measurements, including the SULpeak changes from PETbaseline to PETday9, were associated with survival at different time points including 6, 12, 18, and 24 mo after therapy by ROC analysis, as plotted in Supplemental Figure 2. The PETday9 SULpeak had an AUC of 0.75 for survival at 1 y, and the %ΔSULpeak had an AUC of 0.71 at 1 y. The PETday9 response of PMD, higher SULpeak at PETbaseline or PETday9, and a rise in SULpeak from PETbaseline to PETday9 all showed increased hazard ratios for death at all the time points (Table 2). The OS did not differ according to the site of the primary tumor, extraskeletal versus bone, in this subset analysis of patients with PET images available for quantitative assessment (hazard ratio, 1.04; 95% CI, 0.7–1.54). The trade-offs of sensitivity and specificity of the day-9 PERCIST and week-6 clinical responses to predict survival at different time points can be seen in Supplemental Figure 3.
Proportional Hazard Models for Mortality
Day-9 PET Versus PFS
The predictive value of day-9 PET for PFS is discussed in the supplemental data. The ROC curves of the PET measurements for PFS status at different time points are shown in Supplemental Figure 4.
Glucose Level
The fasting serum glucose level before and 2 wk after IGF-1R therapy were compared in 100 of the 115 patients in this study. The glucose levels were not statistically different before or after therapy (99.5 ± 27.0 vs. 100.8 ± 33.6 mg/dL; P = 0.68).
Tumor Site
Though the SARC-11 study reported higher response rate in patients with bone primary than patients with extraskeletal primary (1), in this study subpopulation with PERCIST analysis the OS did not differ significantly according to the site of the primary tumor (hazard ratio, 1.04; 95% CI, 0.7–1.54). However, in an exploratory analysis, a statistically significant interaction was observed between the site and PET parameters of absolute SULpeak decrease greater than 0.8 units and %ΔSULpeak decrease greater than 30% (interaction term P, 0.018 and 0.036, respectively), consistent with higher likelihood of response in patients with bone primary. This suggests that the prognostic effects of early PET response may depend on the site of the primary tumor in this subset of patients with quantitative PET analysis as well.
SUVmax
We also measured the SUVmax and analyzed the PET response according to recommendations of the European Organisation for Research and Treatment of Cancer. For predicting survival at 1 y after therapy, the baseline SUVmax had an ROC AUC of 0.631, and the percentage change in SUVmax had an ROC AUC of 0.691. The OS of responder versus nonresponder based on recommendations of the European Organisation for Research and Treatment of Cancer was 305 d (95% CI, 239–371) versus 151 d (95% CI, 123–179).
Further PET Follow-up
Only 26 patients had PET assessment at week 12, and thus further evaluation of the later PET studies was not performed (Supplemental Table 2). Understandably, the patients who underwent week-12 18F-FDG PET were those with better response at day 9 because they survived longer. Only 2 patients showed greater improvement after further therapy. Thirteen patients showed worsened response (46%); 11 patients (42%) had the same response on early and late PET images.
DISCUSSION
The signaling pathway for the IGF is regulated by growth hormone and is involved in cell growth, human development, and metabolism (9). The hypothesis that the IGF signaling may also be a regulator of tumor growth led to several clinical trials testing anti–IGF-1R drugs for various types of cancer (10). It is highly likely that when the target of the targeted therapy is absent, there would be no clinical benefit. IGF-1R expression in tumors is often not quantifiable. Even if IGF-1R gene expression was quantified, the composition of homodimers and hybrid IGF-1R and insulin receptors will vary (9–11). The IGF-1R protein level was a weak predictor of the sensitivity to IGF-1R inhibition therapy in lung cancer (12). There is currently no routine clinical test available to check the receptor status. Early identification or separation of patients likely to have a good or bad outcome can spare patients from ineffective treatment and the health care system from unnecessary cost. 18F-FDG PET can be used as a biomarker for early patient selection of probable efficacy or nonefficacy—a hypothesis we explored in our study.
In this study, the prognostic and predictive values of early 18F-FDG PET response in patients with ESFT treated with IGF-1R antibody are reported for the first time. Response assessment at day-9 PET by PERCIST could distinguish patients with a favorable survival outcome. Previous publications that have shown the predictive or prognostic values of 18F-FDG PET in patients with ESFT were based on a relatively small number of patients with newly diagnosed disease, heterogeneous therapeutic approaches, or 18F-FDG PET performed at the end of induction chemotherapy (3,13,14). In contrast, our study is from a larger group of patients, who all had the same treatment with IGF-1R antibody as the single agent, and the response to therapy was assessed early. Our study did not limit the assessment only to the primary tumor but measured the metastatic lesions as well.
When assessing response to therapy by PERCIST, the change in 18F-FDG uptake is expressed as a continuous, quantitative variable—the %ΔSULpeak between the baseline and posttherapy PET studies. The dichotomization of PERCIST response according to PMD and non-PMD was an alternative categorization for the analysis of our current study. The cutoff of a 10.5% drop in %ΔSULpeak by 9 d after therapy showed 2 clearly distinct survival curves. However, the 10.5% decrease was computed retrospectively to obtain the statistically best split. Current clinical PET systems may not have the reproducibility to reliably detect a change of 10.5% (15). The 10.5% threshold will need to be prospectively confirmed as an appropriate cutoff for this form of therapy in this type of tumor. The %ΔSULpeak appears to have higher prognostic value than the absolute difference in SULpeak as seen by the higher ROC AUC. The findings on the PETbaseline alone seemed to have only a weak independent prognostic value, and the posttherapy PET study provided additional prognostic value.
Of the 82 patients who did not have progression by PERCIST with PETday9, 51 were considered to have progression using World Health Organization criteria for the week-6 CT or clinical observation. The low sensitivity of PERCIST for future progressive disease could mean that the PERCIST criteria cutoff of 30% increase in SULpeak may be too high for response assessment very early into treatment such as in this study.
One concern with IGF-1R antibody therapy is the potential compensatory increase in growth hormone and IGF-1 production by the liver, leading to insulin resistance (16). If IGF-1R disruption of the endocrine pathways leads to changes in the glucose level of the patients, the PET images could be affected by the competition between 18F-FDG, a glucose analog, and serum glucose. The glucose levels were not statistically different before and after IGF-1R therapy in this study, and so the 18F-FDG uptake values were not affected by different serum glucose levels in the time period of this study.
The 18F-FDG PET images were collected from 31 different institutions and often used earlier versions of PET systems, the institutions’ clinical PET protocols, and 2-dimensional reconstruction methods, instead of the currently available high-definition PET systems. This study was one of the larger studies of PET done prospectively across many different centers in a large multiinstitutional trial. The 18F-FDG PET images of 79 (85%) of the patients in this real-world study done at multiple sites did not meet all the technical quality criteria defined by PERCIST for image acquisition and included variations in the injected 18F-FDG dose, variations in 18F-FDG uptake time, and different scanners used for baseline and follow-up. There were 2 patients with liver 18F-FDG uptake greater than 10, approximately 5 times greater than the reported reference range. They were excluded from the analyses of the absolute SULpeak, but their %ΔSULpeak was included. These 2 patients did not have liver metastases. Despite the wide variations in imaging conditions and relatively inferior technical quality of the images included in this study, early 18F-FDG PET response using PERCIST had potential prognostic value, especially for selecting patients who will not go on to respond favorably to this novel treatment.
Early treatment response by 18F-FDG PET has been demonstrated to be a possible biomarker of clinical outcome for various types of chemotherapies and for targeted cancer therapy, such as erlotinib for lung cancer therapy (17) and sunitinib or imatinib for gastrointestinal stromal tumors (18,19).
Our current study includes a large number of patients with ESFT treated with IGF-1R antibody and indicates that 18F-FDG PET using PERCIST is a potential biomarker for early prediction of clinical response and survival. Such data with a novel biologic treatment suggest the emerging role for 18F-FDG PET in early assessment of response to cancer treatment. From such early assessments, modifications of therapy may logically follow in response-adapted paradigms.
CONCLUSION
18F-FDG PET findings using PERCIST methods after only 9 d of therapy had a statistically significant association with subsequently determined clinical response, and more importantly with OS. Response assessment by 18F-FDG PET may be of use in early clinical decision making in patients with ESFT treated with IGF-1R antibody.
DISCLOSURE
The costs of publication of this article were defrayed in part by the payment of page charges. Therefore, and solely to indicate this fact, this article is hereby marked “advertisement” in accordance with 18 USC section 1734. This study was made possible by funding from the Radiological Society of North America, the Quantitative Imaging Biomarker Alliance, and funded in part with federal funds from the National Institute of Biomedical Imaging and Bioengineering, the National Institutes of Health under award number U54CA168512, Department of Health and Human Services under contract no. HHSN268201000050C, NCI contract no. U01 CA140204, and funds from the Sarcoma Alliance for Research through Collaboration, supported by F. Hoffman-La Roche. Laurence Baker reports a consulting or advisory role at Ascenta Therapeutics, Inc., The Hope Foundation, NCCN Guidelines Committee, and SARC, for which he receives no compensation. Richard Wahl is a consultant for Nihon Medi Physics. No other potential conflict of interest relevant to this article was reported.
Acknowledgments
We thank Judy Buchanan for scientific editing of the manuscript.
Footnotes
Published online Jan. 21, 2016.
- © 2016 by the Society of Nuclear Medicine and Molecular Imaging, Inc.
REFERENCES
- Received for publication June 18, 2015.
- Accepted for publication December 4, 2015.


