


Abstract
In oncology, the apparent diffusion coefficient (ADC) measured by diffusion-weighted MR imaging (DWI) and the standardized uptake value (SUV) from 18F-FDG PET have similar clinical applications. The purpose of this study was to assess the correlation between the ADC and SUV and compare their potential in the diagnosis and prediction of prognosis in breast tumors. Methods: Seventy-nine female patients (age range, 19–69 y; average, 49.1 y) with 83 pathologically proven breast tumors were recruited. The diagnoses consisted of 70 malignant breast tumors (65 cases of invasive ductal carcinoma, 1 of medullary carcinoma, 1 of mucinous carcinoma, 1 of squamous cell carcinoma, and 2 of micropapillary carcinoma) and 13 benign breast tumors (4 cases of fibroadenoma, 4 of mastopathy, 3 of adenosis with atypia, and 2 of benign phyllodes tumor). All patients underwent mammary gland MR imaging with DWI and 18F-FDG PET within a 2-wk interval. The patients’ ADCs and SUVs were measured within the tumor by DWI and 18F-FDG PET, respectively. For the malignant tumors, we evaluated the relationships among ADC, SUV, histopathologic appearance, and long-term prognosis. Results: A significant difference (P < 0.05) was observed in both parameters (ADC and SUV) between the benign and malignant breast tumors, and the difference was more significant when we introduced a new parameter, SUV/ADC. There was a weak inverse correlation between ADC and SUV (r = −0.36; P = 0.06) among the total tumors; however, this correlation was not significant within the group of malignant tumors. High SUV was found to correlate with larger tumor size, higher nuclear grade, and the triple-negative hormonal receptor profile. High ADC was revealed to be correlated with negative progesterone receptor and positive human epidermal growth factor receptor 2 profile. Higher SUVs also showed a correlation with poor prognosis. No correlation was seen between ADC and prognosis. Conclusion: Both SUV and ADC are helpful parameters in differentiating benign from malignant breast tumors. The use of SUV and ADC in combination may help in the diagnosis because of their inverse relationship. High preoperative SUV was associated with poor prognosis, but the contribution of ADC to prognosis prediction was small.
Breast cancer constitutes the second leading cause of cancer-related death and the largest number of newly diagnosed cases of cancer in women (1). Accurate preoperative assessment of disease characteristics and prognosis would be of great help in the diagnosis and treatment planning of breast cancer. Noninvasive diagnosis using in vivo imaging is becoming more important for the management of breast cancer for both patients with a suspected breast mass and those with no symptoms undergoing cancer screening.
18F-FDG PET and PET/CT, which detect enhanced glycolysis of tumors, have been shown to be useful imaging techniques for the diagnosis and staging of malignant disease. The usefulness of 18F-FDG PET has also been reported in the management of breast cancer, including staging, evaluation of response to therapy, and prediction of prognosis (2–6). The standardized uptake value (SUV) is a semiquantitative measurement of tracer uptake. The SUV is usually used to assess the biologic aggressiveness of a tumor when differentiating benign from malignant tumors and monitoring the response to therapy.
MR imaging is widely used in the diagnosis of breast cancer. With its high spatial resolution, MR imaging is a reliable modality for the evaluation of tumor localization and its extension to adjacent tissue (7). The differentiation of benign from malignant tumor status can also be achieved by contrast-enhanced MR imaging, but this is not always easy to accomplish solely from the findings of gadolinium–diethylene triamine pentaacetic acid enhancement (8).
Diffusion-weighted MR imaging (DWI) is based on imaging of the molecular mobility of water, that is, diffusion. The clinical application of DWI to oncology is becoming more frequent. The apparent diffusion coefficient (ADC) provides molecular information about the microenvironment of tumor cells, representing cell density. In general, compared with physiologic and benign conditions, high cellular tumor-tissue diffusion is restricted by the multitude of cell membranes. In areas where the cellular membrane has been breached, however, the motion of water molecules is less restricted. This leads to a larger extracellular space for the diffusion of water molecules, and molecules may also freely transgress defective cell membranes (9). With DWI, qualitative and quantitative information about differences in diffusion can be obtained (10). Some reports suggest the usefulness of ADCs for the differentiation of benign from malignant breast tumors (11–13).
Both the ADC measured by DWI and the SUV from 18F-FDG PET are expected to be useful in the differentiation of benign from malignant tumors and in assessments of treatment response and prognosis (14,15). These 2 parameters have similar clinical applications in oncology, but few studies have directly compared them and the information they provide. In addition, the benefit of using both parameters in combination in the diagnosis of malignant tumors has not yet been established.
The prediction of prognosis is another clinically important task in the determination of treatment strategy and follow-up intensity. Some research suggests the usefulness of the SUV in the prediction of prognosis for some types of malignancy (16). For breast cancer, several reports have evaluated the SUV and the ADC for their potential contributions to the prediction of prognosis (15,17). However, those studies simply compared these 2 parameters with conventional prognostic factors and were not direct evaluations of the prognosis. In addition, the question of whether the ADC has any impact on the prediction of prognosis remains a matter of debate.
The aim of the present study was to directly compare the ADC and SUV and evaluate the potential of each and of their combination in differentiating benign from malignant breast tumors. The correlation between ADC and SUV was also tested in the same breast tumors. For the malignant tumors, we also evaluated the relationships among the ADC, SUV, and biologic status of the tumor (size, hormonal receptor expression status, cell grade). A long-term follow-up survey was conducted to determine whether there is any correlation between prognostic outcome and preoperative SUVs and ADCs.
MATERIALS AND METHODS
Patient Population
We retrospectively assessed 79 consecutive female patients with 83 breast masses ranging from 10 to 45 mm (mean, 19 mm). Their ages ranged from 19 to 69 y (mean, 49.1 y), and they were treated in our hospital between 2004 and 2008. Of the 83 breast masses, 70 turned out to be malignant and 13 benign. The 83 diagnoses consisted of invasive ductal carcinoma (n = 65), medullary carcinoma (n = 1), mucinous carcinoma (n = 1), squamous cell carcinoma (n = 1), micropapillary carcinoma (n = 2), fibroadenoma (n = 4), mastopathy (n = 4), adenosis with atypia (n = 3), and benign phyllodes tumor (n = 2). Demographic and clinical characteristics of this study are summarized in Table 1. Final diagnoses were made by histopathologic examination of a surgically excised specimen from all patients with a malignant tumor and from 3 of the patients with a benign tumor; the other 10 benign masses were diagnosed by core-needle biopsy (n = 2) and fine-needle aspiration biopsy (n = 8) with a 6-mo minimum follow-up by imaging modalities to check for the absence of tumor growth.
Demographic and Clinical Characteristics of Study Population
The institutional review board of our hospital approved this retrospective study, and the requirement to obtain informed consent was waived. Patients who fit the original inclusion criteria were selected from a retrospective review of medical records. Patients had to have no prior history of breast tumor and had to have undergone DWI and 18F-FDG PET studies within 2 wk before the primary treatment, including surgery, radiotherapy, or chemotherapy. Patients with a tumor smaller than 10 mm in diameter or a noninvasive type of breast cancer (including ductal carcinoma in situ) were excluded in order to avoid the partial-volume effect in 18F-FDG PET and unreliable delineation of the tumor by MR imaging. We performed a long-term follow-up study (average, 62 mo; median, 64 mo) for 91% (60/66) of the cancer patients to check disease progression and overall prognosis.
PET Scans
Whole-body PET images were obtained with an Advance NXi camera (GE Healthcare). Whole-body scanning was started 1 h after an intravenous injection of 18F-FDG with average radioactivity of 180 MBq (3.7 MBq/kg of body weight; maximum, 267 MBq). All patients fasted for at least 5 h before tracer injection. A 2-min emission study was performed at each bed position, followed by a 1-min transmission scan. Images were acquired in 2-dimensional mode. Attenuation-corrected transmission images were reconstructed by 2-dimensional ordered-subset expectation maximization (subsets, 21; iterations, 2) and segmented attenuation correction into 128 × 128 matrices.
MR Imaging Protocol
MR images were acquired with a 1.5-T scanner (Intera Achieva 1.5T Nova; Philips) using a single-shot echo planar imaging sequence with a sensitivity-encoding body coil, with the patients breathing freely in the supine position. The diffusion-weighted images were acquired axially using single-shot echo planar imaging. A motion-probing gradient was applied along the x-, y-, and z-axes before and after 180° pulses. Isotropic images were obtained using the following parameters: b value, 1,000 s/mm2; repetition time/echo time/inversion time (shortest), 4,800/72/180 ms; image matrix, 256 × 256; field of view, 440 mm (coronal); slice thickness, 4 mm; spacing, 1 mm; gap, −1 mm; number of slices, 66; number of excitations, 10; sensitivity-encoding factor, 2, with short-τ inversion recovery fat suppression. T2-weighted fat suppression imaging was performed using the following parameters: spectral presaturation with inversion recovery; repetition time/echo time, 6,687/90 ms; thickness/gap, 5/1 mm; number of slices, 33; sensitivity-encoding factor, 1.5; matrix, 512.
Histologic Analysis
Tumor samples obtained from surgery were routinely fixed with formalin, embedded in paraffin, cut into sections, and subjected to hematoxylin and eosin staining and immunohistochemical staining. Breast tumors were histologically classified according to the criteria of the World Health Organization (18). Tumor size, nuclear grade, steroid hormone receptor expression status (estrogen receptor; progesterone receptor), and the expression status of human epidermal growth factor receptor 2 (HER2) were assessed immunohistochemically by routine procedures in 57 malignant lesions of the total of 70. The other 13 lesions lacked one or more of the factors listed above. The presence or absence of axillary lymph node metastasis was also recorded.
Image Evaluation
We analyzed the PET images on an Entegra workstation (GE Healthcare). Tumor 18F-FDG uptake was considered positive when an uncommonly high uptake compared with surrounding breast tissue was seen by visual inspection. The maximum SUV (SUVmax) and mean SUV (SUVmean) were calculated on the basis of activity values in regions of interest manually placed on the area of the breast tumor containing the highest-SUV pixel. The margin of the tumor was determined by visual inspection. On MR imaging, a region of interest was placed on the highest-signal focus in the DWI image that corresponded to the high-signal area in T2-weighted imaging with fat suppression. The mean ADC (ADCmean) and the minimum ADC (ADCmin) were measured using the region of interest on the ADC map and DWI with b values of 0 and 1,000 s/mm2.
Survival Analysis
We conducted a long-term follow-up study (average, 62.3 mo; median, 64 mo) for 60 of the 66 patients with a malignant tumor. Prognostic information on the other 6 patients was not available. The patients were divided into 2 subgroups according to their SUVs and ADCs using the cutoff values, and we evaluated progression-free survival (PFS) and overall survival (OS) between the groups. PFS and OS were defined as the time that elapsed between the date of diagnosis and the date of clinical disease progression or death, respectively, or, if neither progression nor death occurred during follow-up, the date of the last follow-up visit. The survival curve was estimated by the Kaplan–Meier method.
Statistical Analysis
The results are expressed as the mean values ± SDs. The ADCs of the breast tumors were compared with the SUVs using the Mann–Whitney U test. The Spearman correlation test was used to assess correlations between 2 values. To assess the difference in diagnostic potential of SUVmax, ADCmean, and SUV/ADC, we performed a statistical analysis comparing multiple receiver operating characteristic (ROC) curves to test the null hypothesis that there is no difference between the areas under the curve. For the survival analysis, we used a Kaplan–Meier plot to generate the survival curve, and the log-rank test was used to compare the curves of the 2 groups to test the significance of differences. The ROC analysis was performed to determine the optimal cutoff values of SUV and ADC. The potential independent effects of multiple factors on PFS were assessed by univariate and multivariate analyses using the Cox proportional hazards regression model. A P value less than 0.05 was considered significant. Analyses were performed with JMP Pro software (version 10.0; SAS Institute, Inc.).
RESULTS
Differences in SUVs and ADCs Between Benign and Malignant Tumors
The ADCs were significantly higher in the benign tumors (ADCmean, 1.37 ± 0.34; ADCmin, 0.88 ± 0.18) than in the malignant tumors (ADCmean, 0.94 ± 0.25; ADCmin, 0.64 ± 0.24). There were significant differences in both ADCmean and ADCmin between the 2 groups. The ADCmean was slightly better than the ADCmin at differentiating benign from malignant tumors (P = 0.0001 vs. P = 0.0003). The same analysis was done for SUVmean and SUVmax. The SUVs of the malignant tumors (SUVmax, 7.34 ± 5.61; SUVmean, 5.57 ± 4.17) were significantly higher than those of the benign tumors (SUVmax, 2.52 ± 1.35; SUVmean, 2.11 ± 1.07). There also was a significant difference in both SUVmean and SUVmax between the benign and malignant tumors. The SUVmax was slightly better than SUVmean at differentiating benign from malignant tumors (P = 0.0003 vs. P = 0.0005), and we therefore used the SUVmax and ADCmean in the following analysis.
We introduced the new parameter SUV/ADC (SUVmax divided by ADCmean). Using SUV/ADC produced better results than SUVmax or ADCmean alone in differentiating benign from malignant tumors (Fig.1). We tested the diagnostic potential of both parameters using a cutoff value determined by ROC analysis. SUVmax and ADCmean have similar diagnostic potential and the same accuracy. Sensitivity, specificity, and overall accuracy were 64.0%, 88.3%, and 80.2%, respectively, for SUVmax; 68.3%, 84.2%, and 82.5%, respectively, for ADCmean; and 70.5%, 86.5%, and 85.3%, respectively, for SUV/ADC. Multiple ROC curves were compared to assess the statistical significance of differences in the area under each ROC curve. The areas under the curve for SUVmax, ADCmean, and SUV/ADC were 0.810, 0.824, and 0.858, respectively. A statistically significant difference was seen between SUV and SUV/ADC (P = 0.042), but no difference was seen between ADC and SUV (P = 0.77) or ADC and SUV/ADC (P = 0.70).
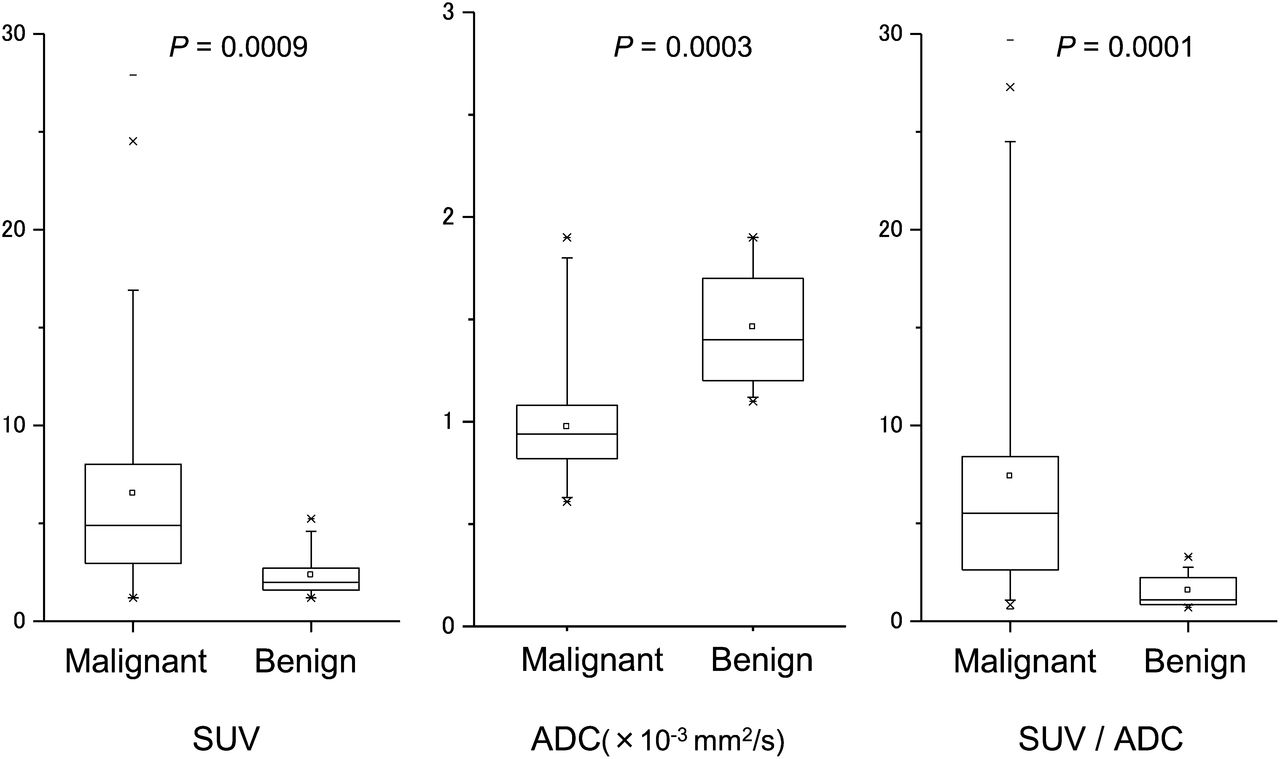
Significant difference was seen in both SUV and ADC between benign (n = 13) and malignant (n = 70) tumors. Combination of SUV and ADC (SUV divided by ADC) showed slightly better performance in differentiation of benign from malignant lesions.
Correlation of SUV and ADC
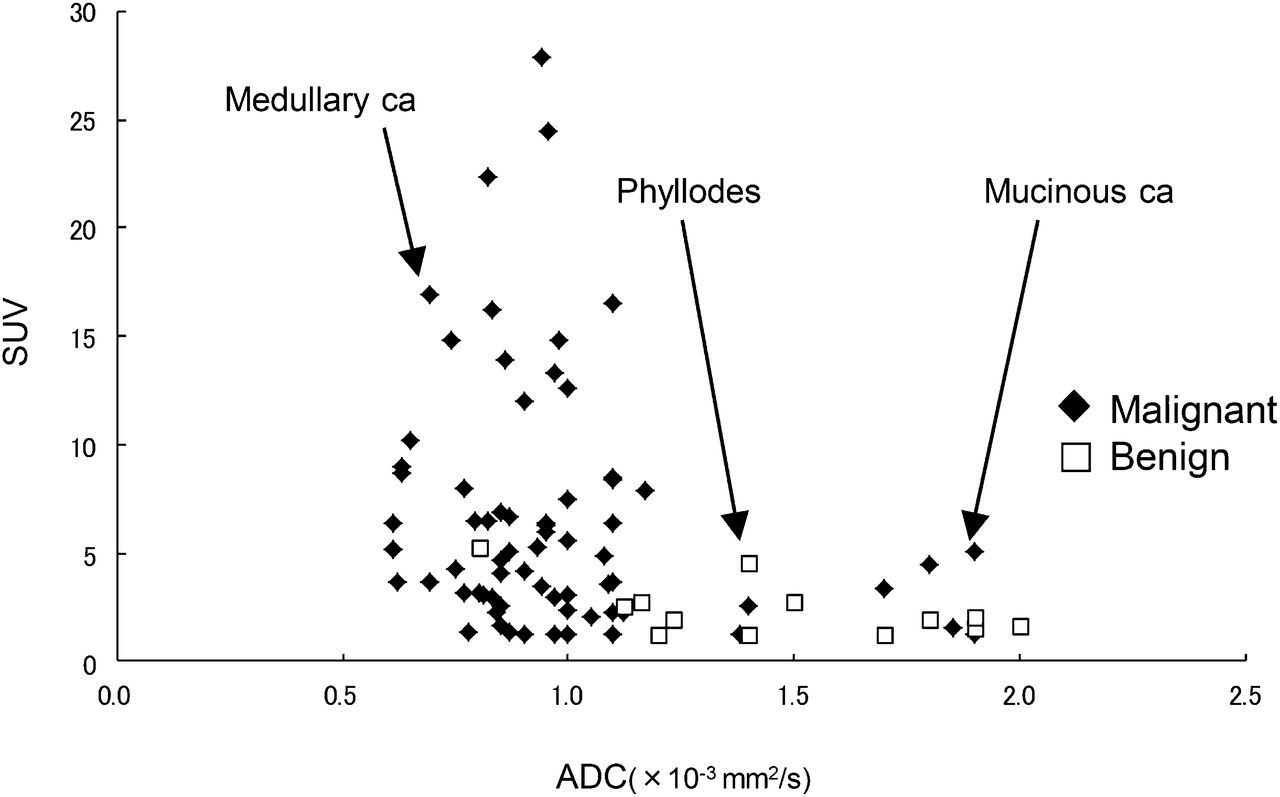
There was a significant linear inverse correlation between SUVmax and ADCmean, with a coefficient of correlation of 0.36 (Fig. 2). The linear regression line was y = −5.05x + 11.46. The R2 was 0.094 (P = 0.004). It is clear that the benign lesions were distributed in higher-ADC and lower-SUV areas, and the malignant tumors’ distribution was the opposite (Fig. 2). The particular types of breast tumor tended to be distributed in a characteristic manner. That is, the medullary lesion had a low ADC and high SUV (Fig. 3). The mucinous carcinoma had a very high ADC and a rather high SUV (Supplemental Fig. 1; supplemental materials are available at http://jnm.snmjournals.org). The 2 benign phyllodes tumors had high ADCs but high SUVs. However, when limited to the malignant tumors only, the correlation between the ADCs and SUVs was not significant, with an R2 of 0.041 (P = 0.09).

Significant linear inverse correlation was seen between SUV and ADC (coefficient of correlation, 0.36). Benign lesions were distributed in higher-ADC and lower-SUV areas, and distribution of malignant lesions was opposite. However, there was no significant correlation when limited to malignant tumors. Particular types of breast tumor tended to be distributed in characteristic manner. Single mucinous carcinoma had very high ADC and rather high SUV, whereas medullary carcinoma had low ADC and high SUV. The 2 benign phyllodes tumors had high ADCs but high SUVs. ca = carcinoma.

A case of medullary carcinoma with low ADC (0.7 × 10⁻³ mm2/s) and very high SUVmax (16.9). This is typical malignant pattern. This case also had triple-negative hormonal status. SPIR = spectral presaturation with inversion recovery.
Tumor Status Versus SUV and ADC
We next examined the relationships among tumor status, ADC, and SUV in the 57 malignant tumors (Table 2). The tumor status parameters included tumor size, nuclear grade of cancer, estrogen receptor expression status, progesterone receptor expression status, HER2 receptor expression status, triple-negative status, and presence of axillary lymph node metastasis. Triple-negative status is defined as a breast tumor with a receptor expression status negative for estrogen, progesterone, and HER2.
Association Between Tumor Status and Tumor SUV and ADC
Our analysis revealed significant associations between SUV and tumor size, nuclear grade, and triple-negative hormonal status in SUV. Tumors of larger size, tumors of high nuclear grade, and tumors with the triple-negative profile tended to have higher SUVs. In contrast, a significant association was observed between ADC and negative estrogen status (P = 0.02) and between ADC and positive HER2 status (P = 0.02). Although not significant, a higher ADC was associated with negative progesterone receptor status (P = 0.06).
Survival Analysis
The long-term follow-up for all patients yielded a total of 13 cases of disease progression (metastasis) and 11 deaths. The OS rate at 5 y after initial diagnosis was 89.9%. Patients were divided into 2 subgroups according to their SUV (threshold of 4.16 for both PFS and OS) and ADC (threshold of 0.94 for PFS and 1.00 for OS), and the PFS and OS were estimated between the groups (Fig. 4). Cutoff values were determined by ROC analysis. There was no significant difference in PFS or OS between the high-ADC group and the low-ADC group, but there were significant differences in both PFS and OS between the high-SUV group and the low-SUV group (Fig. 4). We also evaluated PFS and OS using the combined parameter SUV/ADC (threshold, 4.53). A significant difference was seen in both PFS and OS between the high-SUV/ADC group and the low-SUV/ADC group. However, the survival curve was essentially the same as that for SUV, and no significant improvement was seen.

(A and B) We compared PFS and OS rates between patients with low ADCs and those with high ADCs (A) and between high-SUV and low-SUV groups (B). No significant difference in PFS or OS was observed between high-ADC and low-ADC groups, but there were significant differences in both PFS (P = 0.08) and OS (P = 0.02) between high-SUV group and low-SUV group. (C) Survival curve did not show statistical improvement using new parameter SUV/ADC compared with SUV alone.
We performed univariate analysis of PFS including tumor size, nuclear grade, hormonal receptor expression profile, and lymph node metastasis, as well as SUVmax and ADCmean. Larger tumor size and high SUVmax were significantly associated with a short PFS. Moreover, multivariate analysis that included SUVmax and ADCmean showed that SUVmax was an independent prognostic factor for PFS (Table 3).
Univariate and Multivariate Analysis of PFS in All Patients
DISCUSSION
It remains controversial which value (maximum, average, minimum) of SUV or ADC should be used in the assessment of tumors on PET or MR imaging. In 18F-FDG PET, SUVmax in the region of interest is usually used to assess the malignant nature of the tumor. Regarding ADC, some researchers suggest the superiority of ADCmin over ADCmean for assessing the malignant potential of brain tumors (19). In our study, although these 2 parameters showed a subtle difference, ADCmean was more robust than ADCmin in the differentiation of benign from malignant breast tumors. It is likely that the minimum value of ADC does not always represent the malignant nature of a breast tumor, in contrast to the brain tumor results. A tumor containing heterogeneous components such as necrosis and other degenerative contents might display various ADCs. The ADCmin value, if measured accurately, may represent the cell density of a solid cell-rich component of the tumor, and this often determines the malignancy of the tumor.
We also found that SUVmax was more robust than SUVmean for differentiating benign from malignant tumors. The SUVmean depends largely on the region of interest that determines the tumor margin. Precise determination of the tumor margin is sometimes difficult, especially in tumors that are small or have an irregular shape, potentially leading to an underestimation of 18F-FDG uptake.
SUV and ADC have similar and sufficient potential to differentiate benign from malignant tumors. The usefulness of 18F-FDG PET in differentiating benign from malignant breast lesions is reported to be limited because of the considerable number of false-negative findings (20). The number of benign tumors in this study (n = 13) was low compared with the number of malignant tumors (n = 70). This might be a limitation. Additionally, we excluded masses smaller than 1 cm. The partial-volume effect is a major cause of false-negative 18F-FDG PET results. In our study, we found 18F-FDG PET to be useful in the diagnosis of breast cancer, and we found that the usefulness of the SUV was similar to that of the ADC. Combinations of multiple parameters such as SUV/ADC may complement each other and produce more accurate results. This approach may also be useful for other types of malignancy.
The negative correlation we observed between SUV and ADC suggests that both represent the cell density of tumors. Cell density typically increases in the malignant condition because of the expanding nature of the tumor cells. The negative correlation of SUV and ADC is thus reasonable since both parameters reflect malignancy. However, when our analysis was limited to the malignant breast tumors, the correlation coefficient was not so high and did not reach significance. The fact that SUVmax had a wider range of distribution than ADC and was associated with tumor size and hormonal status indicates that the SUV represents another biologic aspect of tumors (e.g., hypoxia or aggressiveness) in addition to cellular density. Malignant breast tumors may be basically heterogeneous and include multiple biologic parameters in addition to cell density that influence the final image output.
The distributions of ADC and SUV for the particular types of breast tumor showed distinctive trends (Fig. 2). The mucinous carcinoma had a high ADC and an intermediate SUV and thus was quite difficult to diagnosis with only the ADC information. The imaging features of mucinous carcinoma differ from those of common breast cancers because of its high extracellular water component (mucin pool) and relatively low cell density. A higher extracellular water component results in high ADCs, and relatively low cellular density results in low SUVs with 18F-FDG PET (Fig. 3). In contrast, medullary carcinoma usually has high cellular density and displays a low ADC and high SUV (Supplemental Fig. 1). No systematic review was available on the ADC of these subtypes of breast cancer, but the result is compatible with previous reports (12,21). A possible limitation is that the number of these rare subtypes was small in this study. Further accumulation of cases is needed. However, knowing the characteristic patterns of special types of breast cancer may help in clinical diagnoses using MR imaging and PET. Using ADC and SUV together may increase the accuracy of the diagnosis of breast tumors; this will be one the benefits of integrated PET/MR imaging.
We observed correlations among SUVs, ADCs, and biologic features of the breast tumors. The larger tumors and those with a higher nuclear grade tended to have higher SUVs. This phenomenon is due to the partial-volume effect but also reflects the enhanced glycolysis in an aggressive tumor. In addition, high SUVs tended to be seen in tumors with a triple-negative hormonal profile in the present study. This finding is compatible with an earlier study and indicates that this tumor subgroup has an aggressive biologic nature (22). Among the breast cancer subtypes classified by a recent high-performance gene expression profile analysis, basal epithelial cancer was found to have a relationship with triple-negative tumor. This tumor subtype is regarded as aggressive and as having a poor prognosis because of the lack of hormonal markers that enable targeted hormonal therapy (23).
We also observed a relationship between ADC and hormonal expression status. This result is compatible with a former report (24). A plausible explanation for this phenomenon is that the ADC is affected by the tissue’s perfusion status, which is controlled by angiogenesis. Tissue with increased perfusion results in a higher ADC. The expression of some types of sex hormone is known to affect angiogenesis. Estrogen receptor blocks the angiogenic pathway and reduces perfusion, which in turn affects the ADC (23). HER2 has a chemical structure similar to the human epidermal growth factor receptor. Overexpression of HER2 accelerates cell growth and contributes to the carcinogenesis of cells. In addition to cell growth, HER2 also induces angiogenesis (25), which leads to the increased blood flow in tumors that results in reduction of ADCs.
We observed significant differences in PFS and OS between the high-SUV group and the low-SUV group. No such significant differences were seen between the high-ADC and low-ADC groups. In the present study, SUV was correlated with tumor size, suggesting that patients with advanced-stage breast cancer have higher SUVs. We also found that the triple-negative profile, which is thought to be associated with poor prognosis, was also linked to higher SUVs. Our low-ADC patients tended to have poor prognoses, but this difference was not significant. When we compared prognoses between the high-ADC and low-ADC groups among patients with high SUVs, there were no significant differences in PFS and OS. Some reports suggest the usefulness of ADC in the evaluation of treatment response. An increase in ADC after chemotherapy is reported to be associated with a preferable outcome (26,27). A change in the microenvironment around the tumor—for example, edema—would affect the diffusion coefficient of the MR images, indicating that some biologic response against the therapy has occurred in the tumor. On the other hand, ADC has no correlation with tumor grade or tumor size. Tumor size is an important factor in the prognosis of breast cancer. A change in ADC after treatment indicates a preferable response (26,27), which may lead to the better prognosis. On the other hand, the preoperative ADC is helpful for differentiating benign from malignant tumors because ADC reflects cell density, but it may not be linked to biologic features of the tumor such as aggressiveness. This may partly be the reason why ADC has little impact on predicting the prognosis.
In summary, the diagnostic capabilities of SUV and ADC are similar for differentiating benign from malignant breast tumors. SUV/ADC, the combination of these parameters, was more accurate than either parameter alone for differentiating benign from malignant lesions. There was a weak inverse correlation between SUV and ADC in the overall group of tumors, and when restricted to the malignant tumors, the correlation was not significant. Using both parameters is helpful in the diagnosis of particular types of breast tumor. SUV and ADC represent different aspects of the biologic features of tumor cells. SUV is useful in the prediction of the prognosis of breast cancer, but ADC is not. To the best of our knowledge, this study was the first prospective long-term evaluation demonstrating that 18F-FDG PET is valuable not only as a technique for benign–malignant differentiation of breast tumor but also as a prognostic tool for breast cancer.
The simultaneous assessment of SUV and ADC is now possible with a hybrid PET/MR imaging scanner. A greater understanding of the characteristics and limitations of both parameters may help in the interpretation of molecular images provided by PET/MR imaging.
CONCLUSION
Both SUV and ADC are helpful parameters in differentiating benign from malignant breast tumors. The use of SUV and ADC in combination may help in the diagnosis because of their inverse relationship. A high preoperative SUV was associated with poor prognosis, but the contribution of ADC to prognosis prediction was small.
DISCLOSURE
The costs of publication of this article were defrayed in part by the payment of page charges. Therefore, and solely to indicate this fact, this article is hereby marked “advertisement” in accordance with 18 USC section 1734. No potential conflict of interest relevant to this article was reported.
Footnotes
Published online Mar. 24, 2014.
- © 2014 by the Society of Nuclear Medicine and Molecular Imaging, Inc.
REFERENCES
- Received for publication July 15, 2013.
- Accepted for publication December 2, 2013.


