


Abstract
This study applied decision tree analysis to evaluate the sensitivity, specificity, and cost-effectiveness of clinical algorithms that incorporate 18F-FDG PET. Methods: A cohort of 176 patients was studied. The localization rate, accuracy, therapeutic impact on the presurgical decision-making process, and correlation with the postsurgical outcome were assessed for the tests commonly performed for seizure localization. Decision tree sensitivity analysis compared 3 imaging strategies with a baseline strategy of medical therapy for all: video-electroencephalography monitoring (VEM)/MRI strategy, in which patients underwent VEM and brain MRI only, and +SPECT and +PET strategies, in which patients with an indeterminate VEM/MRI result underwent ictal SPECT or interictal 18F-FDG PET, respectively. Results: The localization rates for VEM, MRI, 18F-FDG PET, ictal SPECT, and intracranial electroencephalography (EEG) were 62.2%, 35.8%, 75.0%, 60.0%, and 93.8%. The VEM/MRI strategy had the lowest cost per class I/II outcome, but the additional costs per class I/II outcome for the +PET and +SPECT strategies were always below the minimum reported cost savings for a class I/II outcome. There were no valid conditions in which the +SPECT strategy had a lower cost per class I/II outcome than the +PET strategy. Within the range of cost savings estimated to be associated with a class I/II outcome, all decision strategies produced net cost savings; however, these were significantly higher for the +PET and the +SPECT strategies. Conclusion: 18F-FDG PET is cost-effective in the presurgical evaluation, particularly when used in patients with a nonlocalizing or nonconcordant VEM or MRI result.
Epilepsy surgery offers potential for long-term seizure control in patients with focal epilepsy who have not been able to achieve control despite trials of several different antiepileptic medications (1–3). The success of focal epilepsy surgery depends heavily on the accurate identification of the epileptogenic zone. An ever-enlarging array of modalities is promoted for use as part of the epilepsy surgery evaluation, including scalp and intracranial electroencephalography (EEG); video-EEG monitoring (VEM); structural volumetric MRI; “newer” MRI techniques such as MR spectroscopy, diffusion-tensor MRI, perfusion MRI, and functional MRI; PET; SPECT; magnetic encephalography; and EEG source localization. However, the application of all of these techniques as part of the routine presurgical assessment is impractical and unlikely to be cost-effective. Many are likely to give redundant localizing or prognostic information (4). Few studies have systematically examined various algorithms for the rational use of different localizing modalities in the decision-making process of the presurgical evaluation for epilepsy.
Interictal 18F-FDG PET is widely used in the evaluation of patients for epilepsy surgery. PET produces potentially quantifiable data with a superior spatial resolution to SPECT but less than that of MRI. 18F-FDG PET images are reliable in lateralizing temporal lobe epilepsy (TLE) in patients without a discrete neocortical mass lesion, with reported sensitivities of 60%–90% and few falsely lateralized cases (5–9). In addition, 18F-FDG PET may provide localizing information that is independent of that provided by MRI (9,10) and is prognostic of the patient's seizure outcome (9–19). The sensitivity of 18F-FDG PET in extratemporal lobe epilepsy (ETLE) is generally reported to be less than that in TLE, but 30%–50% of patients with ETLE are successfully localized—including some patients with a normal MRI in whom the PET findings are critical to allowing that patient to proceed to surgery (8,9,20,21). However, despite this information, the evidence for the cost-effectiveness of 18F-FDG PET in the presurgical evaluation continues to be questioned by several authors and funding organizations (8,22–26).
This study used a decision tree analysis to evaluate the therapeutic and health impacts and cost-effectiveness of various algorithms incorporating 18F-FDG PET into the presurgical evaluation for medically refractory focal epilepsy in a large cohort of patients. Decision tree analysis describes a methodology in which alternative management strategies are represented by a horizontal flow chart with branching points at which a decision is made, resulting in a range of possible outcomes (27). The results demonstrate conclusively that 18F-FDG PET is a cost-effective investigation for the localization of the epileptogenic zone in the presurgical evaluation, particularly when used in patients in whom VEM or MRI are either nonlocalizing or nonconcordant with other localizing information. This study should facilitate the wider introduction of evidence-based medicine practices into this important area of clinical practice.
MATERIALS AND METHODS
Patients
The study population consisted of 176 patients from the Comprehensive Epilepsy Programs (CEPs) of The Royal Melbourne Hospital and St. Vincent's Hospital Melbourne who underwent an 18F-FDG PET brain scan as part of a presurgical evaluation for chronic medically refractory focal epilepsy from November 1996 to July 2001. The patients were classified as having chronic medically refractory epilepsy if they continued to experience seizures despite treatment trials with 3 or more different antiepileptic drugs with a duration of epilepsy treatment of more than 2 y. All patients were taking antiepileptic medications at the time of the surgical evaluation and PET image acquisitions. Patients included 90 men and 86 women, with a mean age of 42.0 y (range, 16.2–74.2 y). All patients underwent interictal EEG, prolonged inpatient VEM (16 patients also had monitoring with implanted intracranial EEG electrodes), epilepsy-protocol volumetric MRI, and 18F-FDG PET. The gold standard for the localization was determined by consensus at a case conference of the CEP on the basis of integration of all available clinical and investigation information and was prospectively recorded. The final CEP localization was defined as TLE in 120 (68.2%) and ETLE in 19 (10.8%) patients (frontal, 5; frontoparietal, 9; parietal, 4; and occipital, 1); epilepsy remained nonlocalized in 37 (21.0%) patients. The meeting was attended by at least 2 experienced epileptologists as well as at least 1 neuroradiologist, neurophysiologist, neuropyschologist, and neuropsychiatrist.
PET Methods
All patients were imaged as outpatients in the interictal state on a scanner (PENN-PET 300H Tomograph; UGM Medical Systems, Inc.) with sodium iodide crystals, using a 25-cm field of view and 3-dimensional whole-head acquisition as previously described (9). The data were processed using a Wiener prefilter (scaling value, 0.5) and ordered-subset expectation maximization iterative reconstruction. The images were reconstructed into a cylinder with a volume of 256 × 256 mm and a slice thickness of 2 mm. The reconstruction process created a standard series of contiguous images orientated in the transaxial, coronal, sagittal, and transtemporal planes.
The 18F-FDG PET images were independently assessed by 2 reviewers unaware of the patients' clinical and other investigation details, on a high-resolution computer monitor with the aid of a standard rainbow-color look-up table with a power factor of 0.65 (this information is available online as Supplemental Fig. 1 [supplemental materials are available online only at http://jnm.snmjournals.org]). No background subtraction was used. After reviewing all PET images in multiple planes for each patient, the reviewers determined whether the images were localizing to a single brain region or were localizing. The criterion for considering an image localizing was a single focal area of decreased image intensity, clearly visually detectable in 2 or more contiguous image slices (each slice had a thickness of 2 mm) in 2 or more planes. For the images that were considered localizing, reviewer confidence in the localization was then classified as high or low. If there was any discrepancy between the findings of the 2 reviewers, either in whether the images were localizing or as to the site of the localization, a joint review was performed and a consensus opinion obtained. Quantitative measurements were not used for the purposes of this study.
MRI Methods
High-resolution MR images were acquired on 1.5-T scanners (Siemens and GE Healthcare) according to a standardized epilepsy protocol (28). This protocol included a whole-brain volumetric T1-weighted series acquired in the coronal plane with slice thickness of 1.5 mm and no interslice gap; axial and coronal T2-weighted images; and axial proton density–weighted images. In most cases, coronal fluid-attenuated inversion recovery sequences were also obtained. The images were all independently reviewed by neuroradiologists and also reviewed as part of the CEP meeting, at which time a final decision on the MRI findings was made. Formal hippocampal volumetric measurements were taken in selected cases where clinically indicated, as previously described (29).
VEM
All patients underwent prolonged inpatient scalp VEM using 32-channel systems with the electrodes arranged according to a modified 10–20 system, which included subtemporal electrodes, although the results could not be located in 4 of the patients. Sixteen patients underwent further prolonged VEM after the implantation of intracranial electrodes (3 bitemporal-depth electrodes, 2 subdural-grid electrodes, and 11 both bitemporal-depth and subdural-grid electrodes). The localization of the ictal-EEG tracings was determined by review of patients' reports; localization of the tracings was then compared with the masked PET localization.
Blood Flow SPECT Studies
Ictal and interictal blood flow SPECT studies were performed on a minority of patients (n = 15). The radiotracer used was 99mTc-ethyl cysteinate diethylester (99mTc-ECD, or 99mTc-bicisate), labeled and reconstituted using a preparation kit (Neurolite; Du Pont Merck Pharmaceutical Co.). The ictal radiopharmaceutical injections were given by registered nurses during a typical seizure while the patients underwent VEM in the inpatient epilepsy monitoring unit. The radiopharmaceutical was injected through an in situ intravenous catheter and was followed by a flush of 10 mL of 0.9% sodium chloride from a preloaded syringe. The interictal injections were given when the patient had been seizure-free for at least 24 h, in standard ambient room lighting, and with the patient's eyes open and ears unplugged. The radiopharmaceutical dose injected was approximately 740 MBq (20 mCi) for all studies.
An identical protocol was used for both studies, and the SPECT images were acquired with the same scanner within 2–3 h of the radiopharmaceutical injection. A dual-head scanner was used (Dual Head Genesis Scanner; ADAC UGM Medical Systems Inc.). The data were acquired in a 128 × 128 byte matrix over 360°, with 32 stops per head at 40 s per stop, using a circular orbit. The energy setting was 140 keV with a 15%–20% window. Transaxial images were reconstructed using a Metz filter (power, 3; full width at half maximum [FWHM], 6 mm) and rebinned into a 64 × 64 matrix with a ×2 zoom on an imaging computer (SUN; ADAC UGM Medical Systems Inc.). Attenuation correction was applied, and images were viewed in the usual 3 orthogonal planes. The reconstructed system resolution was approximately 8-mm FWHM, consisting of cubic voxels with dimensions of 3.6 or 4.4 mm (depending on the image size). Images were reconstructed using a standard filtered backprojection algorithm in the coronal, sagittal, transaxial, and transtemporal planes.
Subtraction ictal SPECT coregistered to MR (SISCOM) images were constructed using an offline Unix-based workstation with commercial image-analysis software packages (ANALYZE; Biomedical Imaging Resource). This technique has previously been fully described and validated (30–33). The SPECT images were initially interpreted by the nuclear medicine physicians in a masked manner and then reviewed as part of the CEP meeting, at which time a final decision about the SPECT findings was made.
Assessment of Localizing Value of Tests and Therapeutic Impact on Surgical Decision-Making Process
The results of the 18F-FDG PET, MRI, VEM, and intracranial EEG monitoring were classified on a 3-point scale (1, localizing; 2, equivocal; or 3, nonlocalizing). The site localization accuracy was assessed by comparison with the final CEP localization, as we have done with previous studies (9,30,32,34). To our knowledge, this is the gold standard for comparison as it is based on an integration of all available localizing information and the collective opinions of 2–4 experienced epileptologists. The accuracy localization was rated as 1, concordant localization (i.e., the tests localizing to the same brain region as the CEP localization); 2, nonconcordant localization (i.e., the tests localizing to a region different from that of the CEP localization); 3, test localizing, CEP nonlocalizing; 4, test nonlocalizing, CEP localizing; and 5, neither localizing.
Assessment of Outcome After Epilepsy Surgery and Health Impact of MRI, EEG, and PET
In the patients who went on to have epilepsy surgery, the seizure outcome was classified by patients' status at their most recent postoperative follow-up point according to a modified Engel scale (35). Class I patients remained free of disabling seizures for more than 2 y; class II patients had only rare seizures (<3/y); class III patients continued to have disabling seizures but seizure frequency had improved by more than 90% on baseline; and class IV patients had no worthwhile improvement in seizure frequency after the surgery.
For the assessment of the health impact of the presurgical investigations and the decision tree analysis, postsurgical outcomes were dichotomized as being either good (i.e., class I or II) or poor (i.e., class III or IV), as was done in a recent comprehensive evaluation of the literature on 18F-FDG PET for the Australian Government Medicare Services Advisory Committee (26). For postsurgical outcome, the health impact of having a localizing MRI or VEM was compared among the following 3 sets of patients: those in whom both tests were localizing and concordant with the CEP localization; those in whom either the MRI or the VEM was nonlocalizing or was nonconcordant with the CEP; and those in whom neither test was localizing or concordant. The health impact of PET in patients who had either a nonlocalizing or nonconcordant MRI or VEM was assessed by comparing the outcomes in these patients with a localizing PET with the outcomes of those with a nonlocalizing PET.
Decision Tree Analysis
The contribution of PET in the presurgical evaluation was assessed by decision tree analysis with software (Extend Software; Imagine That, Inc.) using blocks from the Crump Institute, UCLA. Three imaging strategies were compared with a baseline strategy of medical therapy for all (this information is available online as Supplemental Fig. 2). For the imaging strategies, it was assumed that all patients would undergo both VEM and epilepsy-protocol MRI as these tests are generally considered essential in the presurgical evaluation. For the first imaging strategy (VEM/MRI), patients underwent VEM and brain MRI only. Patients with concordant results underwent surgery whereas medical therapy was continued for those patients with nonconcordant or nonlocalizing results. For the second and third imaging strategies (+SPECT and +PET), patients with an indeterminate VEM/MRI result underwent ictal SPECT or interictal 18F-FDG PET, respectively. If SPECT or 18F-FDG PET was localizing, these patients underwent surgery.
The VEM/MRI results were modeled as a single test with 3 possible outcomes: positive (both localizing), negative (neither localizing), and indeterminate (1 localizing or discrepant). The parameters used in the decision tree modeling are summarized in Table 1. The sensitivity, specificity, and indeterminate fraction were determined along with their 95% confidence limits from patient data, excluding 4 patients who did not have VEM data available. As the prevalence of class I/II outcomes was not significantly different in the indeterminate MRI group, this was modeled as the same as the overall prevalence. PET performance (and 95% confidence limits) in indeterminate cases was estimated from patient data. The ictal SPECT performance and 95% confidence limits were not estimated from patient data because of the small numbers (n = 15) but were derived from the study of Won et al. (36). The 95% confidence limits calculated from Won et al. fell within the 95% confidence limits of the observed data.
Parameters Used in Decision Tree Modeling
The costs of investigations and surgery were estimated from a purchaser's perspective within the Australian health economy and were based on the Medicare schedule and hospital diagnosis-related group classifications published by the Australian Government Department of Health and Aged Care (37) as follows: VEM, $4,110; MRI, $600; PET, $918; ictal-interictal SPECT, $5,310; surgery, $25,691. The ictal SPECT costs were relatively high because they included 2 scans (the interictal as well as the ictal SPECT), and because ictal SPECT requires concurrent inpatient VEM (compared with MRI and PET, which can be performed on the patient as an outpatient in the interictal state). In most cases, extra days of VEM, beyond those required for the routine monitoring, are required to achieve a satisfactory ictal SPECT radiotracer injection, and this cost has been incorporated into the estimates for ictal-interictal SPECT.
The cost savings after a class I/II outcome over a lifetime of direct medical costs (e.g., medications, hospital visits, medical consultations) was estimated at $440,000 per patient (limits for sensitivity analysis, $0–700,000/patient). This estimate did not include indirect cost savings that would be expected to occur after successful epilepsy surgery, for example, improved employment prospects, driving, psychosocial functioning, and the like, as these are more difficult to quantify accurately. For these cost-savings calculations, it was assumed that no patient who was medically treated would have a class I or II outcome for seizures (3).
For the sensitivity analyses, the following were varied between their 95% confidence limits: the prevalence of class I/II outcome, the proportion of EEG/MRI findings that are indeterminate, the specificity of EEG/MRI for a class I/II outcome, the sensitivity and specificity of SPECT for a class I/II outcome, and the sensitivity and specificity of PET for a class I/II outcome.
The endpoints for the decision analysis were the proportion of potential class I/II outcomes identified by each strategy (i.e., sensitivity), the total costs of investigations and surgery per patient for each strategy, the cost per class I/II outcome for each strategy and the extra cost per additional class I/II outcome of SPECT and PET strategies as compared with the MRI and VEM strategy alone, and the net cost savings produced by each strategy associated with a class I/II outcome.
RESULTS
Localization Results of Tests
The rates at which 18F-FDG PET, MRI, VEM, intracranial EEG monitoring, and ictal-interictal SPECT produced localizing information are summarized in Table 2. The concordance of the localization by each of the tests with the final CEP localization is demonstrated in Supplemental Table 1.
Localizing Rates of Investigations in 176 Patients Who Underwent Presurgical Evaluation for Medically Refractory Focal Epilepsy
Relationship of Test Results to Surgical Outcome
Epilepsy surgery was subsequently performed in 63 (36.6%) of the patients. The mean postsurgical follow-up was 39.1 mo (range, 24–61 mo). At last follow-up, seizure outcome in the surgical patients was designated as class I in 45 (71.4%), class II in 1 (1.6%), class III in 13 (20.6%), and class IV in 4 (6.3%).
Supplemental Table 2 summarizes the health impact of having a localizing MRI or VEM on postsurgical outcome. In the 39 patients in whom both MRI and VEM were localizing, a majority proceeded to have surgery. Where neither of the 2 tests was localizing, none of the patients proceeded to surgery. It was in the 90 patients in whom 1 of the 2 primary tests was nonlocalizing or nonconcordant that PET made the major health impact (this information is available online as Supplemental Table 3).
Decision Tree Analysis
The results of the decision tree sensitivity analysis are summarized in Table 3. Of the 3 imaging strategies, the VEM/MRI-only strategy generally had the lowest cost per class I/II outcome but always identified fewer patients with a potential class I/II outcome than the other 2 imaging strategies. The cost per additional class I/II outcome (incremental cost-effectiveness ratio) for the +PET and +SPECT strategies was always below the minimum reported cost savings for a class I/II outcome (i.e., it is financially worthwhile to investigate VEM/MRI-indeterminate patients). The cost per class I/II outcome was always higher for the +SPECT strategy than for the VEM/MRI strategy. However, the +PET strategy had a lower cost per class I/II outcome than the VEM/MRI strategy for high values of prevalence of class I/II outcome or fraction of intermediate VEM/MRI tests and for maximal estimates of PET diagnostic performance. The +PET strategy consistently detected the highest proportion of potential class I/II outcomes unless ictal SPECT sensitivity exceeded PET sensitivity.
Results of Decision Tree Sensitivity Analysis
The only conditions whereby the +SPECT strategy would produce a lower cost per class I/II outcome were if the SPECT sensitivity was at the upper confidence limit and either the PET sensitivity or PET specificity were at the lower confidence limit. Such circumstances are highly improbable. Hence, no valid conditions exist in which the +SPECT strategy is likely to produce a lower total cost per class I/II outcome than the +PET strategy. Thus, the PET strategy is at least as cost-effective, and most probably more cost-effective, than the +SPECT strategy. Both strategies, however, are more effective than the MRI- and VEM-only strategies.
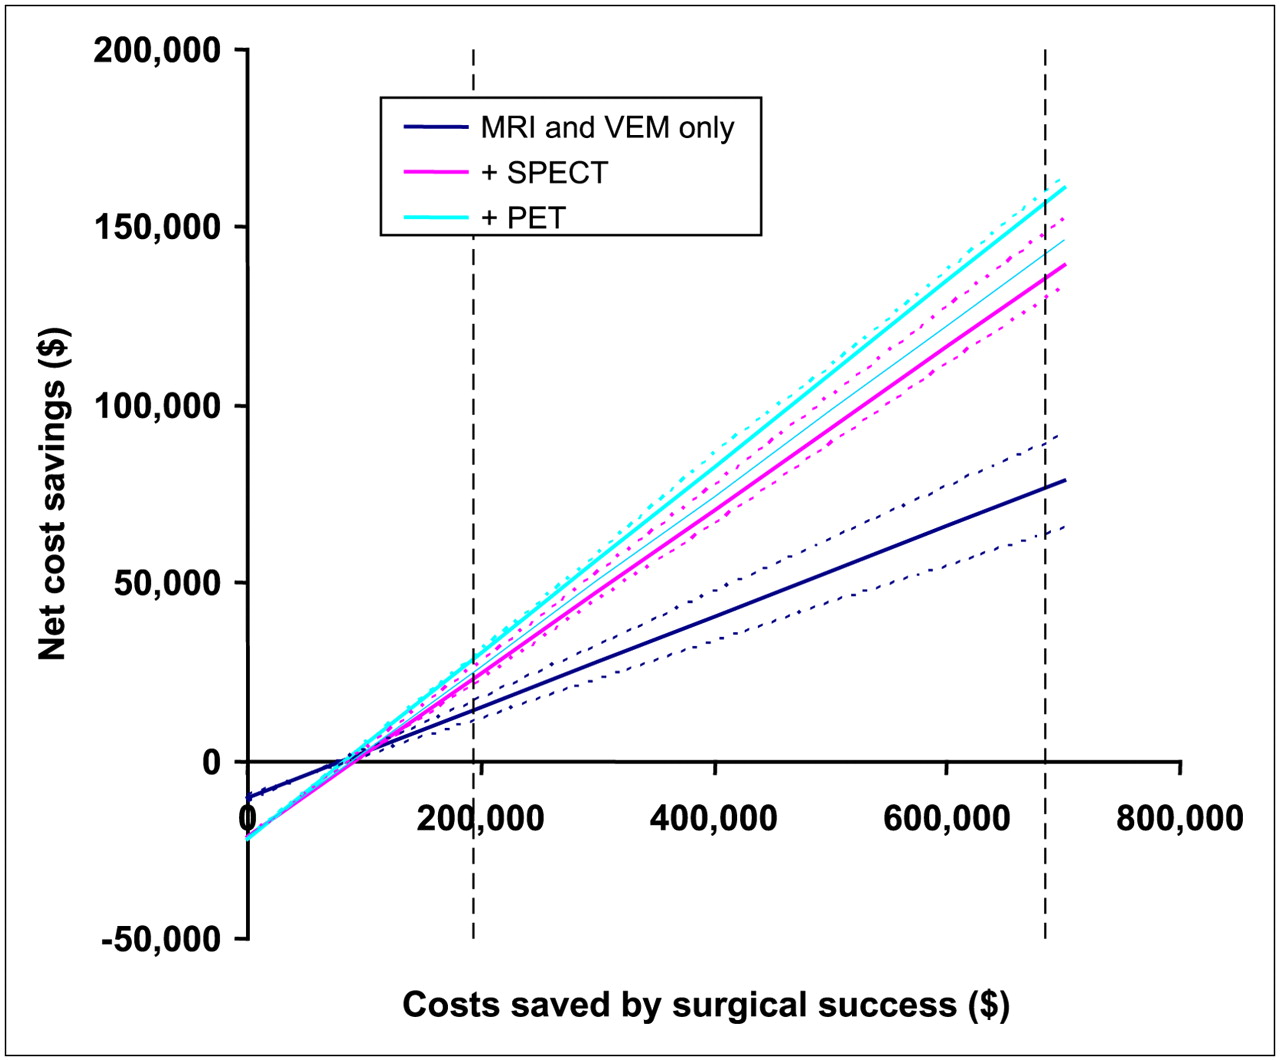
Within the range of cost savings estimated to be associated with a class I/II outcome, all imaging strategies produced net cost savings; however, these were significantly higher for the +PET and the +SPECT strategies than for the VEM/MRI strategy (Fig. 1). The sensitivity analysis showed the cost savings for the VEM/MRI strategy to be most sensitive to VEM/MRI specificity, whereas the +SPECT strategy was most sensitive to SPECT sensitivity and the +PET strategy was most sensitive to the PET sensitivity. The upper and lower limits of these parameters were used to define confidence limits of calculated cost savings. Ictal SPECT sensitivity would have to exceed the PET sensitivity for the +SPECT strategy to produce greater cost savings and be more cost-effective than the PET strategy. The 95% confidence limits of the difference in sensitivity between PET and ictal SPECT are −0.0007 to 0.3006. Thus, the probability of SPECT sensitivity exceeding PET sensitivity is marginally above 2.5%.

Plot of cost savings (over medical treatment only) for 3 imaging strategies (VEM/MRI, + SPECT, + PET) with confidence limits determined from sensitivity analysis (dotted lines). Vertical dashed lines indicate reported upper and lower values for cost savings produced by successful epilepsy surgery.
DISCUSSION
This is, to our knowledge, the first study to apply decision tree analysis to assess the cost-effectiveness of different strategies for using 18F-FDG PET to localize the epileptogenic zone in the evaluation of patients with medically refractory focal epilepsy who are being considered for epilepsy surgery. It is unique among studies of the value of neuroimaging investigations in epilepsy surgery evaluation as it is, to our knowledge, the first to include investigation results for patients not undergoing surgery in addition to those who underwent surgery. The results of the study demonstrate that within the range of cost savings estimated to be associated with a class I/II outcome, all 3 investigation strategies evaluated (i.e., MRI and VEM alone, MRI and VEM followed by PET in indeterminate cases [+PET], and MRI and VEM followed by SPECT in indeterminate cases [+SPECT]) produced cost savings, compared with ongoing medical therapy for all. The +PET and +SPECT strategies produce greater cost savings than the MRI/VEM-only strategy, and there is a greater than 95% probability that the +PET strategy is at least as cost-effective, and is most probably more cost-effective, than the +SPECT strategy.
This study used decision tree analysis rather than an observational randomized control trial (RCT). RCTs, although well established in the assessment of therapeutic maneuvers, present distinct difficulties when applied to diagnostic imaging technologies. They are expensive (U.S. $1–2 million per study) and take a long time to accomplish (some protocols require more than 4 y to complete) (38). As diagnostic imaging technologies are evolving rapidly and unpredictably, such prolonged studies are at risk of being outdated by the time they are complete. RCTs can also be associated with ethical difficulties that result from the requirement to randomize patients to a study arm comprising a diagnostic imaging method already shown to be less accurate than the new technology under evaluation. This is likely to be a particular problem when the new imaging technology has already become widely accepted in many countries. Furthermore, accurate observation of the impact of imaging on ultimate outcomes is constrained by the many steps in the care process that intervene between diagnostic imaging and ultimate outcome. The statistical variance that arises at each of these steps obscures the effects of imaging, making the impact on the ultimate outcome difficult or even impossible to observe (38).
One of the limitations of the study was a lack of outcome data in the nonoperated patients, which introduces verification bias. It was assumed that none of these patients would have had a class I/II outcome, which is reasonable given the evidence that patients with medically refractory epilepsy who do not have surgery almost always continue to have seizures (3). However, as a small proportion (<5%) of patients who do not undergo surgery may achieve seizure remission (39), future studies could incorporate this finding into the decision tree modeling. Another potential limitation is that not all patients who were assessed by the CEPs over the study period were referred for PET, but the vast majority of the primary target group of those patients with either nonlocalizing or equivocal VEM or MRI results were referred for PET before further consideration of epilepsy surgery. In addition, in our modeling we have assumed that for patients in whom the MRI and VEM results were localizing and concordant, neither PET nor SPECT was necessary for the patient to proceed to surgery. The surgical strategy in these patients is usually to resect, where possible, the entire MRI lesion, and it is uncommon for the result of the PET or SPECT to significantly influence this strategy (4,40). We therefore chose to evaluate clinical algorithms where these functional imaging tests were used only in patients who had a nonlocalizing or nonconcordant MRI and VEM, where the potential impact of these additional tests is greatest.
The costs used for the modeling in this study used figures for the Australian heath care system. Although the specifics of these costs vary from country to country, their relative proportions are likely to be similar to those for other developed countries, and therefore similar results would be expected to be obtained for the comparison of various decision pathways. However, to be certain of this the modeling should be repeated using costs specific to the country. This limitation notwithstanding, within the Australian health care environment as a representative Western medical system, 18F-FDG PET is cost-effective in the presurgical evaluation of patients with a nonlocalizing or nonconcordant VEM or MRI, with a significant incremental increase in patients who are successfully localized and therefore able to proceed to successful epilepsy surgery.
CONCLUSION
This study adds to the growing literature indicating that 18F-FDG PET provides prognostically important, and now also cost-effective, information in the presurgical evaluation for seizure outcome by either visual or quantitative analysis (9–19). The results strengthen the case for including 18F-FDG PET as part of the presurgical evaluation, particularly in patients in whom either the MRI or the VEM gives nonlocalizing or nonconcordant results.
Acknowledgments
We acknowledge Professor Andrew Kaye, Department of Neurosurgery, The Royal Melbourne Hospital, and Associate Professor Michael Murphy, Department of Neurosurgery, St. Vincent's Hospital Melbourne, for performing the neurosurgical resections on the patients reported in this series.
Footnotes
-
COPYRIGHT © 2008 by the Society of Nuclear Medicine, Inc.
References
- Received for publication October 15, 2007.
- Accepted for publication February 18, 2008.


Jump to section
Related Articles
Cited By...
- Simultaneously Acquired MRI Arterial Spin-Labeling and Interictal FDG-PET Improves Diagnosis of Pediatric Temporal Lobe Epilepsy
- 18F-Flumazenil: A {gamma}-Aminobutyric Acid A-Specific PET Radiotracer for the Localization of Drug-Resistant Temporal Lobe Epilepsy
- Diagnostic Evaluation in Patients with Intractable Epilepsy and Normal Findings on MRI: A Decision Analysis and Cost-Effectiveness Study
- PET of Serotonin 1A Receptors and Cerebral Glucose Metabolism for Temporal Lobectomy