


Abstract
B lymphocytes are a key pathologic feature of multiple sclerosis (MS) and are becoming an important therapeutic target for this condition. Currently, there is no approved technique to noninvasively visualize B cells in the central nervous system (CNS) to monitor MS disease progression and response to therapies. Here, we evaluated 64Cu-rituximab, a radiolabeled antibody specifically targeting the human B cell marker CD20, for its ability to image B cells in a mouse model of MS using PET. Methods: To model CNS infiltration by B cells, experimental autoimmune encephalomyelitis (EAE) was induced in transgenic mice that express human CD20 on B cells. EAE mice were given subcutaneous injections of myelin oligodendrocyte glycoprotein fragment1–125 emulsified in complete Freund adjuvant. Control mice received complete Freund adjuvant alone. PET imaging of EAE and control mice was performed 1, 4, and 19 h after 64Cu-rituximab administration. Mice were perfused and sacrificed after the final PET scan, and radioactivity in dissected tissues was measured with a γ-counter. CNS tissues from these mice were immunostained to quantify B cells or were further analyzed via digital autoradiography. Results: Lumbar spinal cord PET signal was significantly higher in EAE mice than in controls at all evaluated time points (e.g., 1 h after injection: 5.44 ± 0.37 vs. 3.33 ± 0.20 percentage injected dose [%ID]/g, P < 0.05). 64Cu-rituximab PET signal in brain regions ranged between 1.74 ± 0.11 and 2.93 ± 0.15 %ID/g for EAE mice, compared with 1.25 ± 0.08 and 2.24 ± 0.11 %ID/g for controls (P < 0.05 for all regions except striatum and thalamus at 1 h after injection). Similarly, ex vivo biodistribution results revealed notably higher 64Cu-rituximab uptake in the brain and spinal cord of huCD20tg EAE, and B220 immunostaining verified that increased 64Cu-rituximab uptake in CNS tissues corresponded with elevated B cells. Conclusion: B cells can be detected in the CNS of EAE mice using 64Cu-rituximab PET. Results from these studies warrant further investigation of 64Cu-rituximab in EAE models and consideration of use in MS patients to evaluate its potential for detecting and monitoring B cells in the progression and treatment of this disease. These results represent an initial step toward generating a platform to evaluate B cell–targeted therapeutics en route to the clinic.
There is a growing appreciation of the importance of B cells in multiple sclerosis (MS) (1). MS patients exhibit B cells in brain parenchyma, meninges, and primary and secondary lymphoid tissue. In meninges, B cells are reported in ectopic lymphoid follicle-like structures (2). Follicle-like structures vary in the number of structures per case and in the number of cells per structure, from 50 to several hundreds to thousands of B cells. These structures have been implicated in maintaining autoimmunity and exacerbating disease. Antibodies targeting CD20 expressed on both immature and mature B cells have exhibited impressive clinical results. In phase 2 and 3 trials of rituximab (Rituxan; Genentech and Biogen Idec), treatment was associated with a significant reduction in the number of relapses and decreased lesion formation in a subgroup of patients (3). Rituximab’s successors, ocrelizumab (Roche, Genentech) and ofatumumab (Novartis), have since shown improved biologic properties and reduced immunogenicity (4). Although CD20 antibody therapy is clearly beneficial to MS patients, no clinical tool exists to evaluate whether there is a preferential benefit in patients with B cell–driven disease.
A landmark study using patient postmortem tissue and standard immunohistochemistry techniques identified 4 primary lesion types in MS, with type II patients having the largest involvement of B cell subsets and the best likelihood of response to plasma exchange therapy (5). PET imaging may aid in identifying the patients most likely to respond to B cell–targeted therapies (i.e., patient stratification). Radiologic imaging has the advantage of being noninvasive and dynamic, allowing clinicians to monitor response longitudinally without the need for invasive biopsies. Furthermore, biopsies are not always possible in MS patients and do not capture global information from all lesions. PET imaging could provide clues regarding the extent and size of B cell follicle-like structures in the central nervous system (CNS), the degree of peripheral versus central B cell involvement, and the respective longitudinal changes over the course of disease or treatment. To the best of our knowledge, PET imaging of B cells in MS has not yet been studied. For these reasons, there exists a compelling need for the development and application of a B cell–specific PET tracer for monitoring MS.
Here, we propose the application of an anti-CD20 immuno-PET tracer, 64Cu-rituximab, for imaging B cells in experimental autoimmune encephalomyelitis (EAE) mice, a rodent model used to study MS. We will test our hypothesis that B cells can be detected systemically and in the CNS of living mice displaying MS disease characteristics. These experiments will provide critical insights that will help guide future clinical studies to evaluate 64Cu-rituximab PET for its potential to stratify patients, predict responders, and improve clinical decision making for patients with MS and other B cell–related autoimmune diseases.
MATERIALS AND METHODS
Study Design
Experiments involving animals were performed using protocols approved by the Institutional Animal Care and Use Committee of Stanford University. Three groups of huCD20Tg mice (6) expressing human CD20 on all B cells were used for these studies. The first group was for histologic analysis of B cell numbers in mice after induction of EAE (n = 7) versus naïve mice (n = 5) (without rituximab); the second group was for flow cytometry of B cells in spleen and blood samples 19 h after intravenous treatment with nonradioactive rituximab (1 or 3 μg in 150 μL of 0.9% sodium chloride solution, n = 5 and 4, respectively) or vehicle (0.9% sodium chloride solution, n = 6); and the third group was for in vivo PET studies (n = 4 per group), ex vivo biodistribution (n = 5 per group), ex vivo autoradiography (n = 3 per group), and histology (n = 4 per group). PET imaging time points of 1, 4, and 19 h were chosen (along with ex vivo biodistribution at 24 h) since our group has observed suitable signal-to-background ratios with 64Cu-rituximab in huCD20tg mice at 4 and 24 h after tracer injection. Previously, we have shown that signal in spleen (an organ containing a large pool of CD20-expressing B cells) decreases at 48 h compared with the high signal-to-background ratio observed at 4 and 24 h (7). To assess the specificity of 64Cu-rituximab for imaging human CD20 in EAE mice, control C57BL/6 mice devoid of human CD20 were induced with EAE (n = 3) and imaged with 64Cu-rituximab, with the goal of comparing the PET signal in these mice with that of naïve C57BL/6 mice (n = 3) and huCD20tg EAE mice (containing human CD20, n = 4). huCD20Tg and littermate control mice were backcrossed to the C57BL/6 genetic background for more than 12 generations for these studies. 64Cu was chosen for these initial studies because of previous experience (7) and access to an approved institutional investigational new drug application for 64Cu-rituximab. Such studies can also be performed with 89Zr-labeled rituximab (e.g., clinical imaging of lymphoma) (8).
EAE Induction
Mice (4–6 mo old) were immunized subcutaneously with a total of 200 μg of myelin oligodendrocyte glycoprotein fragment1–125 protein emulsified in complete Freund adjuvant containing a 5 mg/mL concentration of mycobacteria (customized kit from Hooke Laboratories Inc.). The mice received an intravenous injection of 200 ng of pertussis toxin (Hooke Laboratories Inc.) at the time of immunization and 48 h later. The mice were weighed and examined daily for clinical signs of EAE using standard scoring—that is, 0, no paralysis; 1, loss of tail tone; 2, hind limb weakness or paresis; 3, hind limb paralysis; 4, hind limb paralysis and forelimb paresis; 5, moribund or deceased.
Immunostaining and Quantitation
Brains and spinal cords were fixed in 4% paraformaldehyde in phosphate buffer for 24 h and then sunk in 30% sucrose in phosphate-buffered saline. Free-floating 40-μm sagittal sections were collected through the entire brain, and 40-μm transverse sections were collected through the lumbar and thoracic or cervical spinal cord using a Microm HM 450 sliding microtome (Thermo Scientific) and stored in cryoprotective medium at −20°C. Immunostaining was performed following standard protocols and used biotinylated anti-B220/CD45R antibody (1:500; BD Pharmigen). For visualization, sections were immersed in a Vectastain Elite ABC kit (Vector Laboratories) followed by 0.05% 3,3-diaminobenzidine (Sigma) in Tris-buffered saline with 0.03% H2O2. For image acquisition of B220-labeled B cells, digitized images were captured with a Zeiss AxioImager M2 light microscope using AxioVision software. B cells were quantified by a masked experimenter on an Olympus upright light microscope at 40× magnification in 3 whole sagittal brain sections per mouse and in 5 whole spinal cord sections per mouse. B cell densities were calculated using brain or spinal cord section areas, which were measured using ImageJ software.
Fluorescence-Activated Cell Sorting (FACS)
The mice were anesthetized with isoflurane in an induction chamber. The submandibular vein was punctured with a 25-gauge needle, and 4–6 drops of blood were collected and placed in a collection tube containing 10% heparin. Blood samples were added to 4 mL of 1× lysis buffer (Biolegend) and left at room temperature for 10 min followed by incubation at 37°C for 5 min with shaking. The cells were washed twice with sterile 1× phosphate-buffered saline and spun at 350g for 5 min. Pellets were resuspended in FACS buffer with 1% bovine serum albumin for subsequent flow cytometric analysis.
The spleens were harvested and minced in 10-mm tissue culture plates containing sterile 1× phosphate-buffered saline (without calcium chloride and magnesium chloride) and then twice filtered through a 70-μm cell strainer (BD 352350) to achieve a single-cell suspension. The cells were pelleted by centrifugation (350g), and the pellet was resuspended in 5 mL of 1× lysis buffer and incubated on ice for 5 min with occasional shaking. The reaction was stopped by diluting the lysis buffer with 20–30 mL of 1× phosphate-buffered saline. The cells were spun (350g), and the supernatant was discarded. The pellet was washed and resuspended in FACS buffer with 1% bovine serum albumin for subsequent flow cytometric analysis.
The cells were immunostained immediately after blocking of Fc receptors with anti-CD16/32 (BD Biosciences) to prevent nonspecific binding. B lymphocytes were identified by allophycocyan-labeled antimouse CD19 (Biolegend 115512) and fluorescein isothiocyanate–labeled antimouse B220/CD45R (BioLegend 103205). A fixable dead cell stain (Molecular Probes L23101) was used to distinguish between live and dead cells.
DOTA Conjugation
Rituximab was conjugated with DOTA using standard published procedures and metal-free buffers (9). The number of chelators coupled per antibody molecule was estimated to be 1.8 via matrix-assisted laser desorption ionization time-of-flight mass spectrometry by comparison of rituximab with DOTA-rituximab.
Radiosynthesis
DOTA-rituximab was radiolabeled with 64CuCl2 (University of Wisconsin) using standard methods and metal-free buffers (9). 64Cu-rituximab was obtained with high specific radioactivity (>75 GBq/μmol), radiochemical purity (>99%), and labeling efficiency (70%–95%) and formulated in phosphate-buffered saline (0.1 M NaCl, 0.05 M sodium phosphate, pH 7.4). The immunoreactivity of 64Cu-DOTA-rituximab was evaluated in quadruplicate using previously described procedures (10), with a 4:1 silicone oil–mineral oil mixture in place of the described phthalate oil mixture. Ramos CD20+ cells (3 × 10⁵ to 3 × 10⁶ cells) were used to determine the immunoreactive fraction, which was found to be more than 75%.
PET Imaging
PET images were acquired using a hybrid small-animal PET/CT scanner (Inveon; Siemens) and reconstructed using 2 iterations of a 3-dimensional ordered-subsets expectation-maximization algorithm (12 subsets) and 18 iterations of the accelerated version of 3D-MAP (i.e., FASTMAP) (matrix size of 128 × 128 × 159). Attenuation correction was applied to the dataset from the CT image. No partial-volume corrections were performed. The mice were anesthetized using isoflurane gas (2.0%–3.0% for induction, 1.5%–2.5% for maintenance). Each mouse was injected with 64Cu-rituximab (1.3–3.7 MBq) via the tail vein. CT images were acquired just before each PET scan to provide an anatomic reference frame for the respective PET data. The calibration factor for 64Cu PET was determined using a 20-mL syringe containing a known amount of radioactive 64Cu. PET and CT image files were coregistered and analyzed with Inveon Research Workspace software (version 4.0; Siemens) and VivoQuant image analysis software (version 2.0; inviCRO). Inveon Research Workspace software was used to generate images for figures, whereas VivoQuant was used to quantify tracer uptake in specific brain regions and the spinal cord. For analysis of brain uptake, a 3-dimensional mouse brain atlas was fitted to PET/CT images and radioactivity concentrations were obtained using automated regions of interest (ROIs) for cerebellum, cortex, hippocampus, hypothalamus, medulla, midbrain, pons, striatum, and thalamus. For analysis of 64Cu-rituximab uptake in the spinal cord, the vertebral column was first isolated by Otsu thresholding and the resulting ROI was made immutable. An ROI of the spinal cord was then drawn, from the caudal end of the skull to the pelvis, using the segmented vertebral column as a guide. For analysis of regional variations in spinal cord PET signal, the spinal cord was divided, using L1–L5 as landmarks, into cervical/thoracic and lumbar ROIs (Supplemental Figs. 1A–1C; supplemental materials are available at http://jnmt.snmjournals.org). The radioactive concentration (Bq/cm3) for each ROI was obtained and subsequently divided by the decay-corrected dose at the time of the PET scan for each mouse and multiplied by 100 to determine the percentage injected dose per gram (%ID/g).
Ex Vivo Biodistribution and Autoradiography
Tissues were collected for biodistribution and ex vivo autoradiography 24 h after injection of 64Cu-rituximab, using previous methods (11).
Statistics
Statistical analyses were performed using GraphPad Prism (version 6). Data are expressed as mean ± SEM, unless otherwise indicated. Two-tailed Mann–Whitney U tests were used for group comparisons, 2-way ANOVA tests were used for multiple comparisons, and a P value of 0.05 was considered significant.
RESULTS
EAE was induced in huCD20tg mice to evaluate the utility of 64Cu-rituximab as a PET tracer for imaging B cells in MS. huCD20tg mice were chosen for these studies, in lieu of C57BL/6 mice, since their B cells express the more clinically relevant PET target, human CD20. Monson et al. reported that the expression of human CD20 by B cells does not significantly affect the immune response leading to EAE, as determined by comparing peak disease severity between huCD20tg and wild-type littermates after EAE induction via subcutaneous immunization with myelin oligodendrocyte glycoprotein fragment1–125 (6). The peak disease severity for mice in our studies was observed on day 14; clinical scores ranged from 2.5 to 4.0. (Supplemental Fig. 2).
B220 immunostaining of brain and spinal cord at the peak of EAE disease severity (i.e., score 2.5–4.0) was conducted to first verify that B cells infiltrate the CNS of huCD20tg EAE mice and that this model can therefore be used for evaluation of 64Cu-rituximab. Immunohistochemistry results (Fig. 1) revealed significantly more B220+ cells in EAE CNS tissues than in age-matched naïve mice (brain and meninges: 3.09 ± 0.63 vs. 0.62 ± 0.18 cells/mm2, P = 0.018; lumbar spinal cord: 28.57 ± 4.96 vs. 2.20 ± 0.49 cells/mm2, P = 0.003; thoracic/cervical spinal cord: 17.15 ± 4.35 vs. 1.86 ± 0.39 cells/mm2, P = 0.003). Of note, there were clusters of B cells in the meninges of EAE huCD20tg mice (Fig. 1A) similar to B cell follicle-like structures found in the meninges of patients with secondary progressive MS (12). B220+ cells observed in spinal cord were more numerous than those found in brain overall (Fig. 1B) but were more diffusively distributed in the white matter of the cord, as opposed to existing in clusters.
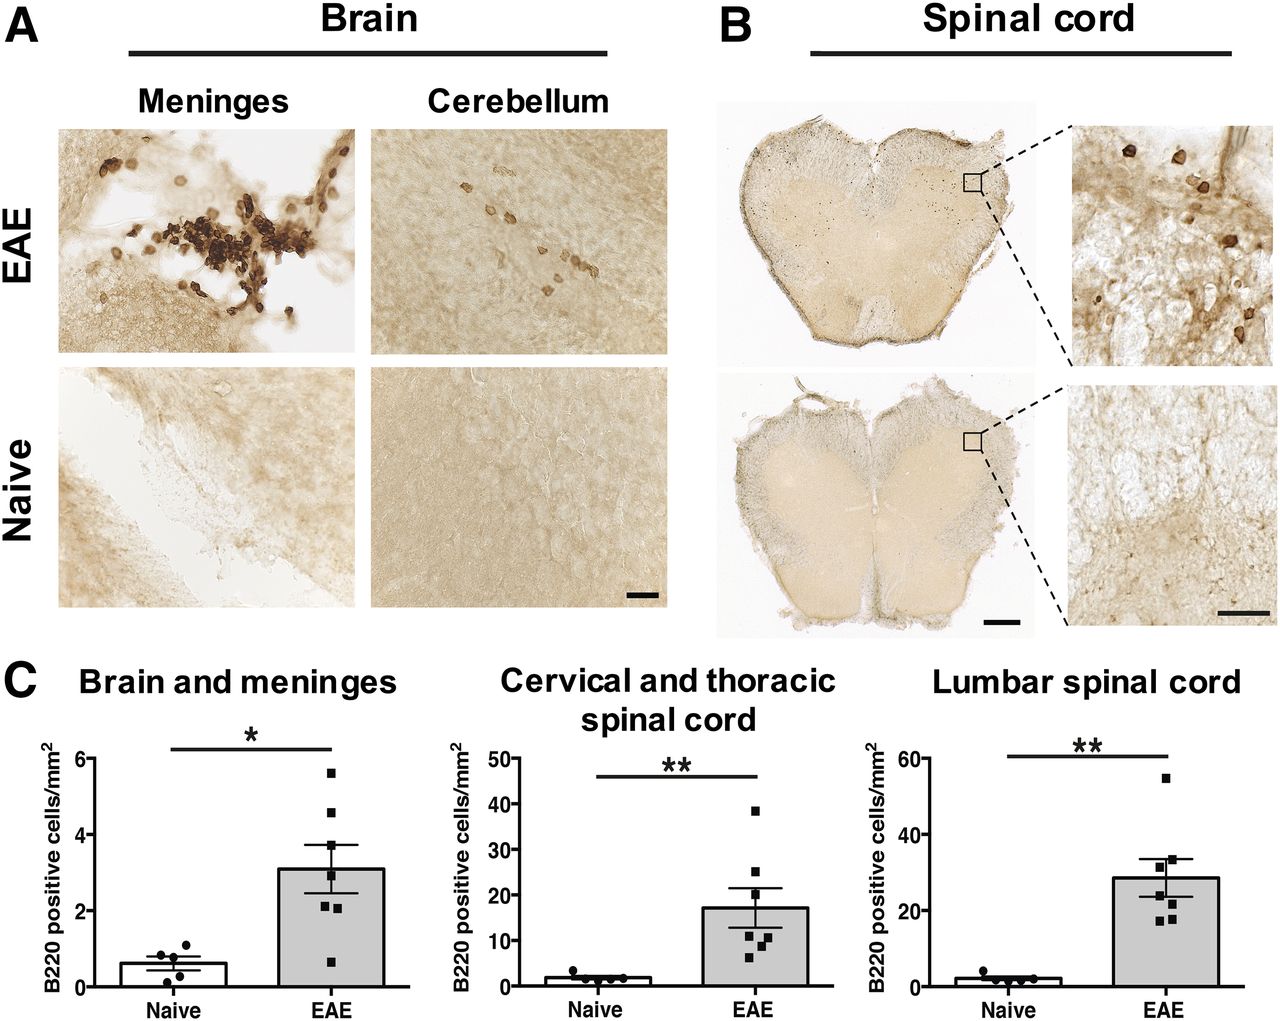
(A and B) Representative images of B220+ B cells in huCD20tg mouse brain (A) and spinal cord (B). Scale bars are 25 μm in high-magnification images and 500 μm in low-magnification images. (C) Quantitation of B220+ cells/mm2 in CNS tissues from EAE mice (n = 7) vs. naïve (n = 5) mice. *P < 0.05. **P < 0.01.
Since rituximab is known to potently deplete B cells even at low doses (13,14), we set out to investigate whether a typical PET tracer dose of rituximab could lead to a pharmacologic effect. The specific activity of 64Cu-rituximab routinely achieved was 1.3 MBq/μg, meaning that a typical PET tracer dose of 1.3–3.7 MBq contains approximately 1–3 μg of rituximab. On the basis of this knowledge, we administered either 1 or 3 μg of unlabeled rituximab in 150 μL of 0.9% sodium chloride (saline) solution intravenously to 2 separate groups of huCD20tg mice alongside a group that received saline alone. After waiting 19 h for unlabeled rituximab to circulate and bind CD20, we performed FACS of peripheral blood and spleens from these mice to quantify B cell numbers. We observed significant depletion of B cells in spleens of mice that had been treated with a single 3-μg dose of rituximab compared with untreated mice (percentage of CD19+ B220+ lymphocytes: 31.94 ± 2.65 vs. 46.12 ± 2.04, P = 0.002) and a trend toward reduction of B cells in blood (percentage of CD19+ B220+ lymphocytes: 43.20 ± 5.21 vs. 57.88 ± 1.29, P = 0.09) (Fig. 2). There was no significant difference in the percentage of CD19+ B220+ lymphocytes in spleens from mice treated with 1 μg compared with the saline group (44.72 ± 2.40 vs. 46.12 ± 2.04, P = 0.66); however, there was a slight trend toward B cell depletion in blood (1-μg–treated mice, 50.50 ± 4.37, vs. saline-treated mice, 57.88 ± 1.29; P = 0.17). In accordance with these results, an upper limit of 1 μg of rituximab mass to be injected per mouse was set to ensure a minimal effect on the population of cells we sought to image (∼1.3–3.7 MBq, based on the specific activity of a given batch). Even at this very low mass amount used for PET imaging, subsequent B220 immunostaining (19 h after administration of tracer) showed that a portion of B cells exhibited a staining pattern and morphology indicative of some potential rituximab-induced cell damage or death in regions of the brain and spinal cord (Supplemental Fig. 3).

(A and B) FACS gating for blood (A) and spleen (B). (C) Percentage of CD19+B220+ cells in blood and spleen from huCD20tg mice 19 h after single intravenous dose of rituximab (1 or 3 μg) or saline. **P < 0.01.
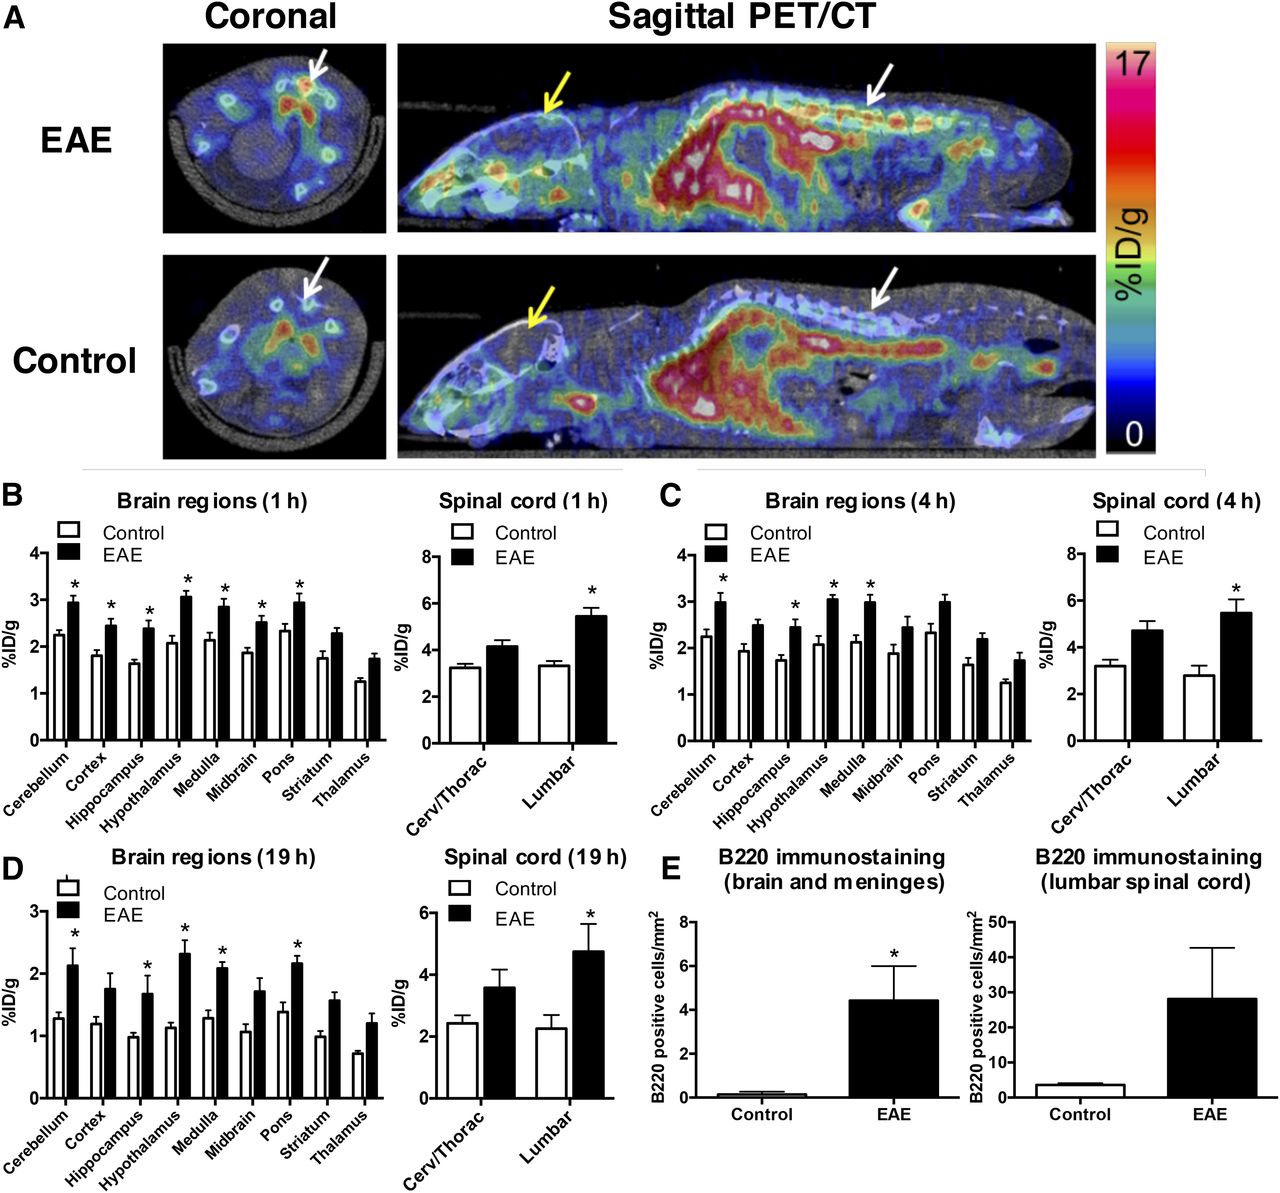
PET imaging results showed that the 64Cu-rituximab PET signal in lumbar spinal cord was significantly higher in huCD20tg EAE mice than in controls, as early as 1 h after injection of the radiotracer (5.44 ± 0.37 vs. 3.33 ± 0.20 %ID/g, P < 0.05) (Figs. 3A and 3B). Additionally, there was a strong trend toward higher uptake in the cervical and thoracic regions of the spinal cord (4.15 ± 0.28 vs. 3.23 ± 0.18 %ID/g, P = 0.057). Uptake in specific brain regions ranged between 1.74 ± 0.11 and 2.93 ± 0.15 %ID/g for EAE mice compared with 1.25 ± 0.08 and 2.24 ± 0.11 %ID/g for controls (P < 0.05 for all regions except striatum and thalamus). Similar differences in CNS uptake for EAE and control mice were observed at both 4 and 19 h after injection of 64Cu-rituximab (Figs. 3C and 3D). The specificity of the 64Cu-rituximab PET signal for human CD20 was confirmed by imaging C57BL/6 mice with the same EAE score as huCD20tg EAE mice (i.e., 2.5–4.0). The results from these studies demonstrated a significantly lower 64Cu-rituximab PET signal in C57BL/6 EAE mice (devoid of human CD20) than in huCD20tg EAE mice in cervical/thoracic (2.31 ± 0.05 vs. 4.15 ± 0.28 %ID/g, P = 0.0005) and lumbar spinal cord (2.24 ± 0.12 vs. 5.44 ± 0.37 %ID/g, P < 0.0001), as well as in certain brain regions (i.e., cortex, hypothalamus, medulla, and pons, P < 0.05) at 1 h after injection of the tracer (Supplemental Fig. 4).

(A) Representative PET/CT images 1 h after 64Cu-rituximab injection. White and yellow arrows point to spinal cord and brain, respectively. (B–E) Graphs depict 64Cu-rituximab uptake in brain and spinal cord regions of EAE and control mice, quantified from PET images 1 h (B), 4 h (C), and 19 h (D) after tracer injection. (E) Quantitation of B220+ cells/mm2 in CNS tissues from EAE and control mice 19 h after 64Cu-rituximab. n = 4 per group. *P < 0.05.
B220 immunostaining of CNS tissues from mice that underwent PET imaging verified that increased 64Cu-rituximab uptake in brain and spinal-cord regions corresponded with elevated numbers of B220+ cells (brain and meninges: 0.14 ± 0.06 [naïve] vs. 4.42 ± 1.57 [EAE], P = 0.029; lumbar spinal cord: 3.61 ± 0.28 [naïve] vs. 28.12 ± 14.55 [EAE], P = 0.114) (Fig. 3E).
Biodistribution results corroborated PET imaging data, revealing significantly elevated 64Cu-rituximab uptake in spinal cord of huCD20tg EAE mice (lumbar: 1.05 ± 0.12 vs. 0.21 ± 0.04 %ID/g; thoracic/cervical: 0.69 ± 0.10 vs. 0.20 ± 0.04 %ID/g, P < 0.01) and a trend toward elevated 64Cu-rituximab binding in whole brain of EAE mice (0.23 ± 0.04 vs. 0.11 ± 0.02 %ID/g, P = 0.09) (Fig. 4A). The only significant difference in 64Cu-rituximab uptake in peripheral tissues was observed in spleen, whereby there was higher signal in EAE than in age-matched control mice (21.70 ± 2.27 vs. 6.34 ± 0.87 %ID/g, P < 0.01) (Fig. 4A).
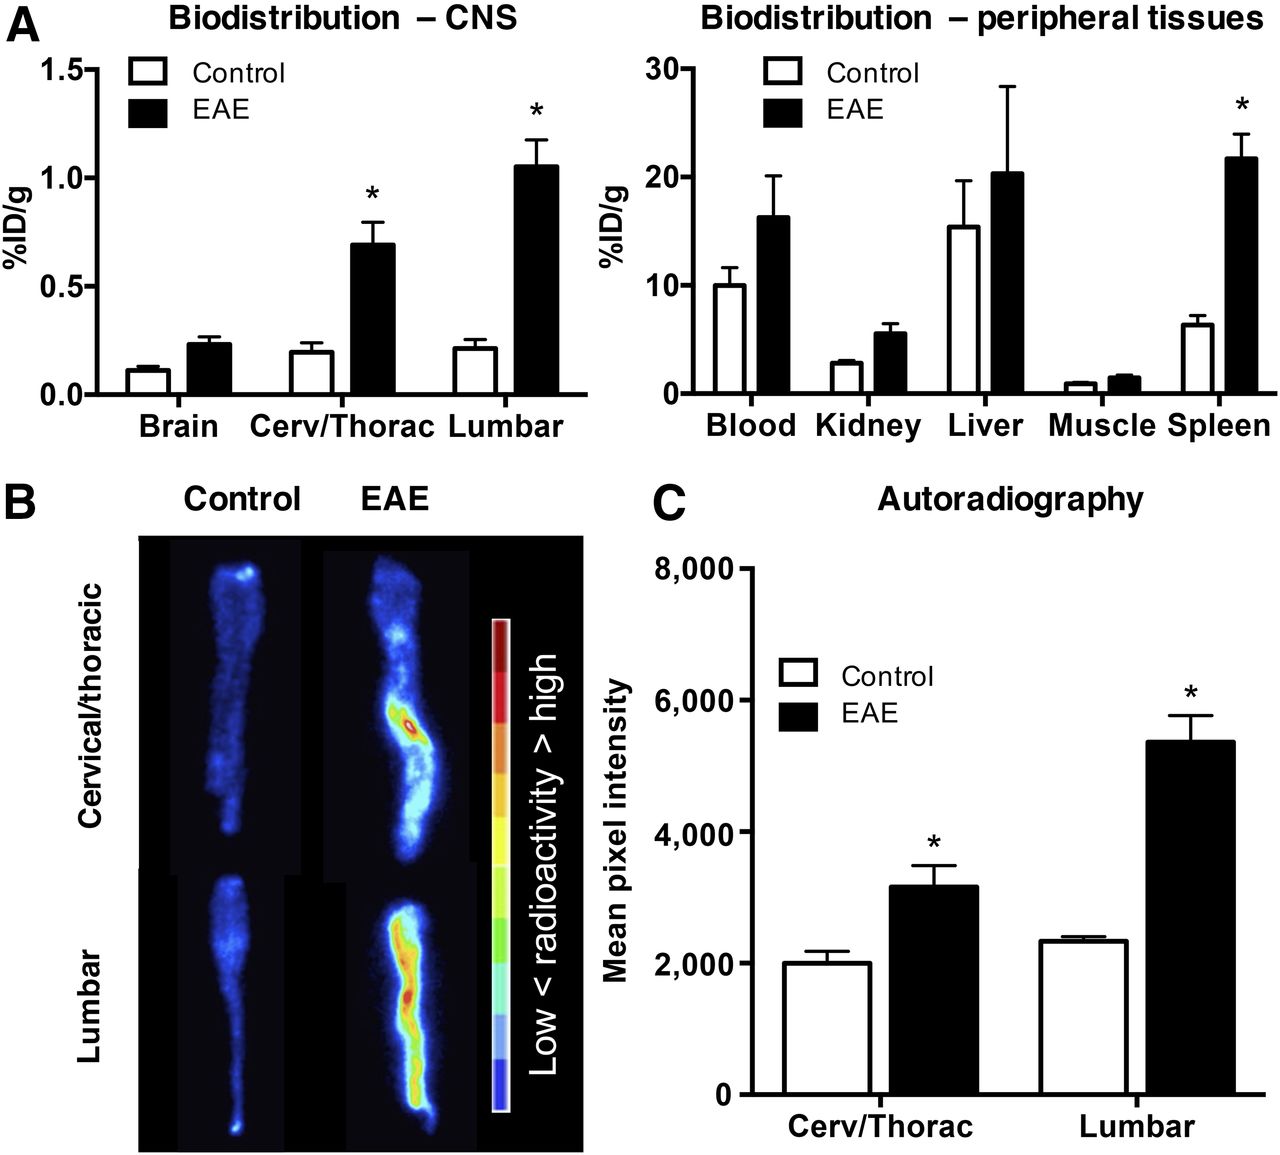
(A) 64Cu-rituximab biodistribution in CNS and peripheral tissues 24 h after injection. n = 5 per group. (B and C) Images (B) and quantitation (C) of spinal cord autoradiography from EAE and control mice. n = 3 per group. *P < 0.05.
Digital autoradiography spinal cord results agreed with the findings from ex vivo biodistribution and in vivo PET imaging. That is, there was a significantly greater signal in EAE than in control mice (mean pixel intensity in lumbar: 5,360 ± 404.9 vs. 2,332 ± 72.96, P < 0.01; cervical/thoracic: 3,160 ± 323.4 vs. 2,001 ± 178.2, P < 0.01) (Figs. 4B and 4C).
DISCUSSION
B cells play a critical role in MS, both in humans and in mouse models. Meningeal inflammation, including the presence of B cell follicle-like structures, has been observed in early and relapsing MS patients, whereas B cell–rich aggregates are associated with lesions reported in progressive disease (3). Unfortunately, these pathology studies are complicated by both the need for invasive biopsy (or can be completed only postmortem) and the technical difficulty of maintaining the integrity of the meningeal compartment during tissue processing (2). In contrast, PET imaging offers the opportunity to noninvasively and longitudinally image molecular markers of disease. This current study demonstrates the promise of using 64Cu-rituximab to noninvasively visualize B cells in huCD20tg EAE mice.
The huCD20tg mouse model was uniquely suited for this work, as B cells in these mice have been engineered to express the human CD20 cell surface protein. Although previous work has shown that human CD20 expression by B cells does not affect the onset or severity of autoimmune encephalitis in EAE mice, B220 immunostaining performed as part of the current work confirmed the formation of B cell follicle-like structures in the meninges and the presence of B cells in the brain and spinal cord. huCD20tg EAE mice thus recapitulated the gross pathology seen in traditional C57BL/6 models and provided a clinically relevant platform to assess the ability of 64Cu-rituximab to detect B cells in MS. Since the number of B cells in huCD20tg EAE mice and MS patients does not necessarily correlate with disease severity (but can instead be used as an indicator of who will likely respond to anti–B cell therapies), we did not assess 64Cu-rituximab uptake in huCD20tg EAE mice of different disease scores.
Rituximab is an antihuman-CD20 monoclonal antibody that has shown promising therapeutic results in patients with arthritis and non-Hodgkin lymphoma and has also been investigated for use in MS (3). Its high specificity and affinity for the B cell–selective marker CD20, coupled with its preliminary success as a therapeutic in MS clinical trials, make rituximab an ideal choice for a readily translatable PET tracer for imaging B cells in MS. Data from our in vivo PET imaging, ex vivo biodistribution, and autoradiography studies suggest 64Cu-rituximab is capable of imaging B cells in the spinal cord and brain of EAE mice. Histologic analysis of CNS tissues from the same mice corroborated that the signal from 64Cu-rituximab corresponded well with regions of B cell infiltration. The specificity of 64Cu-rituximab for detecting human CD20-expressing B cells in huCD20tg EAE mice was confirmed by imaging C57BL/6 EAE mice (devoid of human CD20 target), revealing a significantly diminished PET signal in spinal cord, cortex, hypothalamus, medulla, and pons.
Despite the promise of 64Cu-rituximab as an imaging agent, it has some disadvantages, including brain availability and B cell depletion. Antibodies generally have low brain uptake when the blood–brain barrier is intact. In the current work, this was a moot point because of the well-known blood–brain barrier impairment in EAE mice (15). Since there is also blood–brain barrier disruption in MS (16), it may be feasible to image B cells with 64Cu-rituximab in MS patients; however, this will need to be confirmed in future studies. Second, the high therapeutic potency of rituximab, even at trace amounts of mass, is dose-limiting. The finding via FACS that rituximab can induce significant B cell depletion in the spleen even at a low-dose administration of 3 μg is important, as an ideal imaging agent should not perturb the underlying biology one wishes to study. For this reason, we chose to use a dose of less than 1 μg for imaging. Although a mass smaller than 1 μg did not demonstrate significant B cell depletion in our studies, we cannot rule out minor effects on B cells. For example, we observed a trend toward intravascular depletion and some abnormalities in B cell appearance in tissue sections that may reflect a slight “therapeutic” injury to B cells in the mice imaged with 64Cu-rituximab. One consequence of these findings likely includes not being able to perform multiple imaging studies on the same mice without affecting the underlying B cell biology, and thus another technique may be needed for therapy monitoring studies. Given these challenges, it is important to consider new protein engineering techniques being used to develop binders with altered pharmacologic properties. In the case of 64Cu-rituximab, which promotes Fc-mediated depletion by monocytes and macrophages, engineered variants could be designed to have an inert or absent Fc domain.
Further work should focus on investigating engineered protein variants and seeking to identify additional biomarkers that have potential to elucidate pathologically relevant from normal B cells in detrimental autoimmune diseases. For clinical studies, further optimization of specific activity and tracer dose may be required to ensure no impact on B cells. It is possible, however, that mice with human CD20-expressing B cells could be more sensitive to low doses of rituximab than what might occur in the clinical setting. As we move toward evaluating this tracer for clinical imaging of MS patients, we will assess the effect of varying the tracer mass amounts of rituximab on B cells in the blood and we will adjust the dose if necessary.
CONCLUSION
Overall, the current work contains strong proof-of-concept data that 64Cu-rituximab is capable of imaging B cells in a murine model of MS. These data support further investigation of 64Cu-rituximab in preclinical models and translation as a possible clinical tool, for helping identify which MS patients are most likely to respond to anti–B cell therapies and for monitoring real-time response.
DISCLOSURE
This project was funded partly by Novartis. The SCi3 Small Animal Imaging Service Center is supported by NCI grant CA124435-04 (Cancer Center P30). Sudeep Chandra is an employee of Novartis Institute of Biomedical Research (Department of Translational Medicine). No other potential conflict of interest relevant to this article was reported.
Acknowledgments
We thank the SCi3 Small Animal Imaging Facility (SAIF)—including Dr. Tim Doyle for assistance with PET/CT—and inviCRO for guidance concerning analysis of spinal cord PET images using VivoQuant.
Footnotes
Published online Jul. 7, 2017.
- © 2017 by the Society of Nuclear Medicine and Molecular Imaging.
REFERENCES
- Received for publication January 15, 2017.
- Accepted for publication May 30, 2017.


Jump to section
Related Articles
Cited By...
- Longitudinal Imaging of T Cells and Inflammatory Demyelination in a Preclinical Model of Multiple Sclerosis Using 18F-FAraG PET and MRI
- Off-tumor IDO1 target engagements determine the cancer-immune set point and predict the immunotherapeutic efficacy
- Visualization of Activated T Cells by OX40-ImmunoPET as a Strategy for Diagnosis of Acute Graft-versus-Host Disease
- Neuroinflammation PET Imaging: Current Opinion and Future Directions
- ICOS Is an Indicator of T-cell-Mediated Response to Cancer Immunotherapy
- 18F-FAC PET Visualizes Brain-Infiltrating Leukocytes in a Mouse Model of Multiple Sclerosis
- The Immunoimaging Toolbox
- Reply: Optimizing Strategies for Immune Checkpoint Imaging with Immuno-PET in Preclinical Study