


Abstract
The metabotropic glutamate receptor 5 (mGluR5) is a high-interest target for PET imaging because it plays a role in several pathologies, including addiction, schizophrenia, and fragile X syndrome. Methods: We studied the pharmacokinetics of 18F-FPEB (3-18F-fluoro-5-(2-pyridinylethynyl)benzonitrile), a selective PET radioligand for mGluR5, and used it to quantify mGluR5 in rat brain. Quantification was performed using both arterial sampling in combination with compartment models and simplified reference methods. The simplified reference tissue model (SRTM), Ichise's original multi-linear reference tissue model (MRTMO), and Logan noninvasive were tested as reference models with nondisplaceable binding (BPND) as outcome parameter. Additionally, test–retest scans were obtained in 6 animals. Results: 18F-FPEB uptake in rat brain was consistent with its known distribution. No radiometabolites were present in the brain, and binding was specific as shown in blocking experiments, which also confirmed the cerebellum as a viable reference region. A 2-tissue-compartment model was used to determine BPND for the striatum (11.7 ± 1.5), nucleus accumbens (10.6 ± 2.0), hippocampus (9.0 ± 1.2), cortex (7.2 ± 1.0), and thalamus (4.0 ± 0.9). Reference methods were able to estimate these values with small bias (<2%). Test–retest analysis showed high repeatability between scans below 6%, also for shorter scan durations of 30 and 60 min. Conclusion: Because of its favorable reversible kinetics, high specificity, and absence of brain radiometabolites 18F-FPEB proves a highly useful tracer for in vivo visualization of the mGluR5 in rat brain. Moreover, reference tissue models allow noninvasive, rapid scanning with good test–retest.
The metabotropic glutamate receptor type 5 (mGluR5) is a postsynaptic G-protein–coupled glutamate receptor predominantly located extrasynaptically (1). Contrary to the rapid fluctuations of glutamate levels inside the synapse, extrasynaptic levels have slower temporal dynamics allowing for longer-lasting changes in activity states of both glial and neuronal cells (2). The mGluR5 has been implicated in several psychiatric and genetic disorders, such as schizophrenia, fragile X syndrome, and addiction (3).
The first tracer suitable for both preclinical and clinical use, 11C-ABP688, was developed by Ametamey et al. in 2006 (4). Despite its favorable characteristics, the major limitation of 11C-ABP688 remains the short half-life of its radioisotope. Acknowledging this situation, Wong et al. optimized the cumbersome and low productive radiosynthesis of 18F-FPEB (3-18F-fluoro-5-(2-pyridinylethynyl)benzonitrile) by simplifying the process and increasing the radioactive yield. They additionally performed an in vivo distribution study in humans, which confirmed the previously described pharmacokinetics (5). Recent preliminary preclinical evaluation of 18F-FPEB has shown promising results, but a thorough validation for preclinical use has not been reported yet (6).
We report here on the preclinical characterization and quantification of 18F-FPEB in rat brain. As the primary objective, we assessed the pharmacologic specificity of brain uptake and binding characteristics of 18F-FPEB. As a second objective, we quantified the imaging data by compartmental modeling and high-frequency serial arterial measurements of both parent radiotracer and radiometabolites. Finally, simplified modeling method estimates were evaluated to overcome the need for arterial sampling in this species.
MATERIALS AND METHODS
18F-FPEB Characteristics and Preparation
18F-FPEB was synthesized starting from the nitro-precursor using microwave irradiation. A detailed description of the radiosynthesis will be published elsewhere.
Animals
Experiments were conducted in 30 male Wistar rats (Janvier Laboratories) weighing on average 281 ± 18 g at the time of the experiments. All animals were housed 2 or 3 to a cage in an average room temperature of 22°C and a 12-h light–dark cycle with free access to food and water. The research protocol was approved by the local Animal Ethics Committees of the University of Leuven (P156/2013) and was performed in accordance with European Ethics Committee guidelines (decree 86/609/EEC).
Small-Animal PET Imaging
Imaging experiments were performed on a lutetium oxyorthosilicate detector-based small-animal tomograph (FOCUS-220; Siemens Medical Solutions USA), which has a transaxial resolution of 1.35 mm in full width at half maximum. Data were acquired in a 128 × 128 × 95 matrix with a pixel width of 0.475 mm and a slice thickness of 0.796 mm. The coincidence window width was set at 6 ns. During PET imaging, rats were kept under gas anesthesia (2.5% isoflurane in oxygen at a flow rate of 1.5 l/min), and their body temperature was maintained between 36.5°C and 37°C with a heating pad. On average, 37.6 ± 5.6 MBq (specific activity range, 35–150 GBq/μmol; mass dose range, 1.03–5.64 μg) were injected into the tail vein using an infusion needle set. Individual dynamic 180-min scans were started simultaneously with the injection of 18F-FPEB to assess the kinetics of 18F-FPEB using compartmental modeling (n = 10) and for pretreatment evaluation (n = 3).
For the pretreatment experiment, MTEP-hydrochloride (3-[(2-methyl-1,3-thiazol-4-yl)ethynyl]pyridine hydrochloride; Sigma-Aldrich USA), an mGluR5-negative allosteric modulator, was dissolved to a concentration of 20 mg/mL in distilled water. MTEP was administered intraperitoneally 15 min before and 40 and 95 min after 18F-FPEB injection. The dose of 20 mg/mL and the time of treatments were based on previous reports to ensure complete blocking of mGluR5 (7,8).
List-mode acquisition data were Fourier-rebinned in 33 frames (4 × 15, 4 × 60, 5 × 180, 8 × 300, and 12 × 600 s). Sinograms were reconstructed using an iterative maximum a posteriori probability algorithm with ordered subsets (18 iterations, 9 subsets; fixed resolution, 1.5 mm) (9). All scans were corrected by means of a 57Co-attenuation scan.
Measurement of 18F-FPEB in Plasma
To measure the concentration of 18F-FPEB in rat plasma, an arterial cannula was placed in the femoral artery. After slow bolus injection of 18F-FPEB, arterial blood was continuously collected for 1 min (15 samples, ∼1 sample every 4 s), followed by 100-μL samples at 90, 120, and 150 s and 200-μL samples at 3, 5, 10, 25, 40, 60, 120, and 180 min. All blood samples were immediately stored on ice to minimize possible tracer metabolism. The plasma time–activity curves were corrected for the fraction of unchanged radioligand using reversed-phase high-performance liquid chromatography (HPLC) separation (LaChrom Elite HPLC system [Hitachi]; Chromolith C18, 3 × 100 mm [Merck]). Plasma samples were isolated from whole blood by centrifugation at 3,000 rpm for 5 min and spiked with authentic FPEB reference (25 μL) before HPLC analysis. The HPLC separation was achieved with gradient mixtures of 0.05 M sodium acetate (pH 5.5) (A) and CH3CN (B) (1% B, flow rate 0.5 mL/min, from 0 to 4.1 min; 1% B, flow rate 1.0 mL/min, from 4.1 to 9 min; 90% B, flow rate 1.0 mL/min, from 9.0 to 12.0 min; 90% B, flow rate 0.5 mL/min, from 12.0 to 12.1 min; and 1% B, flow rate 0.5 mL/min, from 12.1 to 15.0 min). The HPLC eluate was collected after passing through an inline ultraviolet detector (296 nm). Collection was performed per minute, except for the period between 8 and 12 min at which samples were collected every 15 s. This period of higher temporal resolution allowed better delineation of the parent tracer and 1 of the radiometabolites. Radioactivity in all fractions was measured using an automated γ-counter equipped with a 7.62-cm NaI(TI) well crystal coupled to a multichannel analyzer (2480 Wizard; Wallac). Results were corrected for background radiation, physical decay, and counter dead time.
Measurement of 18F-FPEB Radiometabolites in Brain
For each time point, 2 rats were infused with approximately 37 MBq of 18F-FPEB under isoflurane anesthesia as described above. At 10, 30, 60, 120, and 180 min after injection, rats were euthanized using a 180 mg/kg overdose of sodium pentobarbital (Nembutal; Ceva Sante Animale) and perfused transcardially with saline. The brain was carefully removed from the skull, after which the cerebrum and cerebellum were separated. After homogenization, in 3 and 2 mL of CH3CN, respectively, the supernatant was collected and filtered with a Millex Syringe Filter (Merck Millipore). One mL of this filtrate was diluted with 1 mL water after which 0.5 mL of this solution was spiked with authentic FPEB reference and injected onto the HPLC consisting of an analytic XBridge column (C18, 5 μM, 3 mm×100 mm; Waters) eluted with a mixture of 0.05 M sodium acetate (pH 5.5) and CH3CN (50/50 v/v) at a flow rate of 0.8 mL/min. HPLC eluates were collected every minute after passing through an ultraviolet detector (296 nm). Radioactivity in the fractions was measured using the automated γ-counter.
In Vitro Rat Brain and Blood Stability Studies
Fresh rat blood, plasma, and homogenized perfused brain were incubated with about 18 MBq of tracer at 37°C. After 60 min of incubation, samples were cooled on ice. Blood and brain homogenate samples were processed and analyzed by reversed-phase HPLC as described above.
Small-Animal PET Analysis
PET images were normalized to a custom-made rat brain template in Paxinos stereotactic space, allowing the use of a predefined volume-of-interest map. The procedure for spatial normalization and its validation have been described previously by our group (10). Time–activity curves were generated for the bilateral caudate/putamen, nucleus accumbens, hippocampus, cortex, and cerebellum of each individual scan using PMOD software (version 3.6; PMOD Technologies). The macrostructures that were used were based on the spatial resolution of the FOCUS-220 system (11). The radioactivity concentration in each brain region was normalized to the injected dose and body weight and expressed as standardized uptake value. Receptor occupancy was calculated with the Michaelis–Menten equation (12), using the free fraction of 18F-FPEB determined in humans (13).
Compartmental Modeling of 18F-FPEB in Rat Brain
All 18F-FPEB input curves were obtained after correction for 18F decay and radiometabolite correction, which was based on a hill-function fitting of the radiometabolites. One-tissue-compartment and 2-tissue-compartment models (2TCM) were considered to describe 18F-FPEB kinetics in the rat brain using the metabolite-corrected plasma input function. Fittings were obtained for different scan durations and evaluated both by visual assessment and by model selection criterion values. Distribution volume (VT) and nondisplaceable binding (BPND) were used as outcome parameters. BPND was calculated as VT/VRef – 1, where VRef is the distribution volume of the reference region.
To determine the time-stability of the tracer and the minimum scanning time necessary to obtain reliable estimates for BPND, we analyzed PET data from each rat after removing variable durations of the terminal portion of the scans. We analyzed data of all animals for the periods between 0–30, 60, 90, 120, and 180 min. Estimates of BPND were compared with the reference value obtained with the best-fitting dataset. The solution was considered acceptable if the result was within 10% of that from the analysis of the reference value.
Simplification of 18F-FPEB Quantification
Because arterial blood sampling in rats is technically demanding and a terminal procedure, it hampers serial small-animal PET studies in this species. Therefore, we also explored the possibility of simplifying 18F-FPEB quantification in rat studies. For this purpose, the simplified reference tissue model (SRTM), Logan noninvasive (NI), and Ichise's original multi-linear reference tissue model (MRTMO) were tested as reference models with BPND as the outcome parameter. Reference models were compared with the best-fitting compartmental model.
Test–Retest Variability
Six animals were scanned twice for 120 min with a 1-wk interval to evaluate the (short-term) interscan variation between different scans of the same animal. The intraclass correlation coefficient (ICC) was used to assess within-subject variability relative to the between-subject variability. Additionally, percentage difference was also calculated as the difference between test and retest values on the same subject divided by their average, that is, (Y1 – Y2)/((Y1 + Y2)/2).
Statistical Analysis
The reported values are mean ± SD. Conventional statistics were performed using GraphPad Prism (version 5.0; GraphPad Software). This includes reported biases, which are obtained with the Bland–Altman method. ICCs were calculated with SPSS 22 (IBM Corp.) for absolute agreement in a 2-way mixed model on individual measurements. Significance was defined at the 95% probability level.
RESULTS
Plasma Kinetics
The percentage of intact 18F-FPEB in arterial plasma over time is shown in Figure 1A. At 3 min after injection, 68% ± 7% of the total radioactivity in arterial plasma corresponded to intact 18F-FPEB. This fraction declined to 44% ± 9% at 10 min, 26% ± 6% at 40 min, 19% ± 5% at 60 min, 16% ± 5% at 120 min, and 11% ± 3% at 180 min after tracer injection. In rat plasma, 2 radiometabolites were observed, which eluted earlier (at 3 and 9 min) than 18F-FPEB (Rt = 10 min) on the HPLC and are therefore more hydrophilic (polar) than the parent radioligand (Fig. 1B). No radiometabolites with higher lipophilicity than 18F-FPEB were detected.
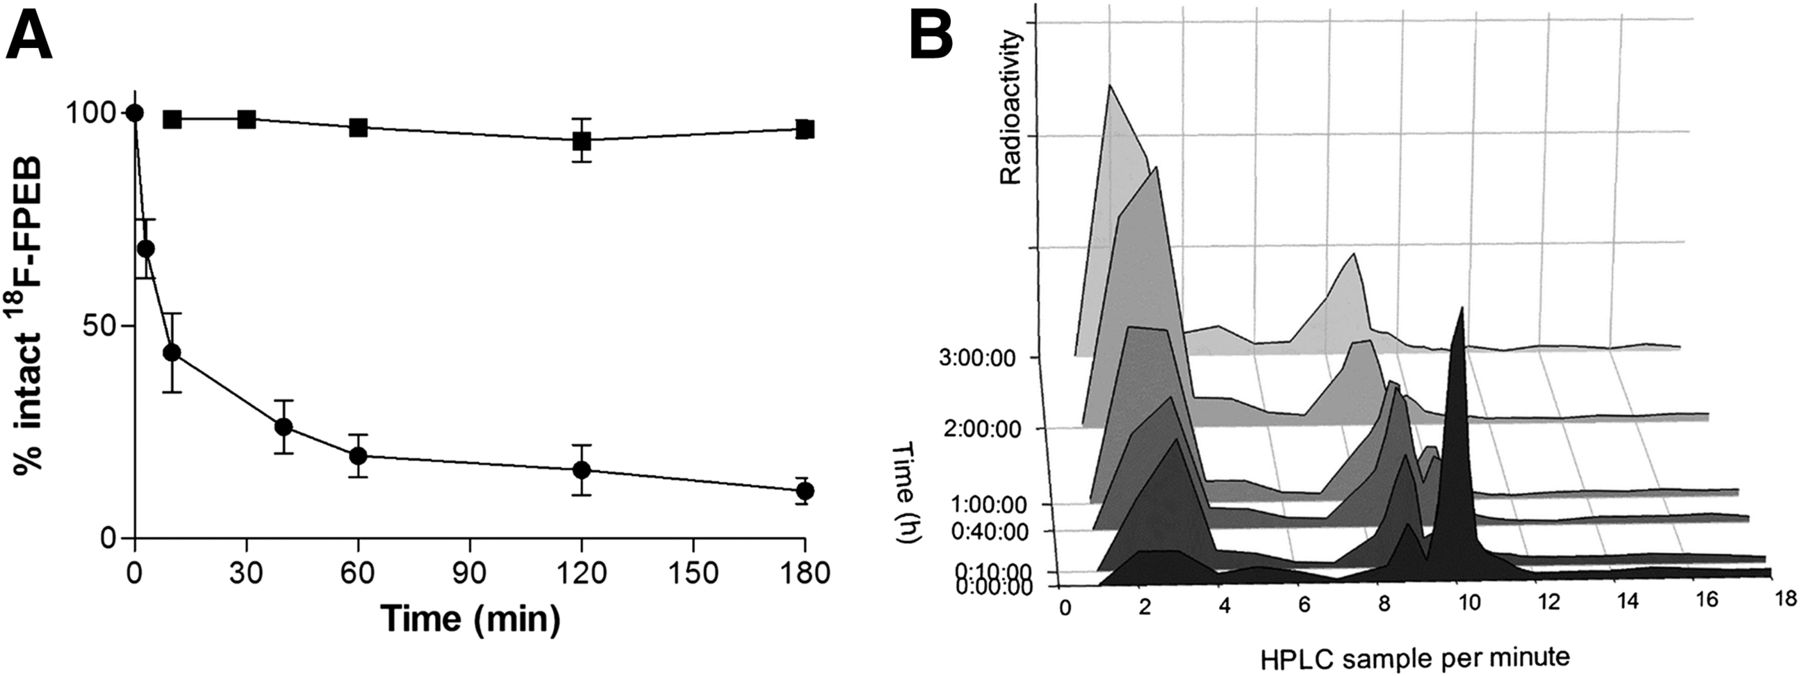
(A) Intact percentage of 18F-FPEB over time in cerebrum homogenate (▪) and plasma (●). B) Reconstructed chromatograms showing intact tracer in plasma eluting at 10 min. Two polar radiometabolites eluting at 3 and 9 min were observed.
In Vitro and Ex Vivo Radiometabolite Analysis in Rats
18F-FPEB was shown to be metabolically stable in rat whole blood, rat plasma, and rat brain homogenates in vitro as the fraction of radiometabolites observed after 60 min incubation at 37°C was less than 2%. To assess whether 18F-FPEB radiometabolites are also present in the in vivo brain, 2 rats were sacrificed at 10, 30, 60, 120, and 180 min after 18F-FPEB injection. Polar radiometabolites were present in the cerebrum after 60 min but never accounted for more than 5% of the total radioactivity in the samples (Fig. 1A). Low amounts of radiometabolites (<6.5%) were present in the cerebellum. However, the total radioactivity in the cerebellum never exceeded 1.5% of the cerebrum.
Brain Kinetics
After injection of 18F-FPEB, all rats showed radioactivity in the brain in a pattern consistent with the distribution of mGluR5, that is, highest concentrations in the caudate/putamen, nucleus accumbens, and hippocampus and low concentrations in both cerebellum and brain stem (Fig. 2A) (14). 18F-FPEB uptake in receptor-rich regions increased to a peak around 25 min, after which a slow and approximately linear decline was observed toward 25% of the maximal amplitude at 3 h (Fig. 2B). Receptor occupancy calculation confirmed that occupancies in all studies remained below 1.3% and thus well below the pharmacologic threshold and in the range of microdosing.
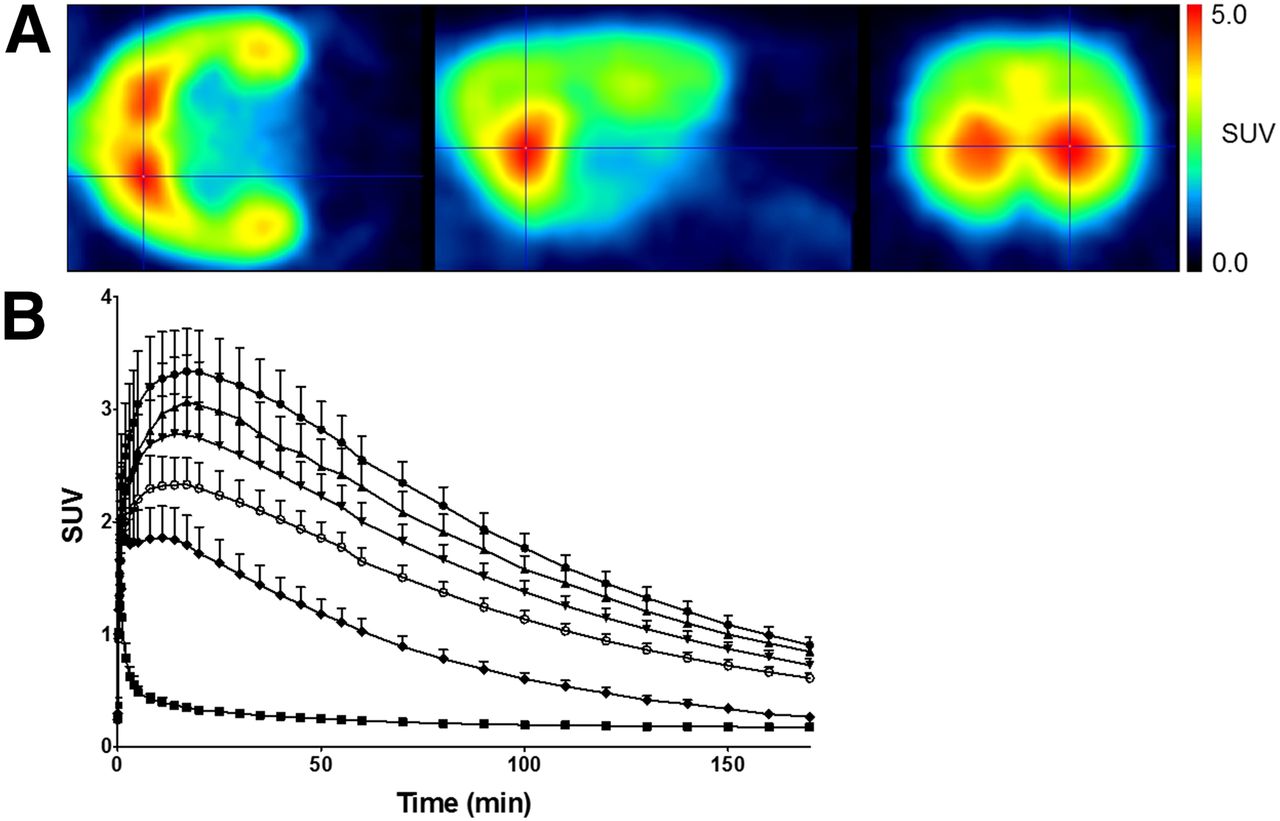
(A) Representative small-animal PET image of rat brain after 18F-FPEB injection averaged from 10 to 60 min. (B) Averaged time–activity curves after venous injection of 18F-FPEB for (from high to low) striatum (●), nucleus accumbens (▲), hippocampus (▼), cortex (○), thalamus (♦), and cerebellum (▪). Error bars represent 1 SD. SUV = standardized uptake value.
Specificity and Binding Characteristics of 18F-FPEB in Rats
18F-FPEB was selective for the mGluR5 in rats as assessed by pharmacologic pretreatment with the highly selective mGluR5-negative allosteric modulator MTEP (15). Full blockage was obtained by injecting MTEP (20 mg/kg) every 55 min, starting 15 min before the injection of 18F-FPEB. The ratio of the area under the curve between receptor-rich and reference region time–activity curves (e.g., striatum/cerebellum) decreased from 110 to 1.10 (Fig. 3). On the basis of these results, the cerebellum is used as the reference region for the following kinetic modeling analyses.
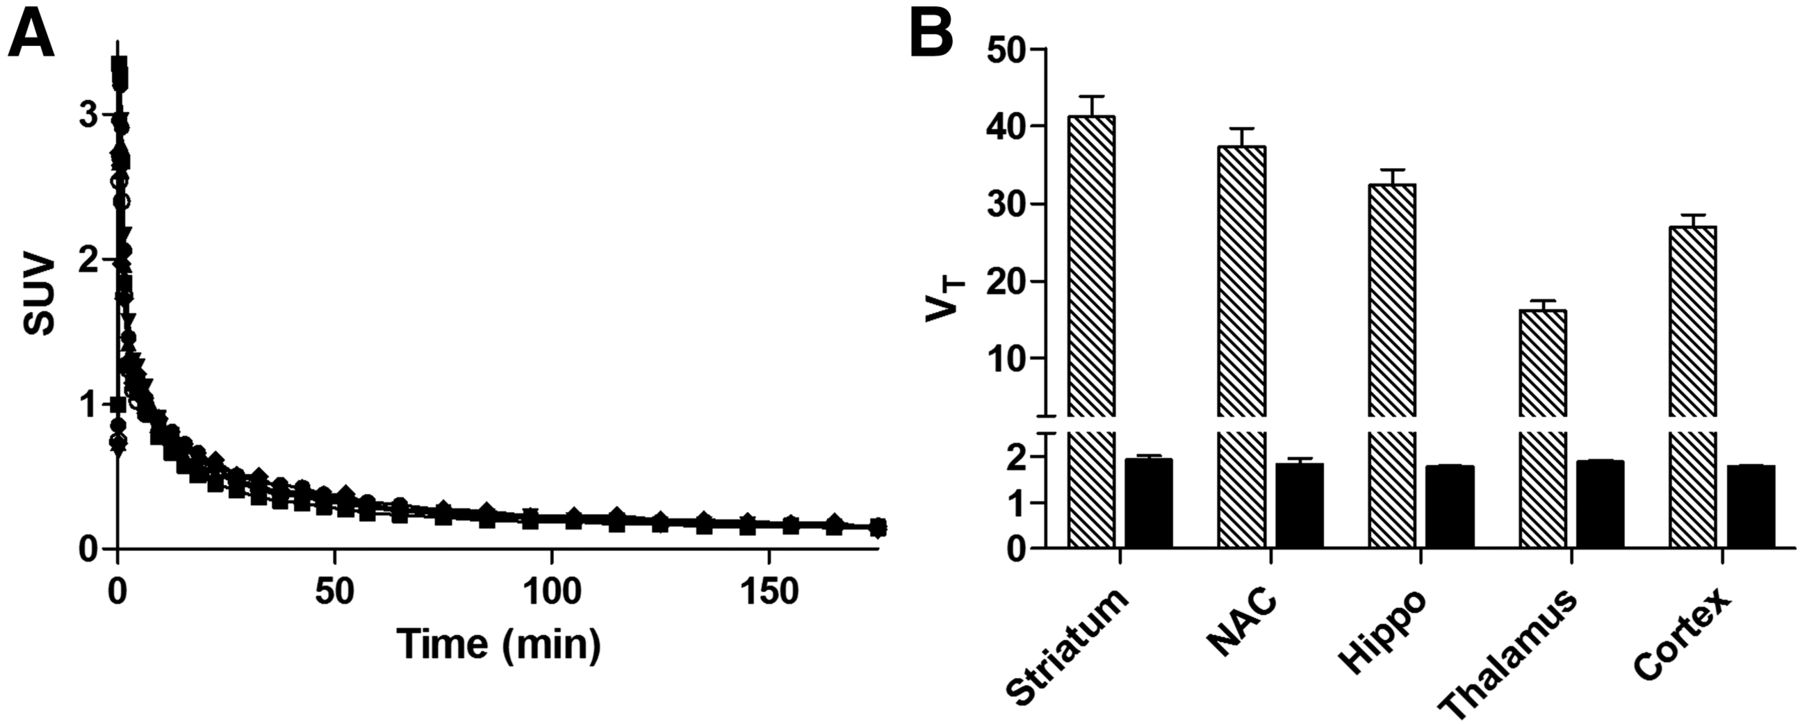
(A) Time–activity curves expressed in standardized uptake value (SUV) after pretreatment with MTEP for same regions as shown in Figure 2. (B) Results of blocking with MTEP (20 mg/kg) in comparison with baseline VT as obtained with 2TCM. Hippo = hippocampus; NAC = nucleus accumbens.
Compartmental Modeling of 18F-FPEB in Rat Brain
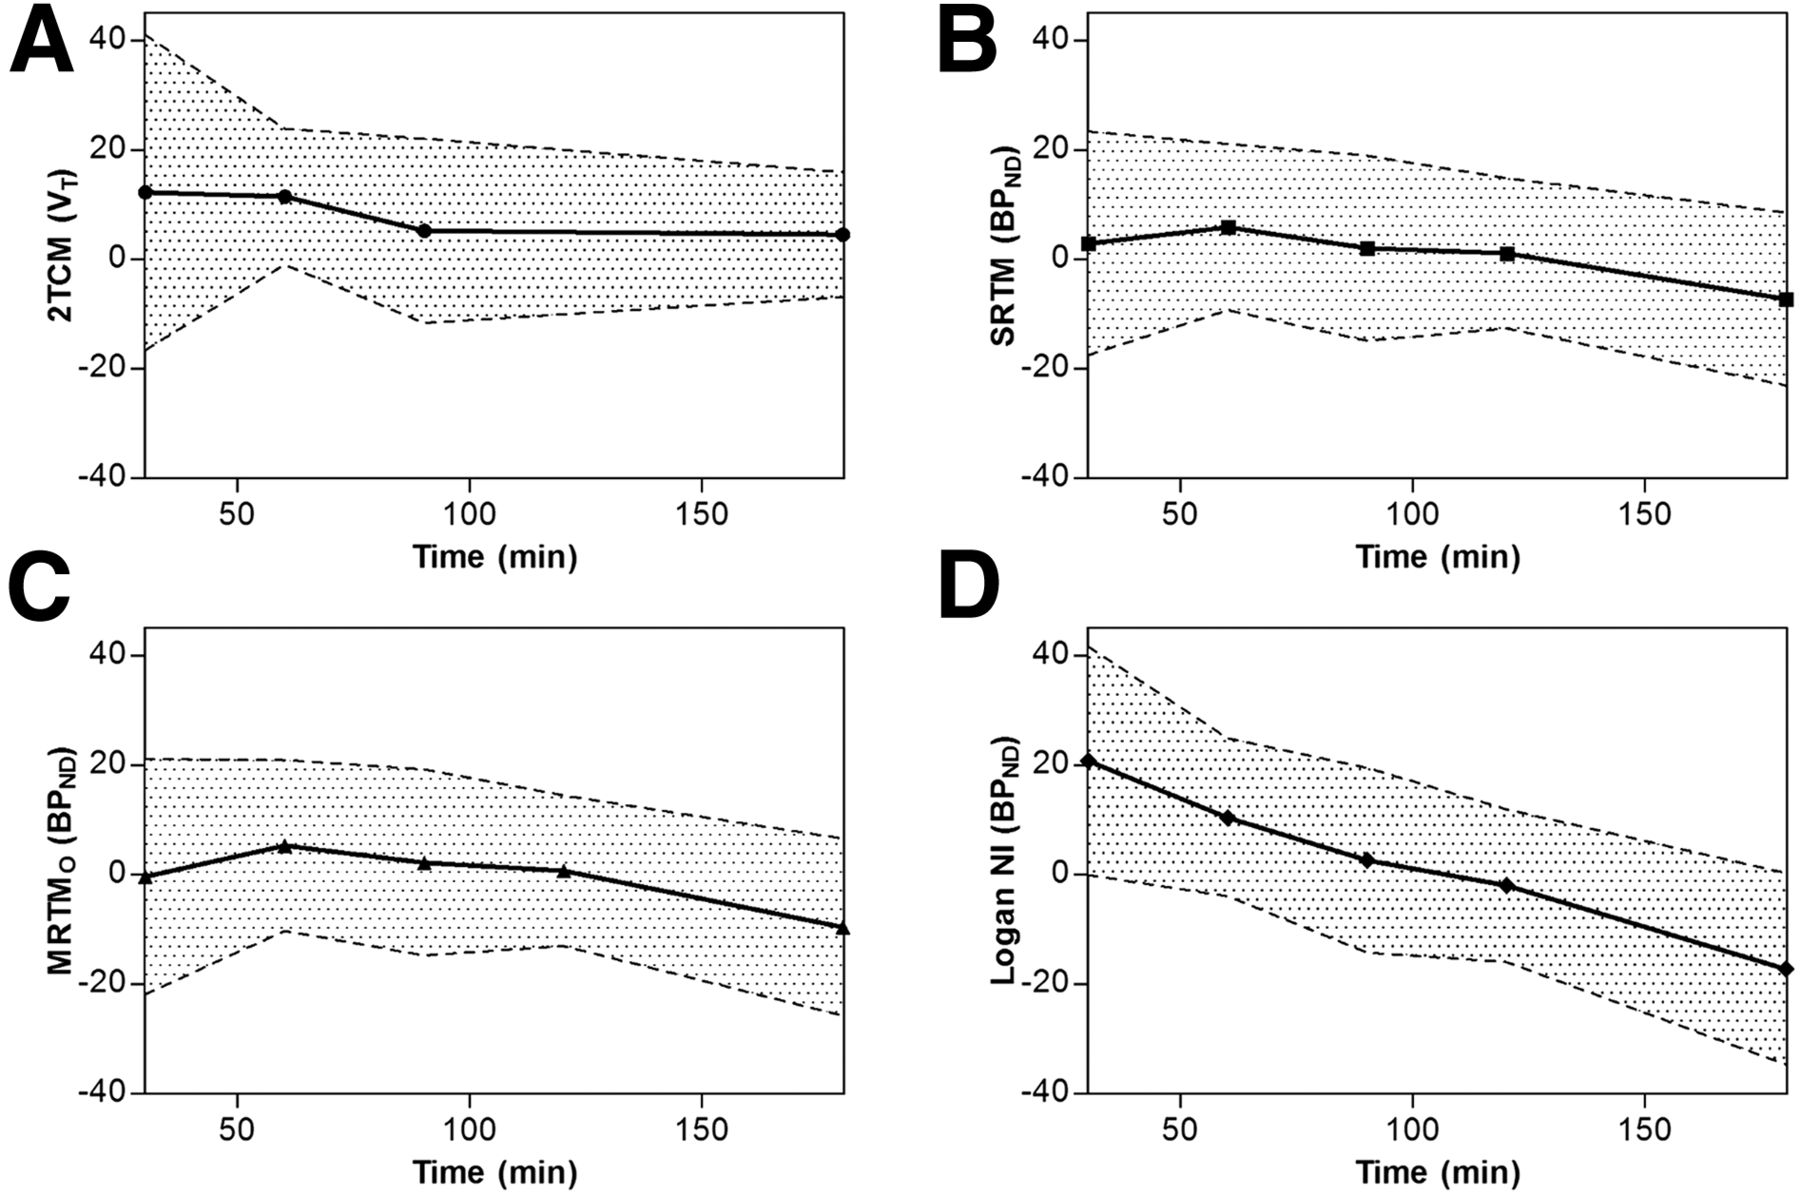
2TC modeling showed to be superior to the 1-tissue-compartmental model, with both better visual fit and higher model selection criterion values. Both criteria were optimal for the scan duration of 120 min. The VT values obtained with the 2TCM were high for both striatum (41.2 ± 7.7) and the nucleus accumbens (37.3 ± 6.9), intermediate for both hippocampus (32.4 ± 5.6) and cortex (26.9 ± 4.6), with lower values for the thalamus (16.2 ± 3.5). Time-stability analysis of 2TCM VT in cerebral regions, for example, the thalamus, showed positive bias compared with the 120-min reference for 30 min (10% ± 25%), 60 min (9% ± 14%), 90 min (4% ± 19%), and 180 min (5% ± 14%) (Fig. 4A).

Bias, as compared with 120-min 2TCM, with confidence band (±SD) for VT obtained with 2TCM (A) and for BPND obtained with MRTMO (B), SRTM (C), and Logan NI (D) for scan durations of 30, 60, 90, 120, and 180 min. For 2TCM, 120-min time point is omitted as this is used as reference and therefore by definition zero.
Simplification of 18F-FPEB Quantification
Binding potentials obtained with the 2TCM are closely approximated by the evaluated reference models (Table 1). Of the latter, a clear reduction in variance can be observed for values obtained with SRTM and MRTMO. SRTM and MRTMO underestimated the 2TCM BPND (−1.1% ± 13.7% and −0.7% ± 13.7%, respectively), whereas Logan NI had a 2.0% ± 13.9% overestimation as compared with the 2TCM BPND values.
Binding Potentials Obtained with Both Plasma-Corrected 2TCM and 3 Simplified Reference Models for 120-Minute Data
For SRTM and MRTMO this bias remained stable for the shorter time frames of 90- (2.0 and 2.2%, respectively), 60- (5.85 and 5.3%), and 30-min (2.9 and −0.3%) scan durations. Logan NI however, showed an increasing overestimation ranging from 2.6% at 90 min to 20.8% at 30 min. All 3 methods showed a relatively large underestimation for 180-min scan duration as compared with 120 min (SRTM, −7.2%; MRTMO, −9.6%; and Logan NI, −17.2%) (Fig. 4).
Test–Retest Variability
High repeatability was found for every reference method in all time frames (Table 2). However, the highest repeatability was found for a scan duration of 30 min for SRTM (ICC = 0.92) and MRTMO (ICC = 0.93), whereas the highest values for Logan NI were found for 60-min scan durations (ICC = 0.88). This high repeatability was also reflected in the average test–retest values of all regions studied with minimal differences at 60 min for MRTMO (−2.3% ± 14.9%) and Logan NI (−1.0% ± 15.3%) and at 30 min for SRTM (−2.7% ± 12.6%).
ICC and Percentage Difference Values for All Regions of Test–Retest Scans Using SRTM, MRTMO, and Logan NI for Different Scan Durations
DISCUSSION
The evaluation of 18F-FPEB in rats demonstrated uptake in the brain consistent with the known distribution of mGluR5 (16,17). Binding was almost 100% specific. Two polar radiometabolites were present in plasma, but these did not enter the brain. BPND values obtained with 2TC modeling in combination with arterial sampling corresponded excellently with values obtained with simplified reference methods, that is, SRTM, MRTMO, and Logan NI. Test–retest scan analysis showed high consistency and low interscan variation with 18F-FPEB.
Plasma radiometabolite analysis showed a rapid conversion of parent to polar radiometabolites contributing to 46% and 89% of the radioactivity at 10 and 180 min, respectively. This pattern is similar to the one reported in humans by Wong et al. but slower than in monkeys (5,18). The detection of only 1 polar radiometabolite by Hamill et al., however, could suggest that the radiometabolite eluting directly before the parent fraction (Fig. 1B) might have been missed.
The in vitro evaluation of 18F-FPEB in rats showed no radiometabolite formation in plasma, blood, or brain homogenates. These findings are also in agreement with data from Hamill et al. showing metabolism of 18F-FPEB in vitro only after addition of liver microsomes (19). Our study is the first to show that there is no significant ex vivo radiometabolite presence in the cerebrum up to 180 min after injection for the 18F-FPEB radiotracer. Although the cerebellum showed minor radiometabolite presence (<6.5%), the total absolute activity in the cerebellum was low (only 1.5% when compared with the cerebrum). This observation could be explained by incomplete washout of radioactivity in the circulatory system, which can be seen with saline perfusion (20). Quantification of the mGluR5 using 18F-FPEB is thus feasible when relying on the radiometabolite-corrected ligand input function only.
The in vivo evaluation of 18F-FPEB in rats demonstrated uptake in the brain in a pattern consistent with the known mGluR5 distribution pattern of both ex vivo (14) and in vivo (21) data. Tracer binding was shown to be reversible with favorable kinetics allowing accurate quantification with scan durations of minimally 60 min. Moreover, low intersubject variability (Table 2) allows sensitive comparison between individuals and groups.
Scans obtained after the administration of MTEP showed a decrease in signal from receptor-rich regions to the same level of the reference region, that is, the cerebellum, thus confirming the high specificity of 18F-FPEB (Fig. 3) (17,22). A similar trend was reported for another mGluR5 tracer, 11C-ABP688, in rats. However, for this tracer no full blockage was achieved (22). This can either be explained by the use of MPEP, which has a lower affinity and specificity than MTEP, or by a lower specificity of this tracer compared with 18F-FPEB (7).
Modeling showed that a 1-tissue-compartment model was unable to fit the data, but a 2TCM provided good fits in all regions. When different scan durations were considered, best results were obtained with scan data of 120 min according to both visual assessment and model selection criterion values. The 2TCM has also been reported appropriate for 11C-ABP688 in rats by Elmenhorst et al. who also showed that the cerebellum can be used as a reference region for mGluR5 PET imaging (22). However, their approximation with reference tissue models of the values obtained with the 2TCM is evaluated only by correlation analysis and is therefore hard to interpret (23). Although the ordering of regions according to BPND values (e.g., striatum highest, cerebellum lowest) is the same as for 11C-ABP688, absolute BPND values are not. Indeed, BPND values found, both with 2TCM and with reference tissue models, for 18F-FPEB are on average 4–5 times higher. This could theoretically be explained by a difference in receptor density between the 2 scanned populations but is more likely a result of the higher affinity of 18F-FPEB for mGluR5 (dissociation constant, 0.05 nmol/L vs. 1.7 nmol/L) (4,24). Indeed, the binding potentials reported in this article are in concordance with previously reported values for 18F-FPEB in rats (6).
To avoid cumbersome arterial sampling in future animal model scans, the results of the 2TCM for 120 min were compared with SRTM, MRTMO, and Logan NI. Minimal bias was obtained with SRTM and MRTMO for 120-min data frames (−1.1 ± 13.7% and −0.7 ± 13.7, respectively). Furthermore, this bias remained stable and below 6% for 30, 60, and 90 min with both methods (Fig. 4). High ICCs were obtained for these time frames with test–retest scans using SRTM and MRTMO (Table 2). This consistency between scans was also confirmed by the small bias on both all regions combined (<3.0%) and individual regions (<5%). These results are similar to the ones obtained for 11C-ABP688 in rats (25).
Mild defluorination is observed in the later time frames by the appearance of bone structures on the PET images. The influence of bone uptake was negligible in receptor-positive regions but was noticeable in the reference region directly adjacent to bone. Therefore, the reference region used in this study was delineated within the cerebellum thus evading spill-in from bone structures. Additionally, this influence might be more pronounced in late time frames, when radioactivity concentrations in the brain have decreased. Indeed, Kang et al. reported the absence of bone uptake in their 90-min scans (6), which could explain the less optimal fit of the 2TCM for the 180-min data as compared with the 120-min scans. Interestingly, after MTEP administration no bone uptake of radioactivity was present on PET images. HPLC analysis of plasma after MTEP administration also showed absence of the most polar radiometabolite. This probably means that this metabolite, likely formed by defluorination at the fluorophenyl ring of 18F-FPEB, is a product of an enzymatic pathway, which is at least partly shared with MTEP.
CONCLUSION
We have shown that 18F-FPEB is a suitable radioligand for the in vivo visualization and quantification of mGluR5 in rats. Because of the highly specific signal and low intersubject variability, it provides a sensitive tool for preclinical research on mGluR5-related topics. The presence of a valid reference region allows reliable and accurate simplified quantification using SRTM and MRTMO. Moreover, test–retest ICC scores of greater than 0.88% for 30- and 60-min scans allow for high-throughput and longitudinal experimental designs. Our data suggest that optimal results with 18F-FPEB can be obtained with SRTM and MRTMO for scans of 60 min.
DISCLOSURE
The costs of publication of this article were defrayed in part by the payment of page charges. Therefore, and solely to indicate this fact, this article is hereby marked “advertisement” in accordance with 18 USC section 1734. Financial support was received from the Fund for Scientific Research, Flanders, Belgium (FWO/G.0548.06), the KU Leuven In Vivo Molecular Imaging (IMIR) Consortium (KUL PF/10/017). Bart de Laat, is the recipient of a research grant from the IWT (Instituut Wetenschap en Technologie)-Vlaanderen. Cindy Casteels is a postdoctoral researcher and Koen Van Laere senior clinical investigator for the Flemish Fund for Scientific Research (FWO, Flanders). No other potential conflict of interest relevant to this article was reported.
Acknowledgments
We thank Julie Cornelis, Ann Van Santvoort, and Ivan Sannen for their assistance in the data acquisition, as well as the PET radiopharmacy team for tracer preparation.
Footnotes
Published online Sep. 24, 2015.
- © 2015 by the Society of Nuclear Medicine and Molecular Imaging, Inc.
REFERENCES
- Received for publication June 24, 2015.
- Accepted for publication September 10, 2015.


