


Abstract
We evaluated the ability of metabolic and volumetric parameters measured by pretreatment 18F-FDG PET/CT to predict the survival of patients with osteosarcoma of the extremities. Methods: The records of 83 patients with American Joint Committee on Cancer stage II extremity osteosarcoma treated with surgery and chemotherapy were retrospectively reviewed. Imaging parameters (maximum standardized uptake value, metabolic tumor volume [MTV], total lesion glycolysis, and tumor volume based on MR images) were measured before treatment, and histologic responses to neoadjuvant chemotherapy were assessed by examination of postsurgical specimens. Receiver-operating-characteristic curve analyses and the Cox proportional hazards model were used to analyze whether imaging and clinicopathologic parameters could predict metastasis-free survival. Results: Of the imaging parameters, MTV at the fixed standardized uptake value threshold of 2.0 (MTV(2.0)) most accurately predicted metastasis by receiver-operating-characteristic curve analysis (area under the curve = 0.679, P = 0.011). By multivariate analysis, MTV(2.0) > 105 mL (relative risk, 3.93; 95% confidence interval, 1.55–9.92) and poor response to neoadjuvant chemotherapy (relative risk, 4.83; 95% confidence interval, 1.64–14.21) independently shortened metastasis-free survival (P = 0.004 for both parameters). The stratification of patients by the combined criteria of MTV(2.0) and histologic response predicted outcome in more detail. Conclusion: MTV is an independent predictor of metastasis in patients with osteosarcoma of the extremities. The combination of MTV and histologic response predicts survival more accurately than the chemotherapeutic response alone.
Although its absolute incidence (a few cases per year per million persons) is lower than that of other malignant tumors, osteosarcoma is the most common primary bone malignancy (1). The long-term survival of patients with osteosarcoma has improved significantly since the introduction of neoadjuvant and adjuvant chemotherapy (2). However, the clinical behavior of osteosarcoma is highly heterogeneous: although up to 15% of patients with osteosarcoma have been cured by surgery alone (3), a substantial number eventually experience failure of all available treatment modalities, including surgery and chemotherapy. A clinical staging system based on the tumor grade, size, and presence of skip lesions or distant metastases (4,5) and the histologic response to neoadjuvant chemotherapy (6,7) have been reported to be the most important predictors of survival. However, these prognostic factors do not always provide a satisfactory result due to the heterogeneity of the tumor population, because the risk for relapse can differ among patients with the same stage of disease or chemotherapeutic response. Moreover, the histologic response can be assessed only by examination of resected specimens after the completion of neoadjuvant chemotherapy.
18F-FDG PET/CT has been widely used for the staging (8) and therapeutic monitoring (9,10) of osteosarcoma based on the elevated glucose utilization of malignant cells. The degree of 18F-FDG uptake, as expressed by the standardized uptake value (SUV), can be readily measured and quantified by 18F-FDG PET/CT. However, the prognostic value of the SUV for patients with osteosarcoma is not proven (11,12). Metabolic tumor volume (MTV) is defined as the volume of tumor tissue with an SUV above a minimum threshold as measured by 18F-FDG PET/CT. Although MTV has been suggested to be an independent predictor of the clinical outcome of certain cancers (13–16), the prognostic value of MTV for osteosarcoma is unknown. Total lesion glycolysis (TLG), another indicator of tumor metabolism, is defined as the product of the mean SUV and the MTV of tumor tissue above a minimum SUV threshold (17). Recent studies have measured TLG values using 18F-FDG PET/CT and demonstrated their prognostic significance for osteosarcoma (11) and other cancers (16,18).
In the current study, we evaluated the abilities of the maximum standardized uptake value (SUVmax) and MTV and TLG values calculated for different SUV thresholds measured by pretreatment 18F-FDG PET/CT to predict the survival of patients with osteosarcoma and investigated whether combining these parameters with the histologic response could improve the prediction of clinical outcome.
MATERIALS AND METHODS
Patients, Treatment, and Clinical Follow-up
One hundred seventy-three consecutive patients with osteosarcoma were registered between June 2006 and August 2010. Eligibility requirements included newly diagnosed, histologically proven high-grade primary intramedullary osteosarcoma; completion of preoperative chemotherapy, surgery, and postoperative chemotherapy; no more than 2 wk elapsed between 18F-FDG PET/CT or MR imaging and the initiation of preoperative chemotherapy; no history of previous treatment except for biopsy; and follow-up for more than 2 y for metastasis-free patients, based on our previous report (19). Patients with histologically low-grade osteosarcoma (American Joint Committee on Cancer [AJCC] stage I), which was associated with a lower likelihood of metastases and treated by surgery only (4,20), were excluded in the current study. Because patients with pelvic and vertebral osteosarcoma (21), age greater than 40 y (22), and skip lesions (AJCC stage III) or distant metastases at initial presentation (AJCC stage IV) have previously been reported to have poor outcomes (4), such patients were excluded from the current study. As a result, patients with nonextremity osteosarcoma (n = 14), treatment by chemotherapy (n = 5) or surgery (n = 15) only, skip lesions or distant metastases at initial presentation (n = 28), age greater than 40 y (n = 13), and lack of available 18F-FDG PET/CT or MR imaging results (n = 15) were excluded, and the remaining 83 patients were retrospectively analyzed in the present study. The institutional review board approved this retrospective study, and the requirement to obtain informed consent was waived.
All patients underwent preoperative chemotherapy, surgery, and postoperative chemotherapy and were followed up as previously described (19). The length of follow-up ranged from 9 to 72 mo, with a median length of follow-up of 43 mo. Two of 83 patients (2.4%) were followed from 6 to 12 mo, 10 patients (12.0%) from 13 to 24 mo, 18 patients (21.7%) from 25 to 36 mo, and 53 patients (63.9%) from 37 mo and over. Metastases were verified by histologic confirmation or follow-up cross-sectional imaging results including 18F-FDG PET/CT, MR imaging, bone scanning, and x-ray for at least 6 mo. The histologic response to neoadjuvant chemotherapy was assessed by examination of postsurgical specimens and was graded on the basis of the percentage of tumor necrosis as grades III and IV (≥90% necrosis), indicating a good response, and grades I and II (<90% necrosis), indicating a poor response (23).
18F-FDG PET/CT Imaging
PET/CT data were acquired using a Biograph6 PET/CT scanner (Siemens Medical Solutions). All patients fasted for at least 6 h before the intravenous administration of 7.4 MBq of 18F-FDG per kg of body weight, and all patients’ blood glucose levels were less than 7.2 mmol/L at this time. PET/CT imaging from the vertex to the upper thigh (5–6 bed positions) was performed beginning 60 min after 18F-FDG injection, and PET/CT images spanning the sites of tumors located in the extremities (6–7 bed positions) were subsequently acquired. During the PET/CT scans, CT images without intravenous iodinated contrast were obtained using a 6-slice helical CT scanner, and the imaging parameters used for CT scanning were as follows: 130 kVp, 30 mA, 0.6-s/CT rotation, and a pitch of 6. Then, PET emission data were acquired over the corresponding area with a 16.2-cm axial field of view at 3.5 min per bed position. The CT data were used for attenuation correction, and the images were reconstructed using a conventional iterative algorithm (ordered-subsets expectation maximization, 2 iterations and 8 subsets).
MR Imaging
MR imaging was performed using a 1.5-T scanner (Signa Horizon; GE Healthcare). The MR imaging sequences used to obtain the images available for review included a spin-echo T1-weighted sequence (repetition time/echo time, 380–650 ms/10–20 ms) without gadolinium enhancement and a fast spin-echo T2-weighted sequence (1,500–2,500 ms/60–80 ms). T1-weighted images were also acquired, with or without fat suppression, after intravenous injection of gadopentate dimeglumine (0.1 mmol/kg, Magnevist; Schering).
Imaging Analysis
All PET/CT images were reviewed on e-soft workstations (Siemens Medical Systems). An ellipsoid volume of interest was drawn to include the entire primary tumor of the extremity and the SUVmax corrected for body weight, and the dose of 18F-FDG injected was measured for each 18F-FDG PET/CT dataset. MTVs were calculated on the basis of the descriptions of Biehl et al. (24) and Costelloe et al. (11). Previous studies of patients with osteosarcoma measured MTVs and TLGs using threshold SUVs of 1.5–3.0 (9) or a relative threshold of 45% of the SUVmax of the tumor areas (11). Im et al. reported that an SUV threshold of 1.5 could not clearly discriminate between tumor and neighboring normal tissue and that an SUV threshold of 3 underestimated the tumor area. Therefore, the MTVs in this study were calculated automatically by summing the volumes of voxels with threshold SUVs of 2.0, 2.5, and 45% of the SUVmax in the volume of interest, and the results were designated MTV(2.0), MTV(2.5), and MTV(45%), respectively. Similarly, total lesion glycolysis (TLG) was calculated as (MTV) × (mean SUV) using threshold SUVs of 2.0, 2.5, and 45% of the SUVmax in the volume of interest and the results designated TLG(2.0), TLG(2.5), and TLG(45%), respectively.
Intramedullary tumor lengths were measured from coronal sections of unenhanced T1-weighted sequences, whereas tumor widths and depths were measured from enhanced axial T1-weighted sequences and T2-weighted sequences without fat suppression (10). MR images were independently reviewed by 2 of the authors. When the sizes determined by these 2 reviewers differed by more than 10%, the images were reviewed simultaneously and a decision was made by consensus (25). Then, the tumor volume based on MR images (MRV) was calculated from the tumor length, width, and depth using the ellipsoid formula (26).
Study Design
To evaluate the prognostic value of pretreatment 18F-FDG PET parameters and to assess its additional value over known prognostic factors, we performed a retrospective analysis of 83 patients with osteosarcoma. Because of the nature of the study, we did not plan a sample size. The primary endpoint was metastasis-free survival, a composite endpoint determined by the time from the date of diagnosis to the date of metastasis.
Statistical Analysis
Descriptive statistics were calculated for the baseline characteristics. We presented statistics as the frequencies and percentages for categoric variables or as the mean ± SD for normally distributed continuous variables or as the median (interquartile range) for nonnormally distributed continuous variables. All continuous variables were tested for normal distribution using the Shapiro–Wilk test. The Pearson correlation coefficient was used for the analyses of the correlations of the MRV with the MTV values for different cutoff values of SUV. The prognostic values of the imaging parameters (SUVmax, volume parameters [MRV and MTV values], and TLG values) for metastasis were determined by analysis of the areas under the receiver-operating-characteristic (ROC) curves. Correlations between the most effective prognostic factor among the imaging parameters and various clinicopathologic parameters were assessed using the χ2 test. The Cox proportional hazards model with a backward conditional stepwise procedure was used to evaluate prognostic variables, including SUVmax, MTV, TLG, age, sex, AJCC stage, tumor location, histologic subtype, and histologic response. We confirmed the proportional hazards assumption using the Schoenfeld test (27) and plotted the Martingale residuals against continuous variables to detect nonlinearity (28). Model calibration was assessed with the Hosmer–Lemeshow statistic (29), and the calibration curve was calculated by bootstrapping 200 samples with replacement from the original patients used to fit the Cox model (30). Model discrimination was assessed with the Harrell concordance index (C-index) (31). The C-index has values from 0 to 1, with 0.5 indicating a random model with no variables and with 1 (or 0) a perfect order concordance. Metastasis-free survival curves were plotted using Kaplan–Meier methods, and differences in survival between groups were assessed by the log-rank test. The statistical tests were performed using SPSS (version 13.0; SPSS, Inc.) and MedCalc (version 12.3; MedCalc Software). All P values were 2-sided, and P values of less than 0.05 were accepted as indicating statistical significance.
RESULTS
Patient Characteristics
Eighty-three eligible patients (62 men and 21 women; mean age, 16 y; age range, 8–37 y; 34 patients [41%] with AJCC stage IIA and 49 patients [59%] with AJCC stage IIB osteosarcoma) were enrolled in this study. The location of the tumor was the femur in 42 patients (51%), tibia in 28 (34%), humerus in 9 (11%), and elsewhere in 4 (5%). The histologic subtype was osteoblastic in 62 patients (75%), chondroblastic in 13 (16%), fibroblastic in 6 (7%), and other in 2 (2%). The largest dimension of the tumors before neoadjuvant chemotherapy ranged from 2.2 to 21.9 cm (mean, 9.4 cm).
The mean SUVmax was 9.5 ± 5.7, and the mean MRV was 138.6 ± 119.1 mL. The mean MTV(2.0), MTV(2.5), and MTV(45%) values were 138.6 ± 111.3, 106.3 ± 93.4, and 51.9 ± 40.8 mL, respectively. The mean TLG(2.0), TLG(2.5), and TLG(45%) values were 596.5 ± 618.2, 524.6 ± 590.4, and 304.0 ± 345.7 g, respectively.
Follow-up data were available through August 2012. The metastasis-free interval ranged from 3 to 72 mo, with a median metastasis-free interval of 38 mo. Up to the time of analysis, 24 patients (29%) had experienced distant metastasis, whereas the remainder had not. The estimated 3- and 5-y metastasis-free survival rates were 71.4% (95% confidence interval [CI], 62.1%–81.3%) and 67.2% (95% CI, 54.5%–79.1%), respectively. Metastases were located in the lung in 18 patients, in the bone in 5, and in the chest wall in 1.
Correlations Between MRV and MTV Values
Of the MTV values calculated for various SUV thresholds, MTV(2.0) correlated best with MRV (r = 0.65, P < 0.001) (Fig. 1). MTV(2.5) (r = 0.61, P < 0.001) and MTV (45%) (r = 0.35, P = 0.001) also correlated significantly with MRV.
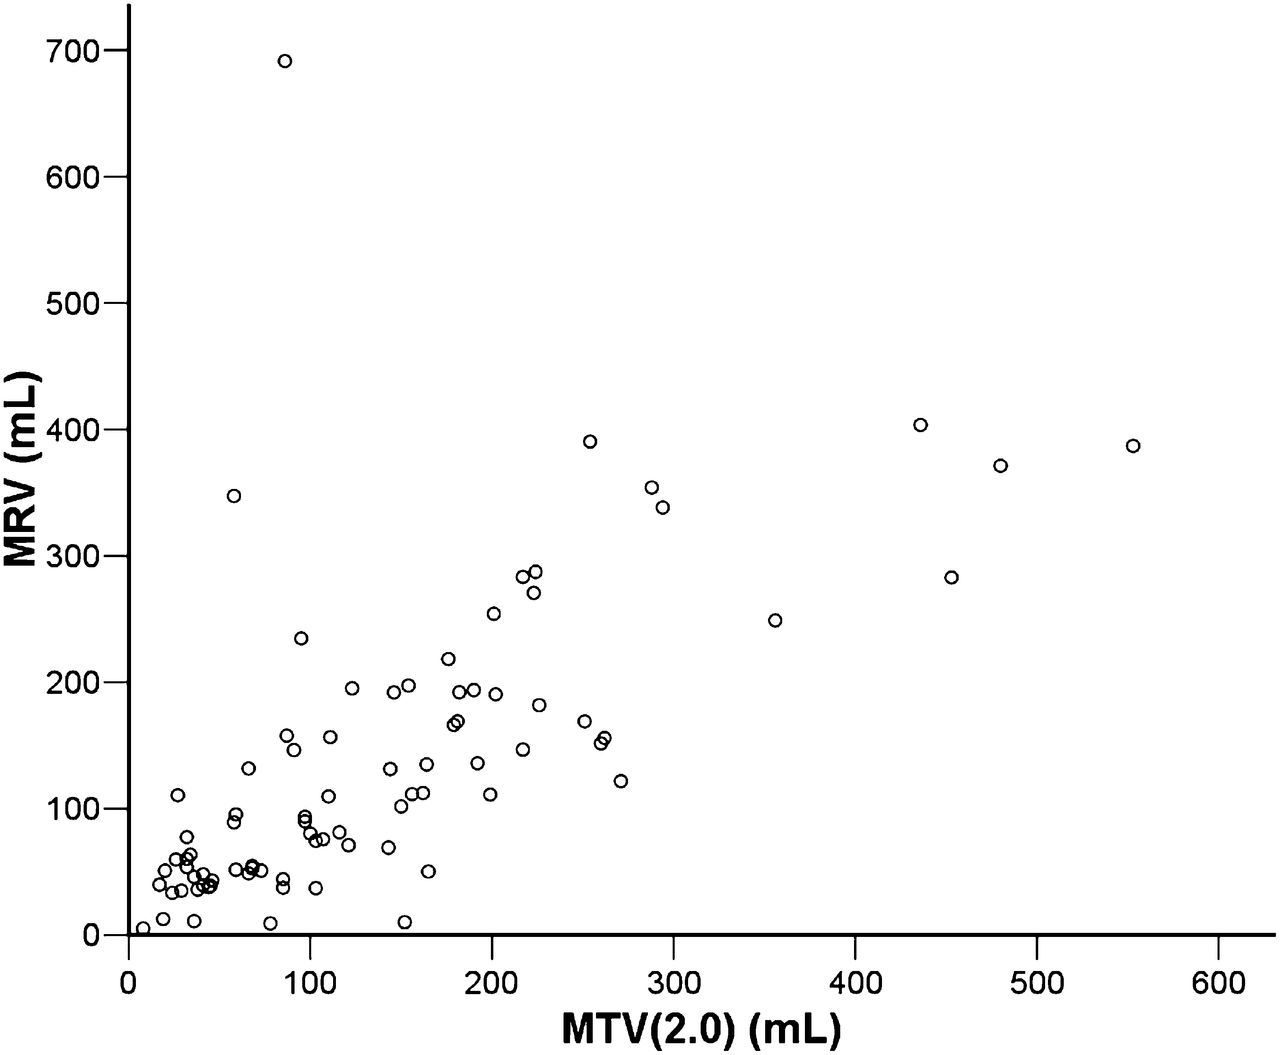
MTV(2.0) and MRV before neoadjuvant chemotherapy are significantly correlated (r = 0.65, P < 0.001).
Comparisons Among Imaging Parameters for Predicting Prognosis
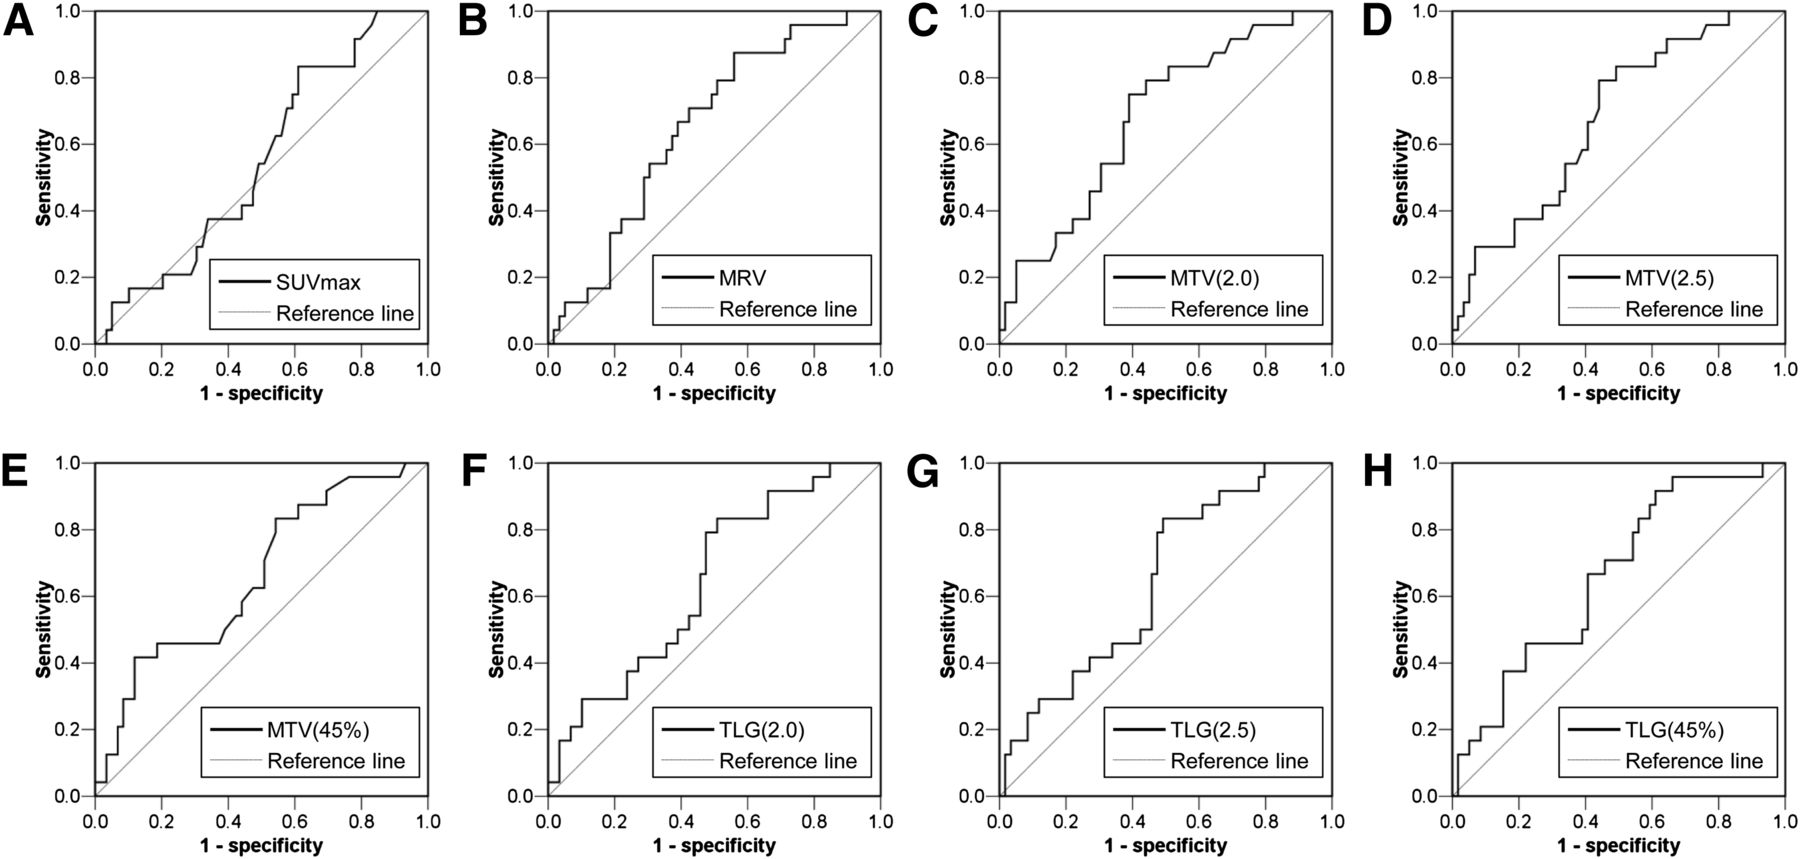
The abilities of the SUVmax, MRV, MTV, and TLG values for various SUV thresholds to predict metastasis-free survival were calculated from their ROC curves (Fig. 2). The area under the curve (AUC) of SUVmax was 0.550 (P = 0.476). Among the volume parameters (MRV and MTVs), MTV(2.0) produced the highest AUC (0.679; P = 0.011). The AUC values of MRV, MTV(2.5), and MTV(45%) were 0.652 (P = 0.031), 0.676 (P = 0.012), and 0.660 (P = 0.023), respectively. Among the TLG values, TLG(45%) produced the highest AUC (0.660; P = 0.023). The AUC values of TLG(2.0) and TLG(2.5) were 0.643 (P = 0.041) and 0.648 (P = 0.035), respectively. These results showed MTV(2.0) to be the most effective parameter from pretreatment MR imaging and PET/CT for predicting metastasis.

ROC curves using SUVmax (A), MRV (B), MTVs at different cutoff SUVs (C–E), and TLGs at different cutoff SUVs (F–H) to predict metastasis. AUCs of SUVmax and MRV were 0.550 (P = 0.476) (A) and 0.652 (P = 0.031) (B), respectively. AUCs of MTV(2.0), MTV(2.5), and MTV(45%) were 0.679 (P = 0.011) (C), 0.676 (P = 0.012) (D), and 0.660 (P = 0.023) (E), respectively. AUCs of TLG(2.0), TLG(2.5), and TLG(45%) were 0.643 (P = 0.041) (F), 0.648 (P = 0.035) (G), and 0.660 (P = 0.023) (H), respectively.
Clinicopathologic Characteristics of Patients with Large MTV(2.0) Values
The clinicopathologic characteristics of patients according to their MTV(2.0) values (small [MTV(2.0) ≤ 105 mL] vs. large [MTV(2.0) > 105 mL]) are summarized in Table 1. Age, sex, histologic subtype, and histologic response did not differ significantly between patients with small and large values of MTV(2.0). Large MTV(2.0) values correlated significantly positively with AJCC stage IIB (P < 0.001) and negatively with tumor location in the humerus (P = 0.026).
Patient Characteristics for Groups with MTV(2.0) ≤ 105 and > 105 mL
Survival Analysis
Among the imaging parameters, we included only MTV(2.0) and TLG(45%) in the survival analysis and presented the survival data according to the clinicopathologic variables (Table 2). Univariate analysis demonstrated MTV(2.0), TLG(45%), AJCC stage, and histologic response to be associated with metastasis-free survival. By multivariate analysis, only an MTV(2.0) > 105 mL (relative risk [RR], 3.93; 95% CI, 1.55–9.92) and poor histologic response (RR, 4.83; 95% CI, 1.64–14.21) independently shortened the metastasis-free survival. The assumption of proportional hazards was not violated for any of the continuous variables included in the final model. The Martingale residual analysis for each prognostic variable showed that the Cox regression model was appropriate for analyzing the metastasis-free survival in the current study. The predictive accuracy of this model correlated well with the observed events (76% of correct classification, Hosmer–Lemeshow goodness-of-fit P = 0.521). Calibration curves for 5-y metastasis-free survival predictions are shown in Supplemental Figure 1 (supplemental materials are available at http://jnm.snmjournals.org). The Harrell C-index increased when MTV(2.0) was added to a model with the histologic response alone (0.778; 95% CI, 0.673–0.862, vs. 0.688; 95% CI, 0.577–0.785).
Cox Proportional Hazards Models for Metastasis-Free Survival
A separate multivariate analysis omitting MTV(2.0) found TLG(45%) (RR, 3.64; 95% CI, 1.53–8.65) and poor histologic response (RR, 6.19; 95% CI, 2.08–18.41) to be independent predictors of shorter metastasis-free survival (Table 3).
Multivariate Cox Model Without Entering Variable MTV(2.0)
Survival Analysis According to MTV(2.0) and Histologic Response
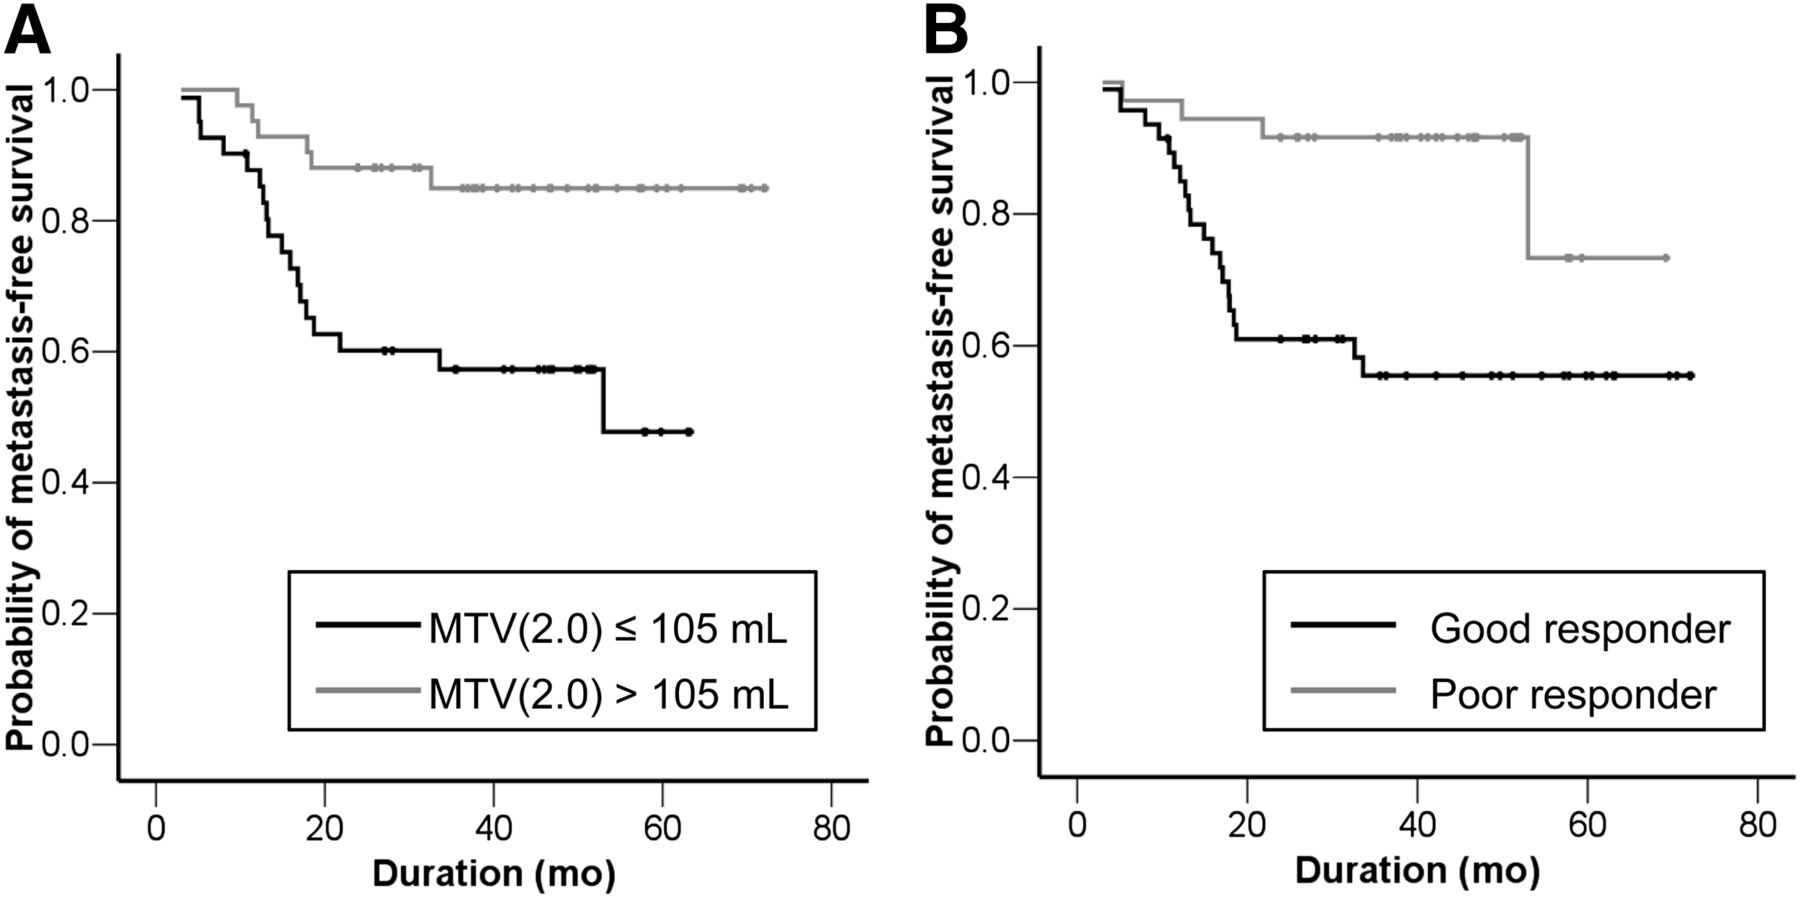
As illustrated in Figure 3, patients (n = 41) with tumors with larger MTV(2.0) values (>105 mL) had significantly lower 3-y (57% vs. 85%) and 5-y (47% vs. 85%) metastasis-free survival rates than patients with smaller tumors (P = 0.002). Similarly, patients with a poor histologic response had worse 3-y (55% vs. 92%) and 5-y (55% vs. 73%) metastasis-free survival rates than patients who showed a good histologic response (P = 0.002).

Kaplan–Meier estimate of metastasis-free survival by MTV(2.0) (A) and by histologic response (B).
The entire cohort was classified on the basis of the histologic response and MTV(2.0) into 4 groups: group I, patients with MTV(2.0) ≤ 105 and good histologic response (n = 19); group II, patients with MTV(2.0) ≤ 105 and poor histologic response (n = 23); group III, patients with MTV(2.0) > 105 and good histologic response (n = 17); and group IV, patients with MTV(2.0) > 105 and poor histologic response (n = 24). The 3-y metastasis-free survival rates of groups I, II, III, and IV were 100%, 73%, 82%, and 38%, respectively, whereas the 5-y metastasis-free survival rates of groups I, II, III, and IV were 100%, 73%, 41%, and 38%, respectively. The log-rank test showed significant differences in survival between each group and every other (P = 0.019 for group I vs. II, P = 0.025 for group I vs. III, P < 0.001 for group I vs. IV, P = 0.016 for group II vs. IV, and P = 0.026 for group III vs. IV, respectively) except for group II versus group III (P = 0.928) (Fig. 4). The exemplary images of MRV and MTV at different cutoff SUVs are shown in Figure 5.
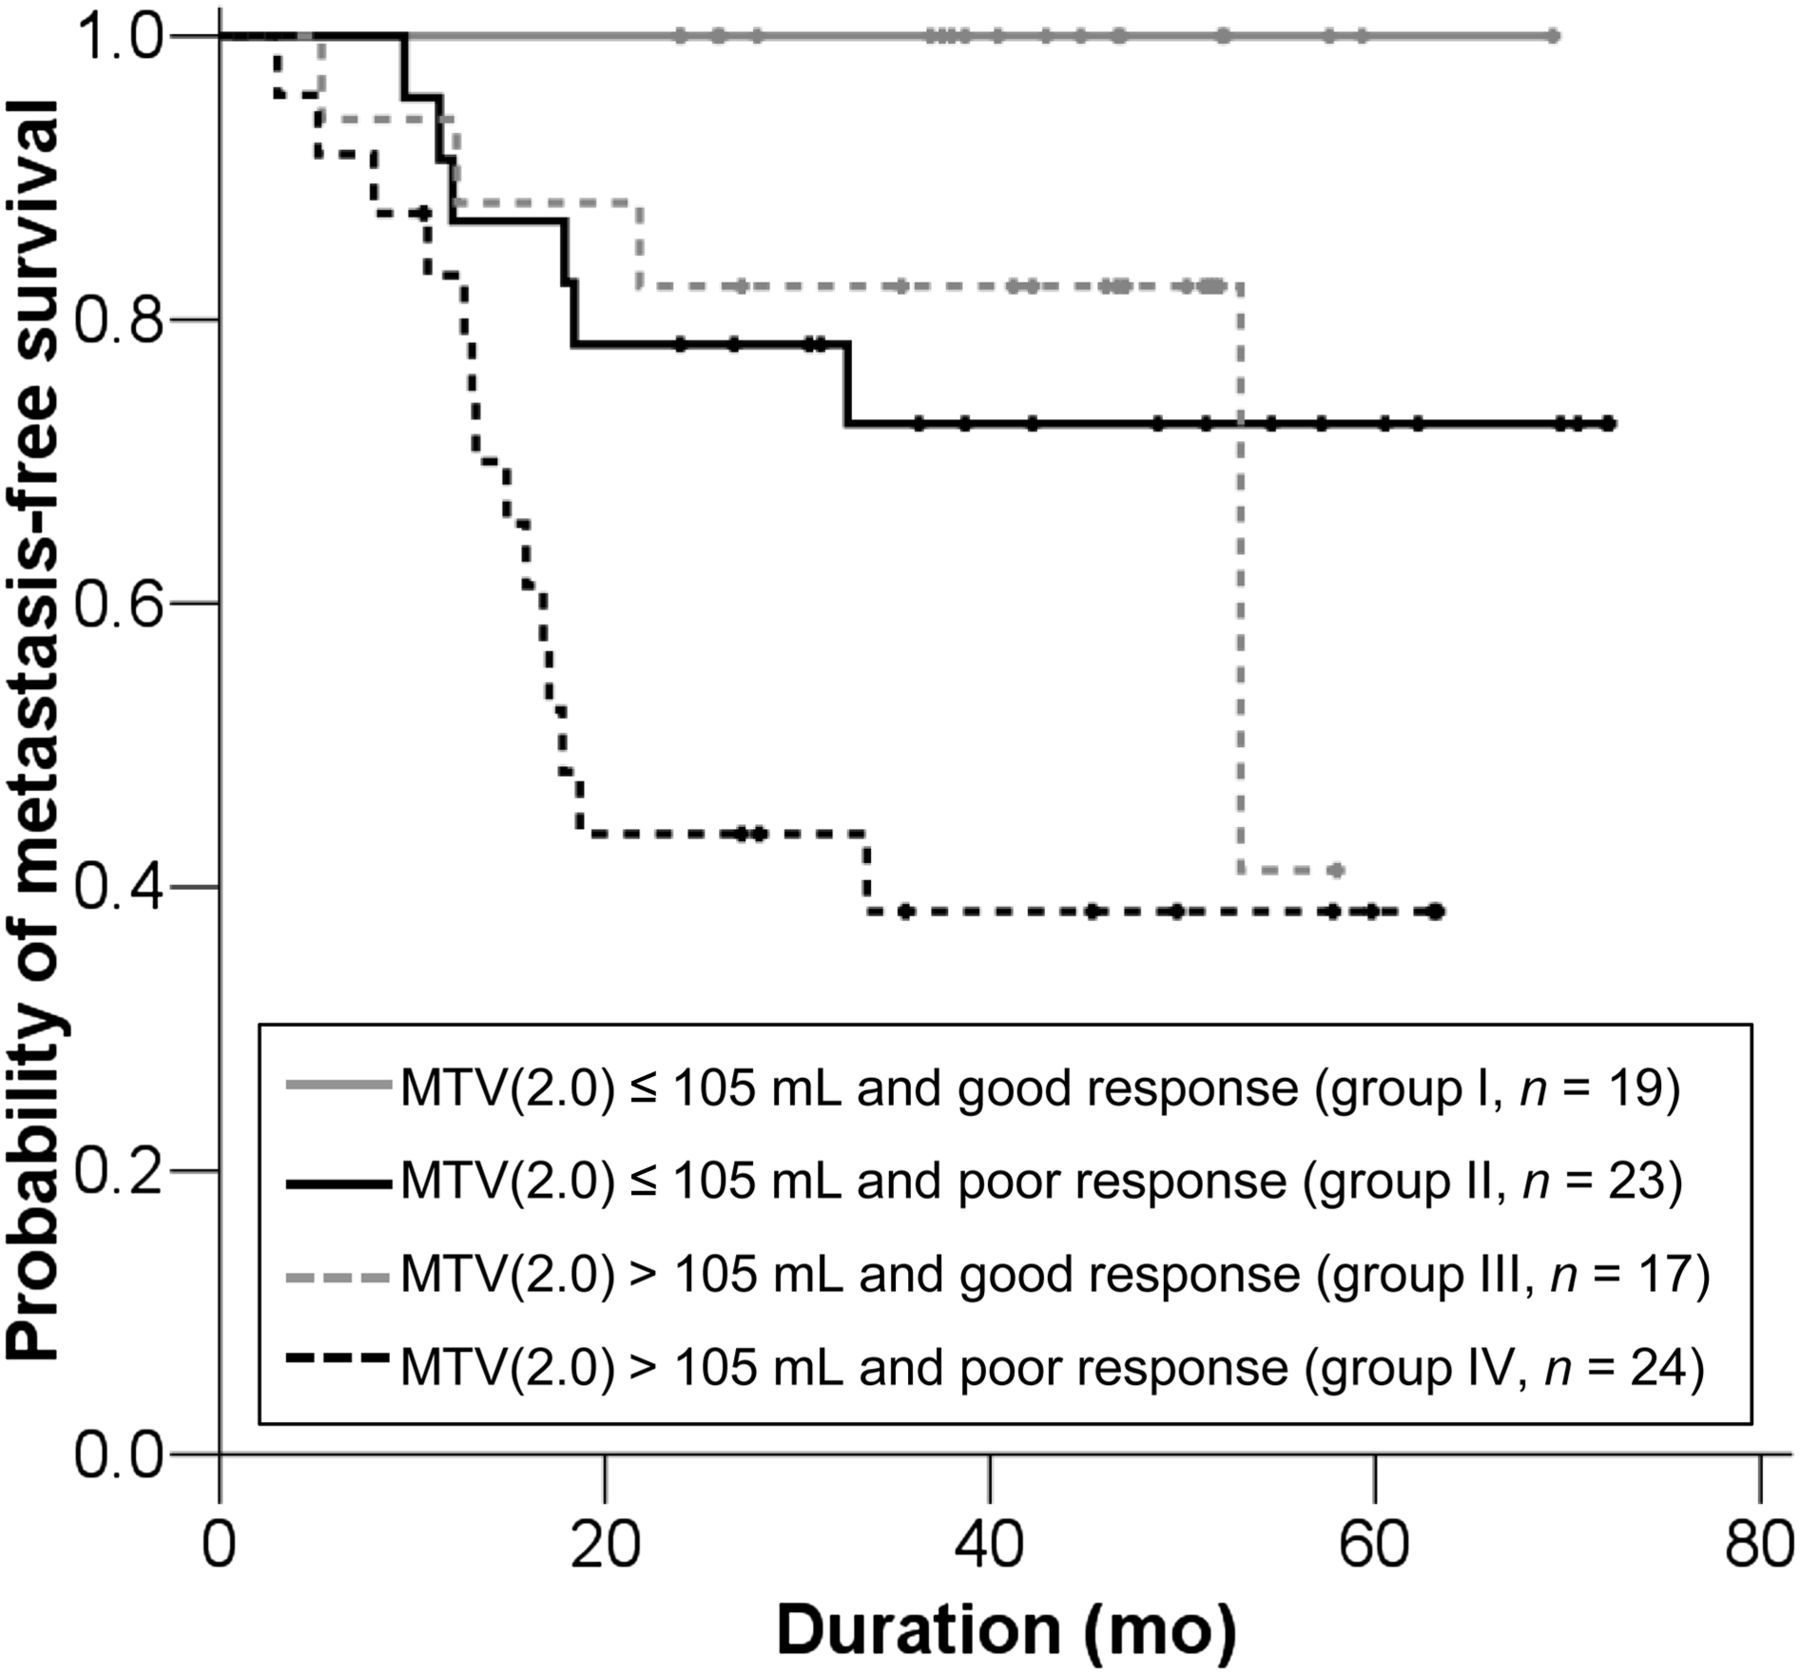
Kaplan–Meier metastasis-free survival curves of risk groups defined by MTV(2.0) and histologic response. Five-year metastasis-free survival rates were 100% in group I, 72.6% in group II, 41.1% in group III, and 38.2% in group IV. Log-rank test showed difference in survival among the 4 groups, except for between group II and group III (P = 0.928).

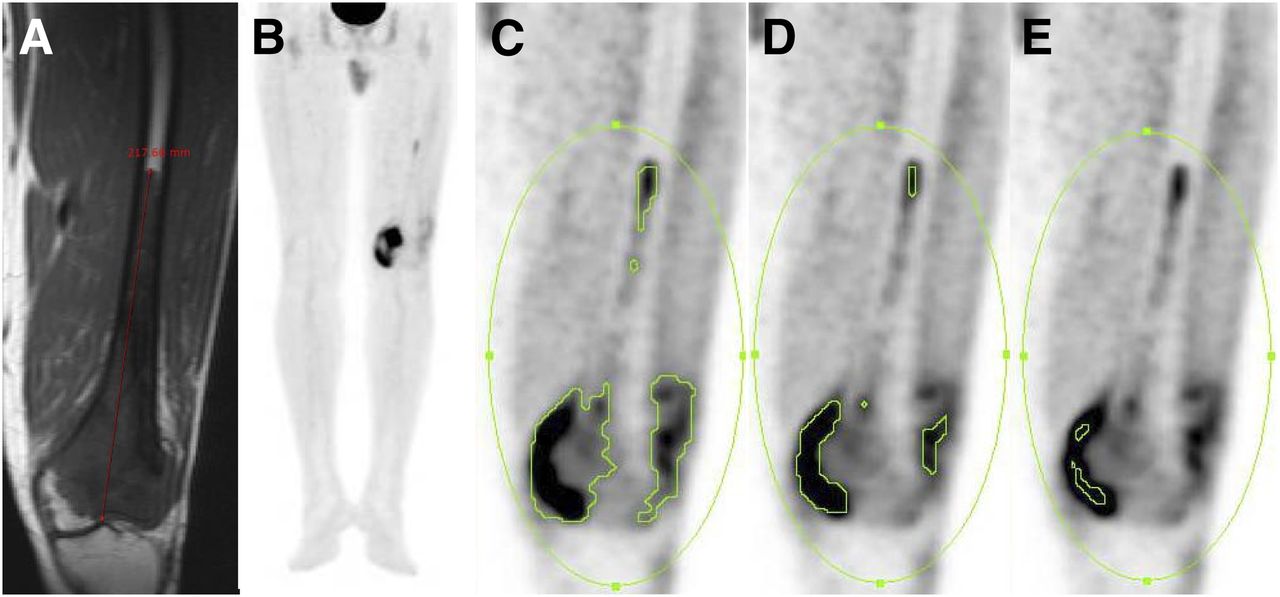
Pretreatment coronal unenhanced T1-weighted image (A), maximum-intensity-projection image of 18F-FDG PET (B), and coronal 18F-FDG PET images using different threshold SUVs (C–E) of a 36-y-old male with osteosarcoma of left femur. MRV (A), SUVmax, MTV(2.0) (C), MTV(2.5) (D), and MTV(45%) (E) were 691 mL, 10.6, 86 mL, 53 mL, and 16 mL, respectively. Although patient showed poor histologic response after completing neoadjuvant chemotherapy, he has been alive without recurrence or metastasis for 67 mo after surgery.
DISCUSSION
Most protocols used today use chemotherapy both before and after surgery in patients with osteosarcoma. Delayed removal of tumor after neoadjuvant chemotherapy, however, may compromise clinical outcomes (32), and no convincing survival benefit from neoadjuvant chemotherapy has been proven (21,33). Risk-adapted therapy based on prognostic factors other than histologic response is hence needed to minimize the ineffective use of neoadjuvant chemotherapy. In the current study, the addition of MTV(2.0), which is available before neoadjuvant chemotherapy, to histologic response provided more detailed prediction of outcome than histologic response alone. This combination may be a useful tool for planning risk-adapted therapy in patients with osteosarcoma.
MTV has some advantages over MRV for use as a prognostic indicator. The MRV calculated from 3 parameters (length, width, and depth) using the ellipsoid equation does not represent the real tumor burden because tumors are not always uniformly shaped and could contain necrotic portions with nonviable tissue (26,34). MTV, in contrast, is based on the metabolism of the malignant tumor and hence more accurately reflects the real tumor burden. Moreover, MTV can be readily measured by drawing a volume of interest around the tumor, enabling very high intra- and interobserver reproducibility (18). Although previous studies have assessed the prognostic value of tumor size or tumor volume of osteosarcoma using different cutoff values, ranging from 8 to 10 cm (35–37) and 60 to 300 mL (22,26,38), respectively, the present study suggests that MTV is a better predictor of survival than the tumor size or tumor volume measured by MR imaging.
Pretreatment TLG but not SUVmax predicted survival in our study, which was in line with a previous report by Costelloe et al. (11). Although we hypothesized that TLG, by combining SUV and MTV, might be a more accurate predictor than either of them alone, TLG had a smaller AUC value and a lower RR in the survival analysis than MTV. The multivariate significance of TLG(45%) changed with the inclusion or omission of MTV(2.0) from the model, which can be explained by the dependence of TLG(45%) on MTV(2.0). From these results, we postulate that MTV is more important than tumor activity for predicting survival of osteosarcoma.
There is as yet no standardized method for evaluating the MTV or TLG. In the current study, however, a fixed SUV threshold of 2.0 could discriminate between the tumor and surrounding normal tissue. Moreover, MTV(2.0) was not only the closest correlate with MRV among the MTV values for different SUV thresholds but also independently predicted survival. The results of this study suggest that a fixed SUV threshold of 2.0 is suitable for measuring MTV, which reflects the biologically active tumor burden in patients with osteosarcoma.
Stratification of patients by the combined criteria of MTV and histologic response could provide more detailed prediction of clinical outcome than MTV or histologic response alone. It is noteworthy that the prognosis of patients with good histologic response and a large MTV is similar to that of patients with a poor histologic response and a small MTV. On the basis of these combined criteria, high-risk patients with osteosarcoma may need to consider more aggressive systemic chemotherapy than low- or intermediate-risk patients because they more easily relapse and develop metastases.
The present study has several limitations. First, we retrospectively analyzed a cohort of consecutively treated patients assembled by including only patients who met the inclusion criteria. Second, we studied a relatively small number of patients treated at a single institution. Third, differences in SUV measurements among different PET scanners could limit the applicability of MTV(2.0) in clinical practice. Finally, not all suspected metastatic lesions were histologically confirmed, because patients with multiple metastases or poor general condition did not undergo surgical resection of suspected lesions. However, all possible clinical assays, including physical examination and imaging studies, were used to confirm the presence of metastatic osteosarcoma. Better-controlled prospective studies in a larger patient population are warranted to validate this promising strategy for improving the prediction of clinical outcomes of patients with osteosarcoma.
CONCLUSION
The MTV before neoadjuvant chemotherapy can accurately predict the clinical outcomes of patients with osteosarcoma. The combination of MTV and histologic response predicts survival more accurately than the histologic response alone. We anticipate that this new prognostic stratification based on MTV and histologic response will be important for guiding treatment decisions.
DISCLOSURE
The costs of publication of this article were defrayed in part by the payment of page charges. Therefore, and solely to indicate this fact, this article is hereby marked “advertisement” in accordance with 18 USC section 1734. This work was supported by Establishment of Center for PET Application Technology Development, Korea Institute of Radiological and Medical Sciences (KIRAMS), and by grants from the Ministry of Education, Science and Technology (50441-2013). No other potential conflict of interest relevant to this article was reported.
Footnotes
Published online Aug. 15, 2013.
- © 2013 by the Society of Nuclear Medicine and Molecular Imaging, Inc.
REFERENCES
- Received for publication November 26, 2012.
- Accepted for publication April 29, 2013.


Jump to section
Related Articles
Cited By...
- 18F-FDG PET/CT in the Management of Osteosarcoma
- 18F-FDG PET/CT in the Management of Osteosarcoma
- Technologist-Based Implementation of Total Metabolic Tumor Volume into Clinical Practice
- 18F-FDG Uptake During Early Adjuvant Chemotherapy Predicts Histologic Response in Pediatric and Young Adult Patients with Osteosarcoma