


Abstract
Renal toxicity associated with small-molecule radionuclide therapy has been shown to be dose-limiting for many clinical studies. Strategies for maximizing dose to the target tissues while sparing normal critical organs based on absorbed dose and biologic response parameters are commonly used in external-beam therapy. However, radiopharmaceuticals passing though the kidneys result in a differential dose rate to suborgan elements, presenting a significant challenge in assessing an accurate dose–response relationship that is predictive of toxicity in future patients. We have modeled the multiregional internal dosimetry of the kidneys combined with the biologic response parameters based on experience with brachytherapy and external-beam radiation therapy to provide an approach for predicting radiation toxicity to the kidneys. Methods: The multiregion kidney dosimetry model of MIRD pamphlet no. 19 has been used to calculate absorbed dose to regional structures based on preclinical and clinical data. Using the linear quadratic model for radiobiologic response, we computed regionally based surviving fractions for the kidney cortex and medulla in terms of their concentration ratios for several examples of radiopharmaceutical uptake and clearance. We used past experience to illustrate the relationship between absorbed dose and calculated biologically effective dose (BED) with radionuclide-induced nephrotoxicity. Results: Parametric analysis for the examples showed that high dose rates associated with regions of high activity concentration resulted in the greatest decrease in tissue survival. Higher dose rates from short-lived radionuclides or increased localization of radiopharmaceuticals in radiosensitive kidney subregions can potentially lead to greater whole-organ toxicity. This finding is consistent with reports of kidney toxicity associated with early peptide receptor radionuclide therapy and 166Ho-phosphonate clinical investigations. Conclusion: Radionuclide therapy dose–response data, when expressed in terms of biologically effective dose, have been found to be consistent with external-beam experience for predicting kidney toxicity. Model predictions using both the multiregion kidney and linear quadratic models may serve to guide the investigator in planning and optimizing future clinical trials of radionuclide therapy.
The kidneys—because they are a primary route of excretion for low-molecular-weight radionuclide conjugates and are known to concentrate certain radiometals—are potential radiation dose–limiting organs in radionuclide therapies. A multiregion kidney model was presented by McAfee (1) in 1969, by Blau et al. in 1975 (2), and in MIRD pamphlet no. 19 in 2003 (3) because it was recognized that radiopharmaceuticals excreted through the kidneys typically display a nonuniform distribution over time, which results in a corresponding nonuniform distribution of tissue absorbed dose. For diagnostic radiopharmaceuticals, the level of concern is regulatory because the activities administered do not present a significant potential for early or late renal toxicity. With the advent of aggressive therapeutic strategies for cancer treatment using targeted radionuclide therapy, significant renal impairment or failure has been observed (4–10). Radiolabeled antibodies had never been administered in sufficiently high activities to result in radiation nephropathy, as bone marrow toxicity usually was the radiation dose–limiting factor because of the long circulating half-life of these larger conjugates. When small molecules are labeled with α-, β-, or Auger-emitting radionuclides, higher amounts of radioactivity can and are being administered with less marrow suppression. Because of the rapid transit of these molecules through the urinary tract, and the associated increased radiation absorbed dose to the kidneys, reports of kidney toxicity have appeared.
Because the radiation absorbed dose estimates were of limited value in predicting renal toxicity using the MIRD or other schema with whole-organ anatomic renal models, more sophisticated methodologies have been investigated. Three considerations improve the value of the dosimetry estimates: use of the patient-specific kidney mass, consideration of the locoregional distribution of the radioactivity retained and transit times through the kidneys, and consideration of dose rate effects. To establish a more accurate dose–response relationship for kidney toxicity, one should obtain data of higher spatial and temporal resolution on radioactivity transiting the various kidney subregions. Such data, in conjunction with a multiregion kidney model (3) will enable the inclusion of radiobiologically significant parameters (e.g., dose rate, repair time of sublethal damage, and differential suborgan radiosensitivity) to more accurately predict renal toxicity.
To facilitate and provide guidance on the use of the multiregion kidney model, we review basic radiobiologic background information and provide several examples that combine regional dose nonuniformity with variations in dose rate and cellular repair to predict the relative effects of each on potential renal toxicity. A parametric analysis was used to examine the impact of different initial assumptions on predicted renal toxicity. The examples provide theoretic guidance for use in planning safe and effective clinical protocols. Similarly, the radiobiologic methodology in these examples reflects current understanding and modeling of the radiobiologic processes involved. It is likely that evolving experience with new methods and increasing numbers of patients will lead to refined models and more effective treatment protocols. The dose–response experience for individual patients is highly dependent on patient circumstances and the properties of past, present, and future radiopharmaceuticals.
To aid the reader, we have tabulated the abbreviations used in this article (Table 1).
Abbreviations Used in This Article
The largest amount of cellular, animal, and human dose–response data collected over the last century for all organs is derived from experience with external-beam irradiation. Radiobiologic data for kidney tolerance in animals and humans are well established for specified irradiation volumes, fractionation schemes, and dose rates (11–24). Mohan et al. (25), Burman et al. (26), Lyman (27), and, specifically for kidney, Olsen et al. (28) and Yorke et al. (29) found it useful to provide a dose–volume histogram analysis to predict the normal-tissue complication probabilities when organs receive partial or nonuniform irradiation during conformal external-beam radiotherapy or brachytherapy irradiation near critical normal structures. The Lyman (27) model of normal-tissue complication probabilities assumes that the probability of complication after irradiation of a specified volume of an organ at risk follows a sigmoidal dose–response relationship.
Accordingly, TD50(v) is defined as the 50% tolerance absorbed dose for uniform irradiation, v is the fraction of the organ irradiated (or the volume relative to a selected reference volume), and D is absorbed dose to this volume. For this work, the tolerance dose will always appear in a functional form with volume (that is, TD(v)) and total absorbed dose will be designated DT.
For bilateral whole-kidney external-beam irradiation, Emami et al. (11) found a tolerance dose (TD5/5(1)) of 23 Gy delivered in 5 wk. This value is widely quoted as yielding symptoms of radiation nephritis in 5% of the population within 5 y. Similarly, 28 Gy is quoted to yield symptoms of radiation nephritis in 50% of the population within 5 y (TD50/5(1)). Dose rate was found to be a critical factor after total-body irradiation (30). The TD5/5 was reduced to just 10 Gy if all radiation was delivered within 2 h.
The applicability of such external-beam dose–response data to radionuclide therapy agents is still under investigation (31). Many investigators (32–42) have applied the well-known linear quadratic (LQ) model over the past 2 decades to include the effects of repair and dose rate in their evaluation of biologic response in radionuclide therapy.
THEORETIC BASIS AND MODEL EQUATIONS
The LQ model, with its possible advantages as outlined by Fowler and Stern in 1960 (43), is now used extensively in clinical radiobiology (44). The model is based on the consideration of 2 types of cell killing: single-hit or double-hit DNA events. A single-hit cell kill (type A event) corresponds to a lethal single-ionization event and is thus independent of dose rate. A double-hit cell kill (type B event) can be induced only by 2 closely spaced separate ionization interactions occurring in a short interval and is thus a function of dose rate. The LQ equation for the surviving fraction (SF) of cells after an instantaneously delivered absorbed dose D is Eq. 1where αD is attributed to cell kill from type A events, and βD2 from type B events. If the absorbed dose D is delivered over a time T (protracted irradiation), type B events must be corrected for repair of sublethal damage:
 Eq. 2where g(T) is a dimensionless function expressing the decrease in lethality from type B events with increasing treatment time, T (44,45). When the duration, T, of the protracted absorbed dose, D, becomes significantly long compared with the repair half-time, then for an absorbed dose delivered at a constant dose rate, g(T) can be approximated by the expression
 Eq. 3Awhere μ is the rate of repair of sublethal damage (μ = ln 2/Trep, where Trep represents the repair half-time constant) (45–51). Equation 3A is derived from the double integration of a constant dose rate (D/T) according to the Lea–Catcheside formulism developed for the incomplete repair model (48,50). For most organs, Trep ranges between 0.25 and 3.0 h (45), which supports the use of Equation 3A for most radionuclide therapy agents, the notable exceptions being the α-emitters 213Bi, 212Bi, and 211At and others (42,52,53). A comprehensive characterization of the histopathology of radiation-induced renal failure, renal tubulointerstitial changes after internal irradiation with α-particle–emitting actinium daughters, as well as an examination of agents that can reduce renal toxicity have been reported (53,54). It should be noted that the effects of relative biological effectiveness associated with high–light-energy-transfer radiation are beyond the scope of these analyses and can be incorporated using the method described by Dale (42).
Assuming rapid, near-instantaneous uptake and exponential clearance of activity in a target organ, the time dependence of radiation absorbed dose to the target organ follows an exponential curve with an effective decay constant of λe, assuming single-exponential kinetics. In this case, the factor g(T), expressed as a function of the elapsed time T after injection of the radionuclide, is obtained by a double integration method similar to that used in deriving Equation 3A but with an exponential decay term included in the dose-rate function (50): Eq. 3BEquation 3B reflects the overall effect of type B damage over the whole of the selected time, T, rather than the instantaneous effect at any particular moment. The term g(T) becomes very small and the quadratic term in Equation 2 diminishes when the effective half-time is much greater than the repair half-time (i.e., λe < < μ). With short effective half-lives, g(T) is a more significant factor, especially immediately after injection of the radionuclide and at the onset of radiation absorbed dose delivery to the kidneys.
To account for the biologic effect of dose rate, the LQ model has been used to derive a biologically effective dose (BED). BED is related to the logarithmic cell kill, and because the radiobiologic model parameters differ between tumors and normal tissues, there are different BED values for each irradiated tissue (35,42,43). The original BED is a cell survival model in which all cells receive the same absorbed dose and are subject to the same temporal pattern of absorbed dose. The relative change between tumor BED and critical normal-tissue BED when treatment delivery conditions are altered is therefore a useful indicator in predicting and assessing how the therapeutic index differs in such cases. Therapeutic index is defined in this context as the ratio of probabilities of tumor cure and normal-tissue complications (42). Calculation of tissue-specific BEDs should make it possible to predict the impact of different treatment modalities, including targeted radiotherapy regimes, on the basis of knowledge derived from the effects of external-beam treatments.
The BED is the product of the total absorbed dose (DT) and a biologic factor designated the relative effectiveness per unit dose, namely: Eq. 4
Eq. 4
The main radiobiologic parameters important in conventional radiotherapy are equally relevant for targeted radionuclide therapy. Thus, with temporal variations in dose rate included, the LQ formulation may be applied to this modality also. There are 3 relevant formulae for calculating late-responding normal-tissue BEDs. For fractionated external-beam therapy, the formula is Eq. 5where N is the number of fractions and d the dose per fraction and therefore RE = 1 + d/(α/β) and the total absorbed dose DT = Nd. For continuous therapy at a low, constant dose rate, the formula is
 Eq. 6where R is the dose rate, T is the elapsed treatment time after administration, and DT has been expressed as the product RT (32,35,51). For continuous therapy with an exponentially decreasing dose rate, the formula is
 Eq. 7Awhere R0 is the initial dose rate and λe is the effective rate constant describing the loss of radioactivity (assumed to be exponential) from the organ in question. The parameter λe is the sum of the radioactive decay rate constant and the organ clearance rate constant (35). In this case, DT has been expressed as R0/λe. This expression accounts for the radionuclide complete decay where T → ∞. Similarly, the exact expression for times less than infinity is given by
 Eq. 7B
The g(T) factor is implicit in Equation 7B and may be expressed in terms of the g(T) factor described in Equation 3B. Equations 1–3 are relevant for late-responding normal tissues. For tumors and early (acute)-responding normal tissues, either of which may exhibit cellular repopulation during treatment, more complex formulations are necessary (35,49). Also, the temporal pattern of activity uptake and clearance in targeted radiotherapy is complex and may not always be adequately approximated by a monoexponential function, as was assumed in deriving Equation 3A (32,35). Finally, the derivation described by Equations 3B, 7A, and 7B equates radioactivity kinetics with dose-rate kinetics. This equivalence is strictly true only for the self-dose terms. If the target organ is being irradiated by other organ or suborgan components from radionuclides with high photon fluences, then the derivation should account for the impact of cross dose on the target organ dose rate (55).
APPLICATION OF LQ AND BED MODELS TO KIDNEY
If the absorbed dose and dose rate to individual regions of the kidney are known, then it is possible to compute region-specific cell survival taking into account both temporal and spatial distribution of activity. Unfortunately, suborgan, region-specific α- and β-values are not available in the experimental literature and may be derived only by using the α/β-ratios for the whole organ, as these are widely reported (45). Further, BED is conceived of as an average value of homogeneous cell survival and is customarily reported for whole-organ systems to compare toxicities for different irradiation fractionation patterns and tissue radiosensitivities.
In this report, we extend and apply the LQ model to be used with the multiregion kidney model to predict cell survival in different regions of the kidney depending on the model radiosensitivity assumed for these regions and the computed absorbed dose. The factor g(T), introduced in Equation 2, which accounts for incomplete repair as a function of time, can also be used to correct for the low dose rates associated with targeted radiotherapy (43,46). It has been suggested that the kidney be considered a collection of functional subunits (or FSUs) such that it may be useful to view the toxicity in terms of FSU survival rather than survival at a cellular or a whole-organ level. Organ radiotoxicity occurs only if a sufficient number of FSUs are destroyed (29). This approach, which has been gaining theoretic appeal for many organ systems, is based on the assumption that organs consist of independent FSUs. The response of an organ to irradiation depends on individual FSU radiosensitivity and the arrangement of the FSU in the organ architecture. At least 2 distinct arrangements of FSUs have been identified: namely, serial and parallel organ architectures. In the serial organ model, it is assumed that a complication will occur if a single FSU is destroyed by irradiation (e.g., spinal cord, esophagus, or gastrointestinal tract). In the parallel model, it is assumed that there is some threshold value for the fractional number of FSUs that must be eradicated in order for whole-organ complications to manifest. These parallel models have been applied to the complication rate and redundant architecture observed in the kidneys, lungs, and liver (56).
The nephron is the fundamental FSU for the kidney. This FSU is responsible for the formation of urine, and it physically extends from the cortex through the medulla. In the sense that there are 2 kidneys, it can be considered a parallel system, but each kidney in turn is composed of many nephrons (each an FSU) arrayed as parallel elements. In line with the critical volume model described by Niemierko and Goitein (57) and independently described by Källman et al. (58), FSUs may also be identified for different regions of the kidney (e.g., the different cortical segments, or their fractional distribution in the medulla and cortex). In these models that allow for nonuniformity in absorbed dose to an organ, the primary elementary compartment may not conform to a well-defined FSU but rather may be appropriately specified to a volume element or voxel. For example, a region (cluster of voxels) in the cortex may sustain a specific level of damage to nephrons while the kidney still adequately functions. However, if many regions of the cortex are damaged, and the damage is to such an extent that the number of intact FSUs falls below a critical value, the entire organ is likely to fail.
Assuming that this discussion regarding volume-defined FSUs is applicable and, further, that these FSUs have known or parameterized values of α and β, given by (αCor, βCor) and (αMed, βMed) for the cortex and medulla, respectively, the SF of FSUs in the cortex and the medulla can be calculated as follows: Eq. 8
Eq. 8
and Eq. 9where g(T) is the dimensionless factor correcting for low dose rate, and DCor and DMed are the average absorbed doses in the cortex and medulla, respectively. A combined SF of FSU can also be calculated for the whole kidney, assuming that the number of FSUs in a given region is proportional to its volume:
 Eq. 10where VCor and VMed are the volumes of the cortex and medulla, respectively. From these last 3 equations, kidney failure can be determined as a function of nonuniform dose and dose rate. The LQ model for high-dose radiation therapy and cellular survival will be used in the examples that follow.
PARAMETERIZATION AND MODEL PREDICTIONS
For a more complete understanding of kidney response to radiation arising from the clearance of therapeutic levels of radiopharmaceuticals in systemic targeted therapy, several potentially relevant examples have been developed. These illustrate the relative importance of dose rate, radiosensitivity, and suborgan spatial nonuniform activity distribution using regionally deposited absorbed dose data and known radiobiologic tissue sensitivity to the formalism presented in Equations 1–10. The cortical region of the kidney is estimated to contain an abundance of the proximal tubule structures and 85% of the glomeruli, which are assumed to be the most radiosensitive target (59–61) for this work. The model calculations assist in understanding the dose–response relationships for existing radiolabeled therapeutic agents used in humans and in predicting the behavior of new agents.
Example 1: Effect of Dose Rate
First, when radiobiologic information is introduced into dose–response relationships, one of the most highly correlated variables is dose rate. Simply, when higher dose rates are delivered to an organ, greater cellular lethality will occur (43,48,51). As shown in the previous section and in Figure 1A, this dose-rate effect is dependent on the intrinsic α/β-ratio (related to tissue radiosensitivity) and the repair half-time for the irradiated tissue.

(A) Theoretic illustration of variation of SF of FSU in renal cortex of kidney vs. duration of exposure. Effect of several different half-times of cellular repair on FSU survival is also shown. This illustration assumes that kidney receives uniform average absorbed dose of 15 Gy (Dcor = 15 Gy) and that αCor = 0.06 Gy−1 and αcor/βCor = 2.5 Gy based on data idealized from Thames and Hendry (45). As average dose rate is increased by irradiating cortex in shorter time to same total absorbed dose, SF of FSU correspondingly decreases. Longer repair half-times are also associated with decreased capacity for repair after protracted irradiation. (B) SF of FSU in cortex vs. Teff of radiopharmaceutical (radionuclide conjugate). Model calculation assumes that kidney receives uniform average absorbed dose of 15 Gy (Dcor = 15 Gy) with αcor/βCor = 2.5 Gy. (C) Relative contribution of g(T) for double-hit cell kill due to protracted irradiation, plotted as function of time after injection for radiopharmaceutical with several effective half-lives. Repair half-time for sublethal damage was assumed to be 2 h. Equation 3B was used to derive these curves. (D) Dose volume histograms for absorbed dose distribution by 90Y, 111In, and 177Lu in adult male renal cortex (MIRD pamphlet no. 19 model) by homogeneous activity distribution (top) and by inhomogeneous activity distribution (bottom). In both cases, 71% of kidney uptake was in cortex and 29% in medulla. Mean absorbed dose to cortex was 15 Gy according to MIRD pamphlet no. 19 kidney model, with absorbed dose distributions calculated using MCNP Monte Carlo code. Inhomogeneous distribution was modeled to follow uptake structure observed in autoradiographs of kidney segments after 111In-DTPA-octreotide administration (66).
Similarly in Figure 1B, to highlight the dose-rate effect in terms of the effective half-time Teff of the radiopharmaceutical through the kidney, the SF in the cortex is plotted against the Teff for several values of the tissue repair half-time constant Trep. A shorter Teff for the radiopharmaceutical was associated with a higher average dose rate and a corresponding decrease in SF in the cortex.
In Figure 1C, the relative contribution of the quadratic term in Equation 2, which is strongly dependent on dose rate, is shown for different values of Teff for radiopharmaceutical clearance.
For all effective half-lives, g(T) followed a common curve during the first 10 h. After that time, radiopharmaceuticals with longer Teff values corresponded to lower values of g(T). For the radiopharmaceuticals with 3- and 6-h effective half-lives, 90% and 69%, respectively, of the total kidney absorbed dose had been deposited by 10 h.
The reference conditions for the classic cases of radiation nephritis are from whole or hemibody external-beam irradiation. Nonuniformity in the radiation absorbed dose to the kidney has been shown to be mostly anatomic (e.g., the urinary collecting ducts and part of the cortices of both kidneys in a 4-field paraaortic lymph node irradiation (62)). In radionuclide therapy, the functional units are irradiated from within. Radioactivity uptake in the kidney is frequently highly nonuniform, as shown by De Jong et al. (63). With nonuniform radioactivity uptake in the kidney cortex comes a corresponding nonuniform dose distribution for high-energy β-emitters, as depicted in Figure 2 of De Jong et al. For an equally nonuniform activity distribution, low-energy β-emitters, such as 177Lu and other therapeutic agents, will result in less uniformity in the absorbed dose distribution (64,65).

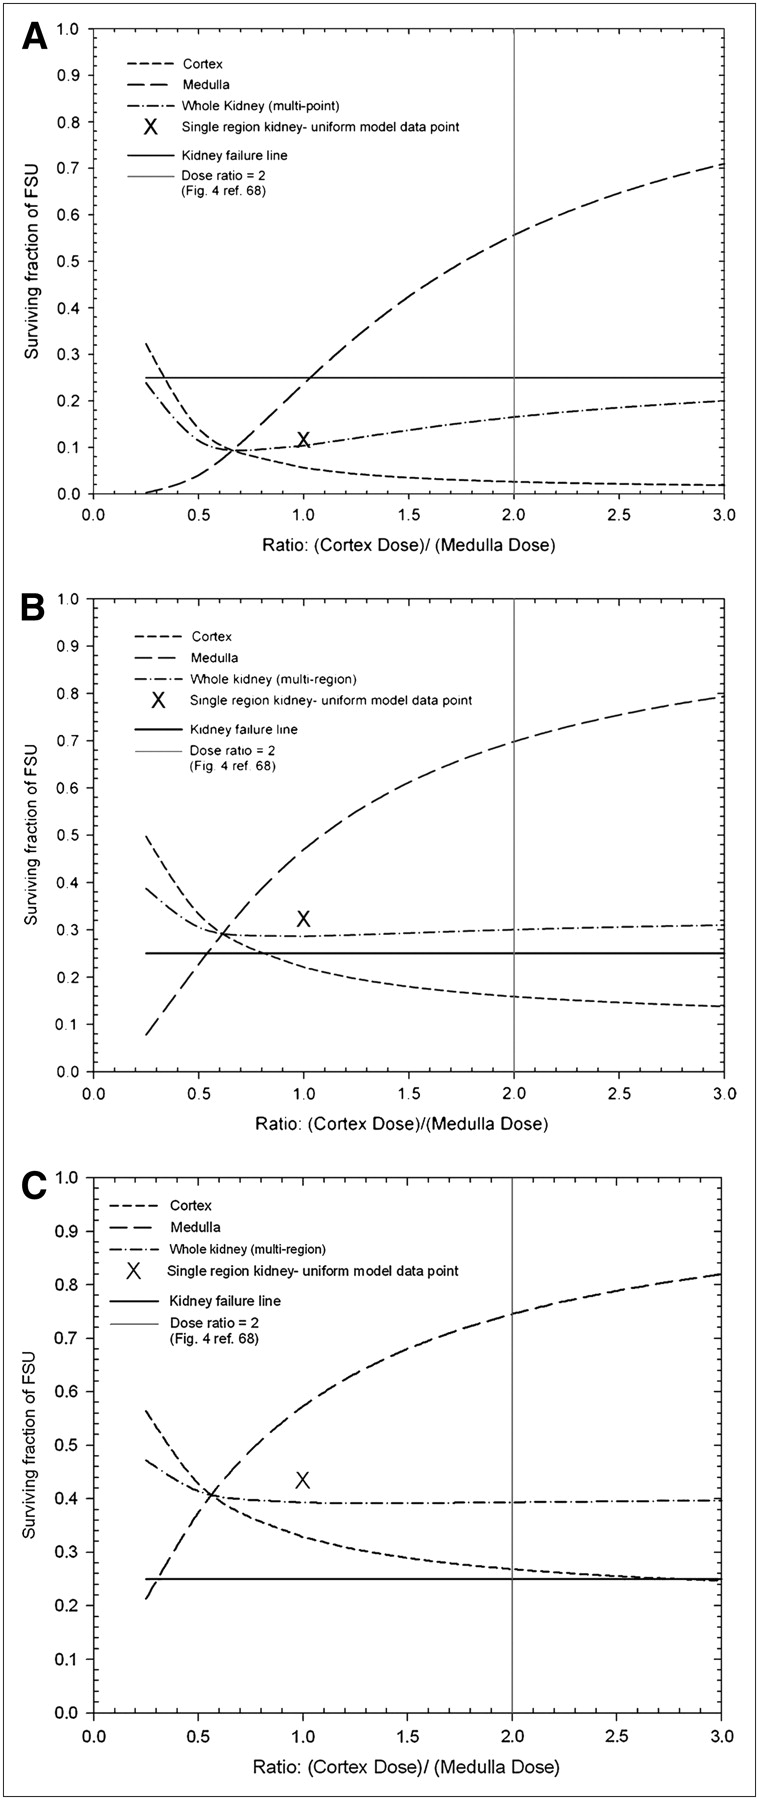
SF of FSU vs. absorbed dose ratio between cortex and medulla for renal cortex, renal medulla, whole-kidney multiregion model, and whole-kidney single-region model based on 15 Gy delivered within 6 h (A), 24 h (B), or 72 h (C) from 131I self-dose contribution to whole kidney. Single-region model can be shown only as single point at cortex-to-medulla absorbed dose ratio of 1.0.
As shown in Figure 1D and by Konijnenberg et al. (66), the absorbed dose nonuniformity in the case of uniform activity distributions of high-energy β-ray emitters such as 90Y is mainly in the outer cortex, as calculated using the MCNP Monte Carlo code. Radiation transport of the long-range β-particles to tissues outside the kidney caused a reduction in the absorbed dose to the outer cortex. The absorbed dose volume histogram for the low-energy β-emitter 177Lu follows closely the human cortex activity distribution, but a build-down region near the outer rim was observed. Animal and human autopsy data have indicated a difference in the size and density of juxtamedullary, midcortically, and outer cortically positioned glomeruli (59–61). The glomeruli were larger in the outer cortex than elsewhere, and the density of glomeruli in the inner cortex was therefore lower near the renal pelvis.
Figures 1A–1C show the dose response of the kidney substructure FSU (cortex) as the dose rate and cellular repair half-time are varied over ranges typically associated with radionuclide therapy and survival-related endpoints. Substantial decreases in survival were a consequence of shorter times for delivering a 15-Gy total absorbed dose when combined with longer half-times for cellular repair. For these examples, we have assumed that if 75% or more of any suborgan target in the kidney loses its function, the function of this component is inactivated. Consequently, because the functional renal cortex and medulla are serial units, the whole kidney will fail if either component ceases to function. Figure 1D shows that the range of particle irradiation contributes to spatial dose nonuniformity.
Example 2: Radiopharmaceutical Spatial Nonuniformity and Dose-Rate Considerations
In this example, the cumulated activity ratio for the cortex and medulla was varied by a fixed amount with respect to time to simulate heterogeneous uptake and clearance in the kidney associated with targeted therapy. Regional SFs were calculated to predict kidney toxicity using Equations 8–10. Variations in the absorbed dose and dose rate ranged over a minimum of an order of magnitude. These selected dose rates were achieved by requiring that the total time of irradiation be completed over a specified period. Parameters for repair half-life, tissue α/β-ratios for the cortex and medulla, were assigned as a single value based on Thames and Hendry (45). The expression for g(T) as shown in Equation 3A was used as a first-order approximation for this example where Teff was substantially longer than Trep (constant low dose rate with an incomplete repair term).
Several assumptions and parameter values were used to calculate the data shown in Figure 2. The volume of the kidney was assumed to equal the sum of the cortex and medulla volume. Hence, percentage volume of cortex = VCor/(VCor + VMed) × 100% = 201.5 g/(201.5 g + 71.7 g) × 100% = 74%, and percentage volume of medulla = 100% – 74% = 26%. The repair half-time was set to 1 h, and total irradiation times of 6, 24, and 72 h for Figures 2A, 2B, and 2C, respectively, were investigated. The kidney was assumed to receive a uniform average absorbed dose of 15 Gy, with specific α- and β-values (αCor = 0.06 Gy−1, αMed = 0.03 Gy−1, and α/β = 2.5 Gy) (45). S values for 131I were taken from MIRD pamphlet no. 19 for self-dose contributions in the region only (in this example and also examples 3 and 4). For the uniform single-region kidney model, an average α of 0.045 and α/β of 2.5 Gy were used for comparative purposes. The vertical solid line indicates an absorbed dose ratio of 2.0 between the cortex and the medulla based on the distribution data from Flynn et al. (67), with resulting dosimetry modeled in Figure 4 of Green et al. (68).
In Figure 2, instantaneous activity uptake was assumed such that the absorbed dose ratio, renal cortex to renal medulla, varied from 0.25 to 3. The fraction of target volume (represented by FSU) surviving for the uniform single-region kidney model, the multicompartment kidney model, and the cortical and medullary regions, separately, was calculated and compared for 3 different irradiation times. An average absorbed dose of 15 Gy delivered to the whole kidney was assumed. Typical single-tissue α/β-tissue ratios and cellular repair half-times were used (45). These plots show that shorter total irradiation times along with increased absorbed dose in a subregion will result in greater potential lethality. This dose-rate effect was also observed in the single-region uniform dose model. Only medullary FSU survival was associated with greater than a 25% functionality threshold when the cortical-to-medullary dose ratio exceeded 1.0 for a short total time of irradiation of 6 h (Fig. 2A). Conversely, for 15 Gy delivered over a 3-d period (Fig. 2C), nearly all regions of the kidney computed by any method were shown to have survival adequate (≥25%) to ensure kidney functionality.
Example 3: Differential Clearance Rate for Multiregion Kidney Model
The analysis thus far has assumed several effective clearance half-times resulting in corresponding constant low dose rates given in specified intervals to deliver 15 Gy to the whole kidney. In this example, the impact of exponentially decaying low dose rate and a differential clearance between the cortex and medulla is examined. The kinetics for these different kidney compartments are based on renal clearance data obtained in rats, reported by Flynn et al. (67), and dose rate data reported by Green et al. (68). The repair half-time (Trep) and tissue α/β-values used are the same as in Example 2.
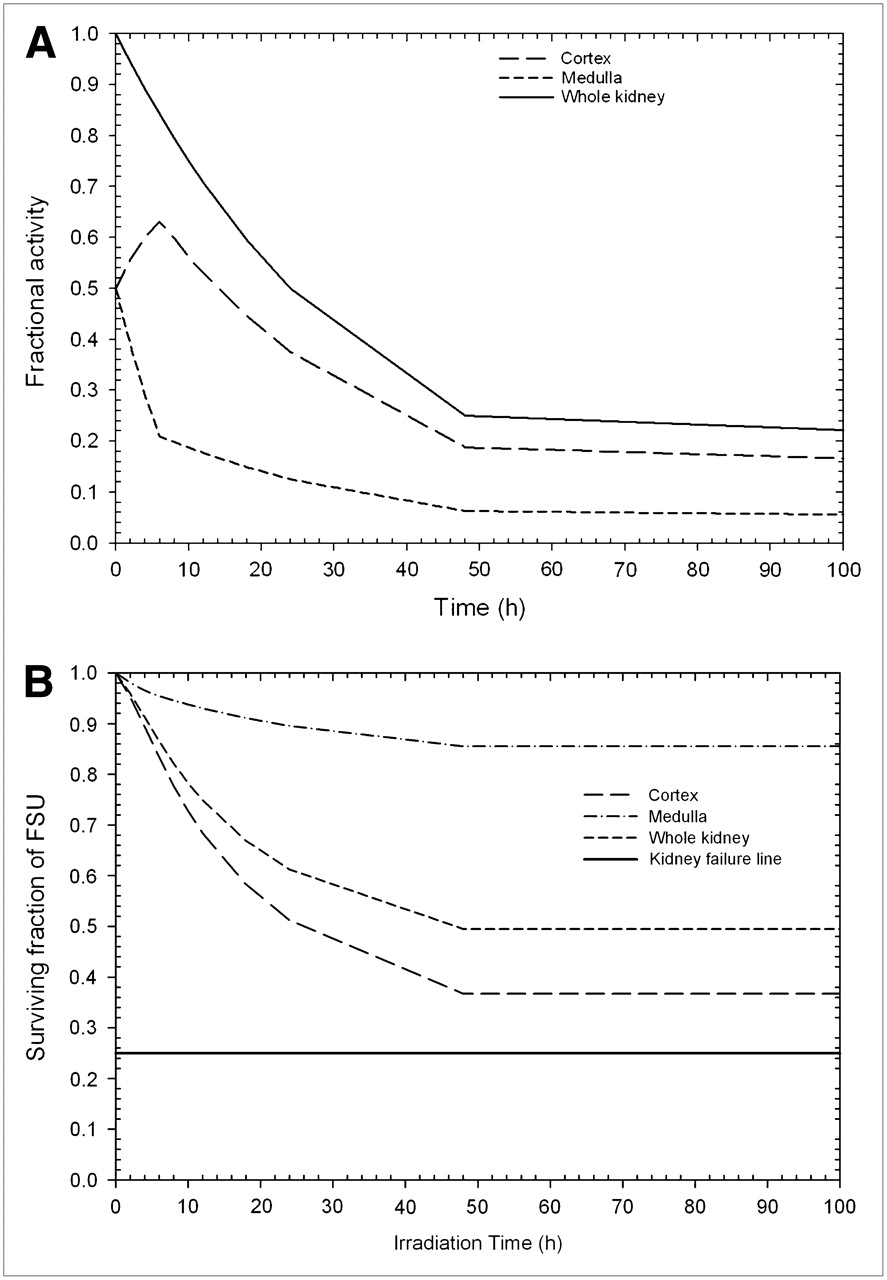
In this example, a relatively short Teff of 4 h is used to deliver a total average dose of 14.4 Gy in 24 h (96% of 15 Gy delivered over 24 h), providing an initial dose rate of approximately 2.5 Gy/h. A defined interval of irradiation was used in this example in consideration that after substantial decay and clearance of the radioactivity, the dose rate may become sufficiently low and not able to offset the potential for repopulation during prolonged irradiation (32). Figure 3A shows a plot of fractional activity in the whole kidney, medulla, and cortex versus time. ACor is defined as the instantaneous activity in the cortex, and AMed as the instantaneous activity in the medulla. Figure 3A uses differential activity clearance data based on the results of Flynn et al. (67). Those data (67) showed that the ratios of counts in the cortex relative to the medulla for F(ab′)2, Fab, and a single-chain fragment antibody in rat kidney ranged between 2 and 3 within several hours. The model boundary conditions for Figure 3A have been set to ACor/AMed = 1.0 at t = 0 and ACor/AMed = 3.0 at t = 6 h, assuming single exponential growth of the ACor/AMed ratio over the interval. The activity distribution at t = 0 has been considered to reach transient equilibrium within minutes after injection (69) and is small compared with the Teff used in the model calculations. After 6 h, the ACor/AMed ratio has been assumed to be constant at 3.0. As expected, the fractional activity remains higher in the cortex than in the medulla at all times except t = 0, and the sum of the cortex and medulla activity is equal to the whole-kidney activity.
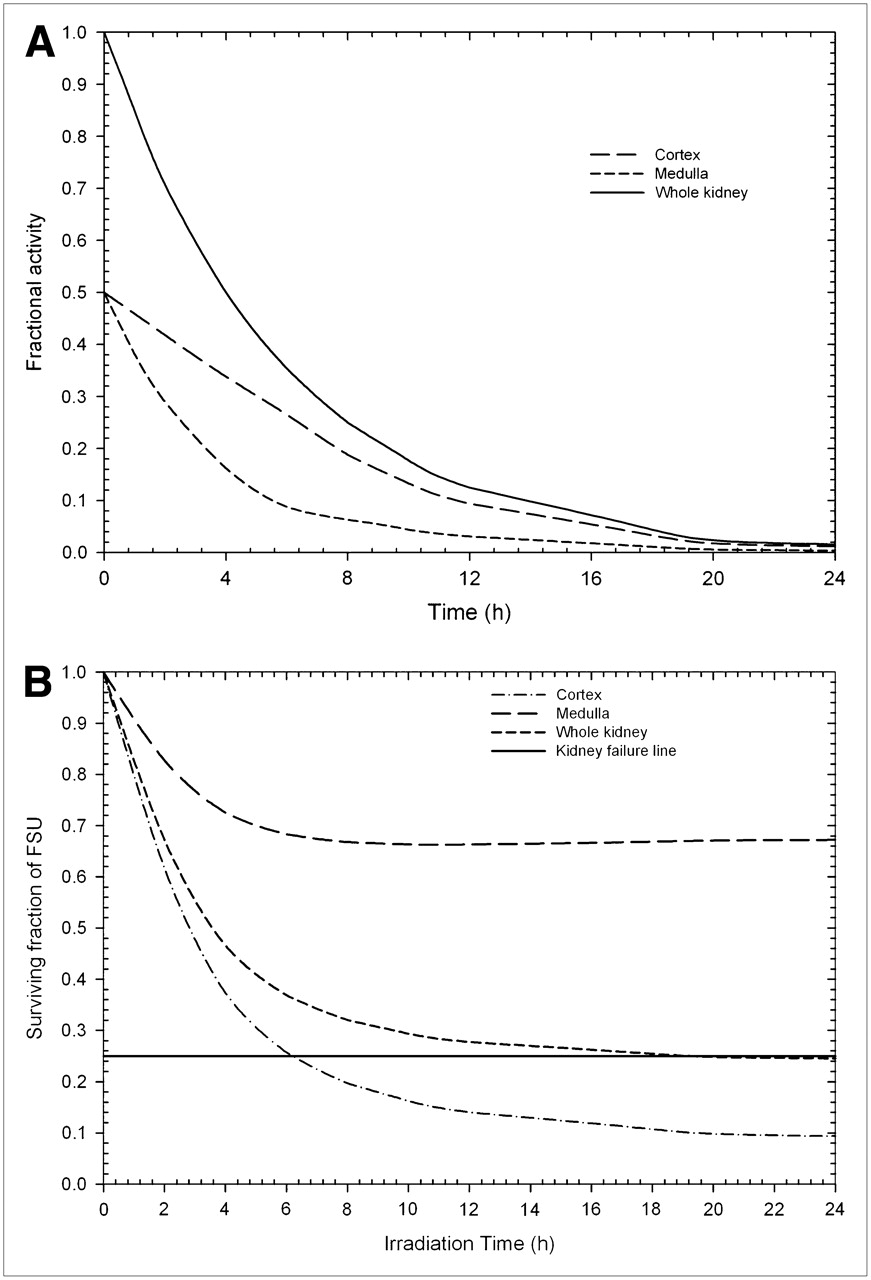
(A) Fractional activity vs. time after injection for cortex and medulla of kidney (Teff = 4 h and ACor/AMed = 3.0 at t = 6 h) used as input data for SF calculations shown in B. (B) For irradiation times greater than 6 and 20 h using self-dose contribution from 131I, cortex SF and whole-kidney SF, respectively, are less than what has been defined as kidney failure line (25% of surviving cells). Irradiated medulla region never falls below minimum SF necessary to sustain function for region.
Equation 3B has been used to reflect the changes in g(T) associated with exponentially decaying dose rate when Equations 8–10 are applied for computing regional FSU survival (Fig. 3B).
Example 4: Differential Uptake and Clearance Rates for Multiregion Kidney Model
Similar to Example 3, the cumulated activity ratio for the cortex and medulla was varied by differential exponential clearance rates by region (cortex and medulla) based on rat clearance data by Flynn et al. (67) with respect to time to show the effect on relative dose to those regions. Parameters for repair half-life, tissue α/β-ratios for the cortex and medulla, were the same as used in Example 2.
In this example, a relatively longer Teff of 24 h was used to deliver a total average dose of 14.4 Gy over a specified time of 100 h (96% of 15 Gy is delivered in 100 h), with initial dose rates of approximately 0.44 Gy/h. Figure 4A shows the plot of fractional activity in the whole kidney, medulla, and cortex versus time. As with the example shown in Figure 3A, Figure 4A also uses the boundary conditions for differential activity clearance based on the rat clearance data of Flynn et al. (67). These idealized boundary conditions have been set at ACor/AMed = 1.0 at t = 0 and ACor/AMed = 3.0 at t = 6 h, assuming single exponential growth of the ACor/AMed ratio over the interval. After 6 h, the ACor/AMed ratio has been assumed to be constant at 3.0.

(A) Fractional activity vs. time after injection for cortex and medulla of kidney (Teff = 24 h and ACor/AMed = 3.0 at t > 6 h) used as input data for SF calculations shown in B. (B) For all irradiation times using self-dose contribution from 131I, cortex, medulla, and whole-kidney SF are greater than what has been defined as kidney failure line (25% of surviving cells). No irradiated region ever falls below minimum SF necessary to sustain function for region or kidney as a whole.
Examples 3 and 4 provide a more clinically relevant activity profile as shown in Figures 3A and 4A. These profiles are based on the boundary condition derived from both animal and human measurements (67,70) and provide for the time variation of activity in the cortical and medullary regions to rise from an initial ratio (cortex to medulla) of 1.0 to a ratio of 3.0 in 6 h. In Figures 3B and 4B, increased dose rate resulting from delivering dose by radionuclide therapy in a shorter time (Fig. 3B: Teff = 4 h) is the primary consideration for increased lethality, as compared with nonuniformity in uptake, for these examples. Furthermore, the potential for increased lethality would be accentuated when activity heterogeneity is introduced in the presumed radiobiologically sensitive target.
CORRELATION OF MODEL PREDICTIONS WITH CLINICAL RESPONSE
Renal failure from nephrotoxicity associated with radionuclide therapy (71) has been recognized as an important clinical event (4–7). This toxicity has been reported as both acute and chronic. Typically, acute effects appear several weeks to months after exposure as a decrease in creatinine clearance. Chronic kidney toxicity may present as an increased level of serum creatinine that does not return toward normal. A mildly elevated serum creatinine level may persist, or renal function may gradually deteriorate and eventually require dialysis. Deaths from toxicity associated with radionuclide therapy have been reported. Biopsies have demonstrated histologic findings of thrombotic microangiopathy similar to the findings of nephropathy in kidneys in the treatment field of external-beam radiation.
Because even the acute effects take several weeks or longer to become apparent, hundreds of patients were exposed to potentially toxic doses of radionuclide therapeutic agents before the toxic effects were appreciated. Many of these patients were enrolled in phase 1 or 2 clinical therapy trials that documented the severity of the toxicity and the corresponding kidney dose estimates. Hence, a significant amount of dose–response data is now available in the radionuclide therapy literature. A brief review of patient data for several of the major clinical trials in terms of accrual (over 700 patients) follows.
Cumulative clinical experience by investigators with 90Y-tetraazacyclododecanetetraacetic acid (DOTA)-octreotide in the group from Basel consists of a pilot clinical trial with 29 patients (71), 2 phase 2 clinical studies including 41 patients (72) and 39 patients (73) with neuroendocrine tumors, and a study on 20 patients with medullary thyroid cancer (74). In the initial studies, the investigators reported early renal insufficiency in 4 patients and 2 additional patients in whom coadministration of amino acids for renal protection was not used. These patients received a cumulative activity of more than 7.4 GBq of 90Y-DOTA-octreotide per square meter given in up to 4 administrations. In their later studies, which were always performed with amino acids, only a single patient was reported to have grade 2 renal toxicity (74).
A retrospective study of patient-specific kidney dosimetry for 18 patients in a phase I multicenter trial of 90Y-DOTA-Tyr3-octreotide was performed by Barone et al. (75). The study was originally designed to give the patients a maximum absorbed dose of 27 Gy to the kidneys. The activity escalation was aimed at a maximum dose per cycle to the target while limiting the total kidney dose to 27 Gy. Some patients were given additional cycles of therapy. Patient-specific kinetics of kidney uptake and clearance were determined by quantitative PET of the positron-emitting analog 86Y DOTA-Tyr3-octreotide at 3.5, 24, and 48 h after injection. To reduce uptake of the peptide in the kidneys, an infusion of amino acids was started 0.5 h before injection of the compound and continued for 4 h after injection. The kidney absorbed dose was calculated according to the MIRD schema by using the sex-appropriate phantom in MIRDOSE3 and the kidney residence time for 90Y. This study showed no correlation between the MIRD-based kidney absorbed dose and the decrease in serum creatinine clearance, which was monitored regularly. The dosimetry was made more patient-specific by adjusting the computed absorbed dose to the kidney using the CT-derived volumes instead of uncorrected values obtained from phantoms. On average, the specific kidney volumes were larger than the stylized MIRD kidney volume. The volume-corrected kidney dose correlated better with the decrease in creatinine clearance. A stronger correlation was also observed when applying the LQ model–based BED, compared with using absorbed dose alone. By using the BED methodology, one can account for differences in the delivery of dose to the kidney by relatively high or low dose-rate radiation from either external-beam or radionuclide therapy.
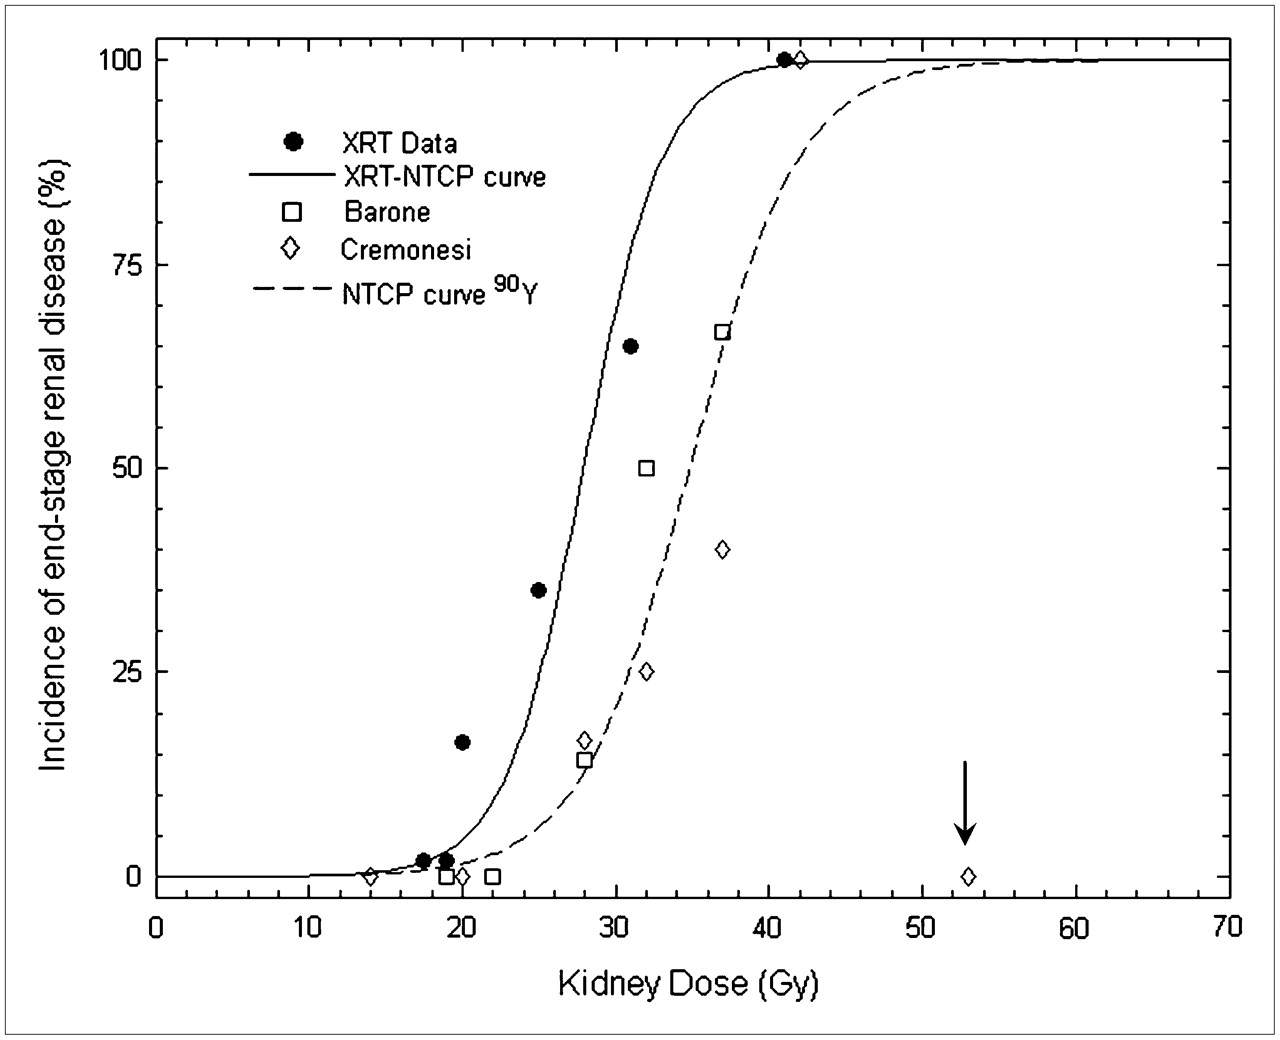
A further advantage of using the BED is that the dose–effect relationship for kidney damage after 90Y-DOTA-octreotide therapy can be compared with the classic dose–effect relationship for radiation nephropathy after external-beam radiotherapy. A statistically significant approach has been applied by observing the proportion of patients per dose interval in whom nephropathy develops. A decline in creatinine clearance of more than 20% per year over 5 y has been used to indicate end-stage renal disease (75). The dose–response curve for external-beam therapy shows an approximate threshold at 15 Gy, whereas for 90Y radionuclide therapy, the threshold has been shifted to 20 Gy (Fig. 5).

Dose–response curve for symptomatic radiation nephropathy after external-beam radiotherapy. Curve for normal-tissue complication probabilities based on external-beam radiotherapy data (26) is fitted with TD50 = 28 Gy and at slope of m = 0.15 through external-beam radiotherapy data with statistically significant Pearson score of r = 0.98. External-beam radiotherapy data are based on experience with approximately 300 patients with 120 cases of radiation nephropathy (24); each entry in graph represents at least 10 patients. Absorbed dose per fraction, sample size, and definition of end-stage renal disease varied for external-beam radiotherapy data per Cassady (24) and as indicated in original citations. Clinical data for renal damage after therapy with 90Y-DOTA-octreotide from Barone et al. (75) (n = 18) and Bodei et al. (76) (n = 25) were added to generate second (normal-tissue complication probabilities) 90Y curve. Minimum decline of 20% per year in creatinine clearance has been used to indicate end-stage renal disease within 5 y (75). This curve was fitted through 90Y data with TD50 = 35 Gy and m = 0.18 and Pearson score of r = 0.90. Each 90Y data entry represents at least 3 patients, except entry at 19 Gy (Barone et al.), 20 Gy, and 53 Gy (Bodei et al.), which are single patients. Data from Bodei et al. at 53 Gy (arrow) with just 13% rate of creatinine clearance loss per year were considered to be outlier (n = 1). 90Y-DOTA-octreotide therapy data were obtained with various dosing schemes compared with external-beam radiotherapy reference conditions of dose uniformity and 2 Gy per fraction (75,77).
Renal toxicity was evaluated in 25 patients by Bodei et al. (76) after peptide receptor radiation therapy (PRRT) with 90Y-DOTATOC or 177Lu-DOTATATE-octreotide. The patients were enrolled in several clinical phase I–II protocols. From 1997 to 2002, 256 patients received treatment with these radiolabeled peptides. Renal toxicity evaluation used creatinine clearance and creatinine toxicity grade as surrogate endpoints. Multiple administrations (2–9 cycles) separated by 1–3 mo were given to a variety of patients with neuroendocrine tumors. BED, instead of absorbed dose, was considered for possible correlation with renal damage, according to Barone et al. (75). BED values for the kidneys were calculated according to the LQ model, with α/β = 2.5 Gy, Trep = 2.8 h, and Teff = 42 h.
In Figure 6, Bodei data (76) show that 1 patient of 9 with a BED to the kidneys in the 30- to 40-Gy interval who received 2–4 cycles of PRRT and 5 patients of 8 with a BED in the 40- to 50-Gy interval who received 5 or more cycles had a higher loss in creatinine clearance (>20%/y over 5 y after treatment). Grade I serum creatinine toxicity was observed in 6 patients with a BED to the kidneys over 40 Gy, and grade II creatinine toxicity was observed in 1 patient with a BED greater than 55 Gy. A greater number of cycles with an associated higher total BED appeared to manifest as greater toxicity. Concomitant risk factors seem to be associated with a greater loss of creatinine clearance. One patient with a BED of 67 Gy (RE = 1.25) showed a moderate decrease in creatinine clearance of 13%/y, as shown in Figures 5 and 6 as zero toxicity (statistical outlier) since the threshold of toxicity for these figures was taken to be a creatinine clearance loss of more than 20%/y over 5 y.

Dose–response curve for correlation between kidney BED and symptomatic radiation damage to kidneys for external-beam data, compared with 90Y-DOTA-octreotide data.
Figure 6 combines the results of both Barone et al. (75) and Bodei et al. (76) into a single set of data (dashed line) in which the fitting of a new line for normal-tissue complication probabilities yields a kidney TD50/5 (1) of 44 Gy for PRRT BED versus renal damage (m = 0.12, r = 0.99). Each 90Y data point represents at least 3 patients within 10-Gy BED intervals, except that the entry at a BED of 28 Gy from Barone has been based on 2 patients. In the data from Bodei, the 22-Gy point has been based on 2 patients, and both the 55-Gy and the 67-Gy points are based on single patients only. The arrow highlights the data from Bodei at 67 Gy, which were not included in the fit and were considered a curve fit outlier as per Figure 5. The BED data associated with external-beam radiotherapy kidney nephropathy (24,26,77) have been replotted for reference (solid line) where the kidney TD50 has also been shown to be 44 Gy. Uncertainties (error bars) associated with the data points presented in Figures 5 and 6 vary widely since these graphs were a compilation of data from nearly a dozen sources over the past 30 y. External-beam radiotherapy data have standard errors in the 5%−10% range where the PRRT data uncertainties ranged from 10% to 25% for entries based on 3 or more patients.
By calculating the BED for each external-beam data point with α/β = 2.5 Gy, the BED data for PRRT radiotherapy (75,78) fit in well with the external-beam radiotherapy–NCTP curve. Because the BED accounts for differences in administration schemes, a steeper dose–effect curve can be fitted through the data. The threshold for kidney radiation damage is approximately a BED of 33 Gy, although none of the 3 patients receiving 90Y-DOTA-octreotide therapy (67) with a BED of 41 Gy show high creatinine clearance loss.
Breitz et al. (10,79) reported on the dosimetry and kidney toxicity from skeleton-targeted radiotherapy using a β-emitting radiophosphonate, 166Ho-1,4,7,10-tetraazacyclododecane-1,4,7,10-tetramethylene-phosphonic acid (DOTMP). Two phase I/II studies were performed to determine the maximum tolerated dose of 166Ho-DOTMP in combination with high-dose chemotherapy with and without total-body irradiation as a preparative regimen for peripheral blood stem cell transplantation in patients with multiple myeloma (10). Adverse events consistent with radiation toxicity on the genitourinary system (kidney and bladder) presented as a late effect in the phase I studies. Kidney toxicity presented as a permanent increase in serum creatinine (≥grade 2 or greater than 3 times the upper limit of normal) in approximately one third of patients (33/95 patients), and thrombotic microangiopathy was confirmed by biopsy in 5 patients. With 5 y of follow-up, 18 patients treated at the highest doses had received dialysis. This toxicity occurred in the setting of improved response rate and overall survival compared with treatment of similar patients without the addition of 166Ho-DOTMP (80). The kidney absorbed dose estimates ranged from 0.5 to 7.9 Gy for administered activities of 166Ho-DOTMP between 12.4 and 126.2 GBq (using the International Commission on Radiation Protection [ICRP] 53 model based on the whole-body clearance method to estimate kidney dose) (10,67). There was a significant relationship of renal toxicity with administered dose and with kidney radiation absorbed dose, although the estimates of kidney absorbed dose were surprisingly low considering the degree of renal toxicity. A third study focused on improving the accuracy of the radiation absorbed dose estimates, particularly to the kidneys, because of unexpected radiation nephropathy (based on absorbed dose estimates) that occurred at the higher administered activities in the phase I studies. Twelve patients were evaluated at lower therapeutic administered activities, receiving 2 tracer administrations of radiopharmaceutical 1 wk apart before therapy to evaluate intrapatient consistency. Clearance of the radioactivity that was not bound to bone surfaces was relatively rapid; 70% of the activity was cleared in the first 12 h (81). Thus, a dose-rate effect could have contributed to the toxicity.
For patients receiving administered activities ranging from 38 to 67 GBq, the estimates of absorbed dose to the kidney varied from 1.6 to 4.0 Gy using the ICRP 53 model (69) and from 8.3 to 17.3 Gy using a scintillation camera imaging method based on quantitation of 166Ho in the kidneys. The latter method resulted in high interpatient variability that the authors ascribed to technical problems in the imaging process. These problems included accommodating the complex spectrum of 166Ho, poor camera counting statistics, and high scatter contamination that resulted in high interpatient variability (10,81). BED estimates using the absorbed dose to the kidney reported using the ICRP 53 model (69) (5–7.5 Gy) were somewhat higher (6.5–9.8 Gy) using an RE of 1.3, but substantially less than the corresponding BED threshold for kidney toxicity of 30 Gy calculated by Barone et al. (75). If the dosimetry was derived from the results of the region-of-interest–based scintillation camera method, the initial dose rate, RE, and correspondingly the resultant BED would be substantially increased to the range that Barone reported (75) for clinical kidney toxicity.
The low dose estimates from the ICRP 53 model (69) appeared inconsistent with radiation nephropathy. However, multiple myeloma is a challenging disease on which to draw conclusions on the correlation of kidney absorbed dose and toxicity, because the kidneys are often damaged by the disease and therefore more susceptible to toxicity. Contrast agents are not administered for CT scans in this patient population because of the potentially compromised status of the kidneys. The authors concluded that higher administered activities were associated with the observed kidney toxicity, supporting radiation as the primary cause as confirmed by the histologic findings on kidney biopsy in 5 of the patients. This confirmation led the investigators to use lower administered activities of this radiopharmaceutical in subsequently treated patients.
If one were to extrapolate the RE for data presented by Breitz et al. (10) based on the toxicity observed using an estimated absorbed dose of 7.5–15 Gy to the kidney for those patients receiving over 55.5 GBq/m2, the RE would be on the order of 3.0, where REs for low–dose-rate PRRT studies (70–76) are computed in the range of 1.1–1.8 per the example cited in Wessels (82) based on dose-rate considerations alone. A comparison of the relevant observations is illustrated in Table 2.
Comparisons of Absorbed Doses and Dose Rates to Kidneys with Radionuclide Therapies
Table 2 compares the absorbed doses and dose rates to the kidneys with radionuclide therapies based on information available or estimated from published work (10,70–72,75,79–81) and the threshold doses for external-beam radiotherapy, either locally (11) or from total-body irradiation used as a part of the conditioning regimen for bone marrow transplantation (30,77). The range of values for the absorbed doses computed for the kidney and the resultant initial dose rates, the RE and BED values shown in Table 2, for the 166Ho trials were based on using a range of administered activities up to a maximum of 167 GBq (10) and applying the 2 dosimetry methods reported (79–81).
In a review of the dosimetry and toxicity data associated with PRRT, Cremonesi et al. (83) highlighted the impact that kidney toxicity has played in designing strategies for more effective delivery of tumor doses. Clearing agents, patient-specific CT kidney volumetrics, and maximum dose-rate reduction through multiple-dose administration have played an important role in elimination of kidney toxicity after PRRT. Cremonesi et al. also found that the patients who had a high computed BED after PRRT and an increase of serious kidney toxicity were those who received a relatively few high-dose repeated administrations. These findings were consistent with other reports (71,84,85) suggesting that reductions in initial dose rate from a high number of multiple administrations (cycles) and, whenever possible, prolonged administration of renal protectors for reduction of kidney uptake improves the repair rate for irradiated kidney tissues. Such strategies of increasing the number of fractions and reducing fraction size or dose rate to an equivalent tumor BED are entirely consistent with the successful experience of total-body irradiation for transplant conditioning regimens when lung toxicity was a dose-limiting problem (86,87). In the total-body irradiation example, 9 Gy in 1 treatment was reduced to 1.5 Gy in each of 9 treatments (administered twice per day over 5 d). The BED dose delivered to the bone marrow was the same in both cases, taking advantage of the reduced α/β-ratio of lung compared with that of bone marrow.
DISCUSSION
Modeling Calculations
Examples 1 through 4 illustrate the importance of dose rate in renal toxicity from targeted radionuclide therapy. Both initial dose rate, as determined by the administered activity, and the pattern of dose-rate variation associated with uptake and clearance of a radionuclide are significant factors in determining the resulting kidney toxicity. This is illustrated in Figure 2, where a decrease in dose rate or a corresponding increase in Teff of the radiopharmaceutical from 6 to 72 h results in a lower potential for kidney toxicity at the longer irradiation times for a fixed total absorbed dose delivered. The uniform single-region kidney dose model shown in Figure 2 demonstrates that dose rate is an important first-order effect in determining SF. Second, when region-specific variations in absorbed dose to the kidney are considered, the FSU SF associated with these regions can theoretically predict the viability of the whole organ. Namely, Figure 2B shows that for 15 Gy delivered in 24 h calculated by the uniform single-region method, FSU survival for the organ exceeds the 25% assumed kidney failure line. However, if the dose is separately calculated to the cortical or medullary subregions using the MIRD pamphlet no. 19 multicompartmental model, cortical FSU SF falls below the kidney failure line for ratios of cortex to medulla dose deposition in excess of 1.0. Even though the medullary FSU SF is above the kidney failure line for these ratios, the entire organ is predicted to fail on the basis of inability of the cortical region to function. This finding is potentially significant in predicting kidney toxicity based on an FSU analysis if regional concentration data are available and subregion-specific α/β-ratios are assumed to be the same as the nominal value used for the whole kidney (45).
Implications for Clinical Trial Design
Theoretic results based on dose and dose-rate considerations agree with clinical reports of kidney toxicity (4–10). A reduction in toxicity has also been associated with changes in uptake and clearance with the introduction of blocking or clearing agents for PRRT (83–85). Specifically, PRRT and 166Ho radiopharmaceuticals with a Teff of less than 6 h in the kidney have been both theoretically and clinically shown to be toxic if the initial administration of activity is in the range of 50 GBq (10,79–81). The initial absorbed dose limits considered in those trials were based on limits established for external-beam experience and did not account for the apparent high dose rate associated with high administered activities. In fact, toxicities have been observed in the 5- to 10-GBq range for PRRT patients receiving radiopharmaceuticals without clearing agents (83). These toxicities reported in early trials (4–6,8,71) were also thought to be dependent on the nonuniform distribution of activity retained and cleared by the kidneys (67,68). The investigators concluded that their clinical findings and human ex vivo autoradiographs showed that average dose calculations using the simplified MIRD schema, assuming uniform renal radioactivity clearance, were inadequate to estimate radiation absorbed dose to various parts of the kidney after PRRT. Hence, a key component to example 2 hinges on the use of the MIRD pamphlet no. 19 kidney model (3) to compute suborgan dosimetry at a variety of relative concentration ratios for 2 important components (cortical and medullary regions) that were shown to have markedly nonuniform uptake patterns in both the animal and the human autoradiographic data (63,64,67). In the model examples shown here, the effects of both regional nonuniformity and dose rate are shown to have increased deleterious effects in terms of toxicity. The model also shows the circumstances (high nonuniformity and high dose rate) that lead to dose-limiting toxicity. To this end, examples 3 and 4 are first-order attempts at improving the model calculations to more closely match clinical, imaging, and autoradiographic data by introducing a differential clearance between subregions with a shorter Teff (example 3) and a longer Teff (example 4). The clinical boundary conditions of high dose rate in subregions that have the highest concentration of activity, the smaller Teff, and greater assumed radiosensitivity show a corresponding decrease in the expected survival of FSUs associated with that region. Higher toxicity for the whole kidney would result from any decrease in regional survival since the regions are serially dependent on each other for organ function.
The clinical data presented here suggest a strong correlation between increasing activity administered to patients and the potential for both early and late kidney toxicity. Through the use of the BED concept, analysis also shows a significant correlation between increased toxicity and high BED values for many of the studies cited here. RE values calculated for the peptide clinical studies for kidney dose appear to agree with external-beam experience. Although difficulties with the dosimetric analysis provide a wide-ranging estimate for the RE values (1.3–4.0) with 166Ho work, dose estimates derived from the toxicity observed in a statistically significant number of patients leads one to conclude that the high initial dose rate associated with high administered activities could be in the range of several grays per hour.
This conclusion supports caution in the design of clinical trials for radionuclide therapy, especially if the administered activity is relatively high (in excess of 50 GBq/administration) or the potential for selective targeting of suborgan radiation-sensitive components is detected by imaging or other means. A BED analysis of the absolute absorbed dose and initial dose rate to each critical organ from the radionuclide therapy regimen should be computed and compared with the equivalent 2 Gy/fraction external-beam toxicity limit (11). There is a clear need, especially in the case of the high absorbed dose and high–dose-rate exposures from 166Ho, to obtain quantitative 3-dimensional data on the radionuclide as it transits the kidney.
Future Directions in Quantitative Imaging
New methods of determining dynamic suborgan clearance are needed to compute accurate histograms of regional absorbed dose volume. Tomographic quantitative imaging of the kidneys using dynamic SPECT has improved spatial and temporal resolution (88,89). Even faster transits through the heart have been imaged using the same technology (90). Two meetings of international working groups have focused on these imaging and display tasks. One approach uses one or more scintillation cameras rotating slowly around the subject with the kidney and bladder in the field of view (89,90). Another approach uses multipinhole aperture plates mounted on stationary or rotating scintillation cameras to recreate the dynamic transits through the kidney (91–93). Scintillation cameras with slip-ring gantries support continual rotation that allows the collection, binning, and reconstruction of data, keeping up with the wide distribution of physiologic transits needed for dosimetry calculations. For dosimetry of short–half-life tracers that are cleared by the kidney, early clearance in the first 10 min is important as noted in the case of 166Ho. In such instances, a series of 1-min rotations followed by a series of slower rotations would permit more accurate dose and dose-rate calculations. The selection of imaging intervals should be based on data densities, expected transit times leading to more accurate reconstructed voxel-based images, and improved patient-specific regional dose estimates. Physical and mathematic phantoms have been proposed and used for calibration and to establish the validity of numeric data used in dosimetry calculations (93–95). New tools for dosimetric and radiobiologic modeling have become available using GEANT4 for suborgan regional dosimetry (96). 86Y-DOTA-TYR3-octreotide PET has identified the preferential localization of activity in the renal cortex (75). In addition, 4-dimensional imaging is anticipated to provide critical suborgan time–activity information to better correlate calculated regional dose and observed clinical renal toxicity.
CONCLUSION
Absorbed dose computed from a uniform distribution of activity in the kidney using standard reference phantoms without regard to the dose rate and spatial nonuniformities will not provide meaningful dose–response correlations.
In clinical trials involving nearly 1,000 patients receiving radionuclide peptide or small-molecule therapy, a significant number of patients experienced renal toxicity. Renal uptake and clearance of large amounts of therapeutic activity was observed in these patients and resulted in their presenting with both acute and late kidney toxicity. This toxicity has decreased in recent years as investigators have altered delivery by using fractionated administrations, have limited the absolute amount of administered activity given in 1 fraction, and have added clearing agents to the treatment regimen.
Improved methods of collecting data can provide the dose estimates needed for radiobiologic model predictions based on absorbed dose to the different kidney regions, taking into account nonuniformity in spatial and temporal dose, dose rate, and repair processes. Calculations using patient-specific measurement of kidney mass in combination with the LQ model and the associated BED concept have improved the correlation between radionuclide therapy toxicity and external-beam experience.
Model applications shown in our examples highlight potential scenarios where toxicity may be predicted and avoided. These include high initial and average dose rates for a short-lived radiopharmaceutical that is observed to localize and be retained in radiosensitive portions of the kidney.
The demonstration that a dose–response curve for radionuclide therapy may correlate with well-established external-beam data suggests that this type of analysis may guide the investigator in determining the safe maximum regional absorbed dose and resulting BED for proposed clinical trials.
Acknowledgments
We thank Yuxia Zhang, Yiran Zheng, and Charles Rhodes for assistance in performing calculations, generating the figures, and providing editorial comments. We also appreciate and gratefully acknowledge the many hours of fruitful discussion and review that the MIRD Committee of the SNM has provided during the genesis and development of the manuscript. Special thanks are extended to Dr. Ellen Yorke for her expert comments on developing key elements for the presentation on FSUs and normal-tissue complication probabilities.
Footnotes
-
↵* In collaboration with the MIRD Committee of the SNM: Stephen R. Thomas (Chair), Wesley E. Bolch, A. Bertrand Brill, Darrell R. Fisher, Ruby F. Meredith, George Sgouros, Barry W. Wessels (Task Group Leader), and Pat B. Zanzonico
-
COPYRIGHT © 2008 by the Society of Nuclear Medicine, Inc.
References
- 1.↵
- 2.↵
- 3.↵
- 4.↵
- 5.
- 6.↵
- 7.↵
- 8.↵
- 9.
- 10.↵
- 11.↵
- 12.
- 13.
- 14.
- 15.
- 16.
- 17.
- 18.
- 19.
- 20.
- 21.
- 22.
- 23.
- 24.↵
- 25.↵
- 26.↵
- 27.↵
- 28.↵
- 29.↵
- 30.↵
- 31.↵
- 32.↵
- 33.
- 34.
- 35.↵
- 36.
- 37.
- 38.
- 39.
- 40.
- 41.
- 42.↵
- 43.↵
- 44.↵
- 45.↵
- 46.↵
- 47.
- 48.↵
- 49.↵
- 50.↵
- 51.↵
- 52.↵
- 53.↵
- 54.↵
- 55.↵
- 56.↵
- 57.↵
- 58.↵
- 59.↵
- 60.
- 61.↵
- 62.↵
- 63.↵
- 64.↵
- 65.↵
- 66.↵
- 67.↵
- 68.↵
- 69.↵
- 70.↵
- 71.↵
- 72.↵
- 73.↵
- 74.↵
- 75.↵
- 76.↵
- 77.↵
- 78.↵
- 79.↵
- 80.↵
- 81.↵
- 82.↵
- 83.↵
- 84.↵
- 85.↵
- 86.↵
- 87.↵
- 88.↵
- 89.↵
- 90.↵
- 91.↵
- 92.
- 93.↵
- 94.
- 95.↵
- 96.↵
- Received for publication April 8, 2008.
- Accepted for publication July 24, 2008.


Jump to section
Related Articles
Cited By...
- The MIRD Schema for Radiopharmaceutical Dosimetry: A Review
- Rethinking Dosimetry: The Perils of Extrapolated External-Beam Radiotherapy Constraints to Radionuclide Therapy
- Quality Assurance Considerations in Radiopharmaceutical Therapy Dosimetry Using PLANETDose: An International Atomic Energy Agency Study
- Lesion Dosimetry for [177Lu]Lu-PSMA-617 Radiopharmaceutical Therapy Combined with Stereotactic Body Radiotherapy in Patients with Oligometastatic Castration-Sensitive Prostate Cancer
- A Realistic Multiregion Mouse Kidney Dosimetry Model to Support the Preclinical Evaluation of Potential Nephrotoxicity of Radiopharmaceutical Therapy
- Normal-Tissue Tolerance to Radiopharmaceutical Therapies, the Knowns and the Unknowns
- Reimbursement Approaches for Radiopharmaceutical Dosimetry: Current Status and Future Opportunities
- The Relevance of Dosimetry in Precision Medicine
- Individualized Dosimetry for Theranostics: Necessary, Nice to Have, or Counterproductive?
- Individualized Dosimetry of Kidney and Bone Marrow in Patients Undergoing 177Lu-DOTA-Octreotate Treatment
- MIRD Pamphlet No. 23: Quantitative SPECT for Patient-Specific 3-Dimensional Dosimetry in Internal Radionuclide Therapy
- RADAR Commentary: Evolution and Current Status of Dosimetry in Nuclear Medicine
- 4-Step Renal Dosimetry Dependent on Cortex Geometry Applied to 90Y Peptide Receptor Radiotherapy: Evaluation Using a Fillable Kidney Phantom Imaged by 90Y PET
- Dynamic and Static Small-Animal SPECT in Rats for Monitoring Renal Function After 177Lu-Labeled Tyr3-Octreotate Radionuclide Therapy
- Renal Toxicity of Radiolabeled Peptides and Antibody Fragments: Mechanisms, Impact on Radionuclide Therapy, and Strategies for Prevention
- Arterial Wall Dosimetry for Non-Hodgkin Lymphoma Patients Treated with Radioimmunotherapy