

Visual Abstract

Abstract
In lung cancer patients, radiotherapy is associated with a increased risk of local relapse (LR) when compared with surgery but with a preferable toxicity profile. The KEAP1/NFE2L2 mutational status (MutKEAP1/NFE2L2) is significantly correlated with LR in patients treated with radiotherapy but is rarely available. Prediction of MutKEAP1/NFE2L2 with noninvasive modalities could help to further personalize each therapeutic strategy. Methods: Based on a public cohort of 770 patients, model RNA (M-RNA) was first developed using continuous gene expression levels to predict MutKEAP1/NFE2L2, resulting in a binary output. The model PET/CT (M-PET/CT) was then built to predict M-RNA binary output using PET/CT-extracted radiomics features. M-PET/CT was validated on an external cohort of 151 patients treated with curative volumetric modulated arc radiotherapy. Each model was built, internally validated, and evaluated on a separate cohort using a multilayer perceptron network approach. Results: The M-RNA resulted in a C statistic of 0.82 in the testing cohort. With a training cohort of 101 patients, the retained M-PET/CT resulted in an area under the curve of 0.90 (P < 0.001). With a probability threshold of 20% applied to the testing cohort, M-PET/CT achieved a C statistic of 0.7. The same radiomics model was validated on the volumetric modulated arc radiotherapy cohort as patients were significantly stratified on the basis of their risk of LR with a hazard ratio of 2.61 (P = 0.02). Conclusion: Our approach enables the prediction of MutKEAP1/NFE2L2 using PET/CT-extracted radiomics features and efficiently classifies patients at risk of LR in an external cohort treated with radiotherapy.
- radiation sensitivity
- KEAP1/NFE2L2
- PET
- lung cancer
- radiomics
Radiotherapy is a major treatment option for localized lung cancer (1). Depending on the clinical setting, radiotherapy can be delivered alone or in combination with systemic treatments such as chemotherapy, immunotherapy, or other drugs (1). Fractionation and dose prescription are tailored for each patient depending on the histology and the tumor stage. For patients with locally advanced non–small cell lung cancer (NSCLC) who cannot undergo surgery, chemoradiotherapy followed by durvalumab is the preferred option (2,3). For patients with stage I NSCLC, stereotactic radiotherapy challenges surgery as the upfront treatment (4–6). Radiotherapy requires an extensive staging with 18F-FDG PET/CT (7). Local relapse (LR) rates slightly differ after the 2 treatment options, with a higher LR rate in patients treated with radiotherapy than in those treated with surgery (8). The KEAP1/NFE2L2 pathway regulates the response to radiotherapy with several involvements in the oxidative cascade (9–12). Patients who harbored a mutation in the KEAP1 or NFE2L2 gene are more likely to present a postradiotherapy LR than patients who are mutation-naïve (13,14). Establishing the mutational status could thus have a substantial therapeutic impact, with some patients being possibly recommended for surgery rather than radiotherapy when a mutation is found. When surgery is not feasible, dose escalation or radiosensitization through systemic agents could be an option. Results could even be extrapolated to patients treated with immunotherapy or chemotherapy, as KEAP1/NFE2L2 mutations are also associated with response to systemic treatments (15,16).
KEAP1/NFE2L2 mutations are not part of the usual tested biomarkers for lung cancer. Noninvasive assessment of the KEAP1/NFE2L2 mutational status (MutKEAP1/NFE2L2) could have the same impact as genetic sequencing but with added advantages such as early diagnosis, decreased costs, and eventual longitudinal monitoring for a more accurate follow-up.
Radiomics features are statistical, geometric, or textural metrics designed to provide quantitative measurements of intensity, shape, or heterogeneity of a given volume of interest in medical images and have been a great field of interest for several years. Radiomics are thought to noninvasively apprehend intratumoral heterogeneity and fully characterize a tumor and were previously used for the prediction of biomarkers such as a mutation in the epidermal growth factor (17). To our knowledge, it was never used for the prediction of KEAP1/NFE2L2 mutations.
The aim of this study was to develop and externally validate a PET/CT-based radiomics model for the prediction of MutKEAP1/NFE2L2.
MATERIALS AND METHODS
Population
Our goal was to develop a prediction model for MutKEAP1/NFE2L2 using only PET/CT features. Of the 1,374 available patients in the cohorts of The Cancer Genome Atlas–Lung Squamous Cell Carcinoma (18) (n = 522), The Cancer Genome Atlas–Lung Adenocarcinoma (19) (n = 504), Clinical Proteomic Tumor Analysis Consortium–Lung Squamous Cell Carcinoma (20) (n = 108), Clinical Proteomic Tumor Analysis Consortium–Lung Adenocarcinoma (21) (n = 110), and NSCLC-Radiogenomics (22) (n = 130), MutKEAP1/NFE2L2 was known for 770 patients, of which only 41 had an available PET/CT image. Because of the low number of cases, direct prediction of the mutational status using PET/CT features was deemed not feasible and prone to overfitting. Transcriptomics via sequencing of the RNA could give an insight on MutKEAP1/NFE2L2, with 33 genes being upregulated in the case of MutKEAP1/NFE2L2 (23) and thus leading to highly activated metabolic pathways such as glutathione metabolism. Genomics (exome sequencing data) and transcriptomics data were thus available for 770 patients (cohort 1), whereas transcriptomics (Illumina HiSeq platform) and PET/CT data were available for 158 patients (cohort 2).
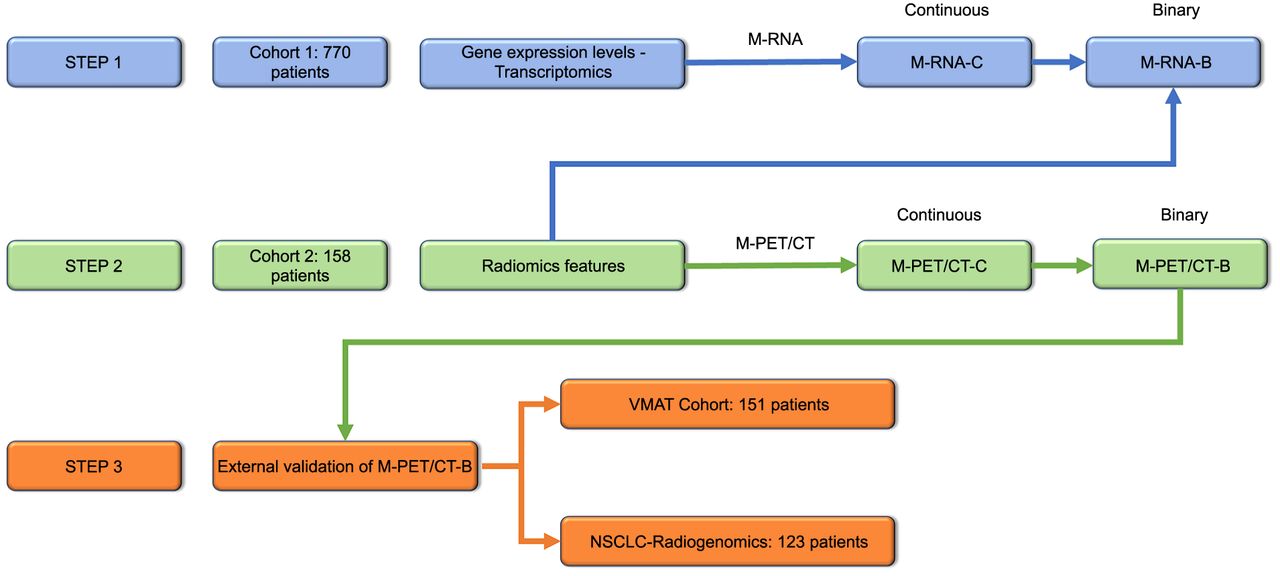
A 3-step approach was proposed. First, using cohort 1, the first model RNA (M-RNA) using continuous gene expression levels was developed to predict MutKEAP1/NFE2L2. Gene expression levels were normalized as reads per kilobase million. The outputs of the M-RNA were continuous-probability M-RNA and binary-outcome M-RNA (M-RNA-B). Second, another model (model PET/CT [M-PET/CT]) using radiomics data was built with a focus on cohort 2 for the prediction of M-RNA-B. The outputs of the M-PET/CT were thus M-PET/CT-C as a continuous probability and M-PET/CT-B as a binary output. Third, in the final step, 2 cohorts were used for clinical validation, testing the impact of M-PET/CT-B on LR-free survival (LRFS). Crude incidence rates were used. Survival analysis was based on a Kaplan–Meier curve using 2 cohorts: the NSCLC-Radiogenomics cohort, with 123 patients being analyzable (available clinical data and PET/CT), and an external cohort of 151 patients (cohort 3; NCT04545658 and NCT03931356) (24,25) treated with curative volumetric modulated arc radiotherapy.
The institutional review board of the University Hospital of Brest approved this retrospective study, and all subjects received a nonopposition form. The research was performed in accordance with the declaration of Helsinki. The section below (Model Building) shows the dichotomization of the continuous-probability M-RNA outputs to M-RNA-B ones.
Figure 1 provides a flowchart summarizing the different statistical steps, and a second flowchart explaining the patients’ selection is presented in Supplemental Figure 1 (supplemental materials are available at http://jnm.snmjournals.org).

Flowchart summarizing different statistical steps. M-RNA-C = continuous-probability M-RNA; VMAT = volumetric modulated arc radiotherapy.
As an additional statistical validation, direct prediction of MutKEAP1/NFE2L2 using M-PET/CT-C was also assessed in the 41 patients for whom both mutational status and PET/CT were available.
Model Building
Each model was built, internally validated, and evaluated on a separate cohort using a multilayer perceptron network approach, as previously reported (24,26). In-depth explanations regarding the model building are available as Supplemental Protocol 1 (18–25,27–29). Briefly, transcriptomics or radiomics features were first selected using the Mann–Whitney test. Only statistically different features about the MutKEAP1/NFE2L2 (step 1) or the M-RNA-B (step 2) were retained. Correlation between the retained features was then assessed with the Spearman correlation coefficient, keeping only the most significant feature in the case of a Spearman coefficient greater than 0.7. Selected features were then combined using a decremental neural network approach based on each feature’s ranking, with the ranking being set by the importance of the feature in the proposed model. For each model, the least important feature is put apart and the remaining features are provided for the development of the next model. The chosen model was the one maximizing the mean accuracy based on 1,000 replications of bootstrapping.
For the development of the M-RNA, cohort 1 was randomly split into 3 independent sets: training (50%, 381/770), validation (20%, 159/770), and testing (30%, 230/770). For the development of the M-PET/CT, cohort 2 was randomly split into a training set (∼60%, n = 151) and a testing set (∼40%, n = 57). Each model was associated with a probability cutoff based on the Youden index, thus classifying patients at high or low risk of mutation. For the M-RNA, the probability threshold was defined using the validation cohort, resulting in M-RNA-B. For the M-PET/CT, the probability threshold was determined on the training set, resulting in M-PET/CT-B.
Both models were evaluated on the testing and validation cohorts using receiver-operating characteristics such as the area under the curve (AUC), sensitivity, specificity, interrater agreement statistic (κ), balanced accuracy (BACC), and F1 score. Negative and positive predictive values were calculated. Decision curves were also used for the models’ evaluation. The impact of the probability threshold was assessed by changing its value and observing the shifts in sensitivity, specificity, negative predictive values, positive predictive values, and κ for the M-PET/CT. The research was performed in accordance with the Standards for Reporting of Diagnostic Accuracy guidelines.
RESULTS
Prediction of MutKEAP1/NFE2L2 Using Transcriptomics Data
A mutation of either KEAP1 or NFE2L2 was found in 175 of 770 patients (22.7%). The best M-RNA reached a mean accuracy of 91.6% in the training cohort (Supplemental Fig. 2). When 9 transcriptomics features were combined (CBR1, G6PD, GCLM, NQO1, PGD, SRXN1, TRIM16, TXNRD1, and UGDH), the M-RNA reached an AUC of 0.99 (P < 0.001). The importance of each transcriptomics feature in the M-RNA is shown in Supplemental Table 1.
In the training set and with a 15% probability cutoff, the M-RNA resulted in a BACC of 96.8%, a sensitivity of 96.3%, a specificity of 97.3%, and a κ of 0.90. With the same probability threshold, the BACC was 78.8% and 81.9% in the validation and testing cohorts, respectively.
The receiver-operating-characteristic curves for each cohort are available in Figures 2A and 2C, and the results according to the cohort are detailed in Table 1.

Prediction of MUTKEAP1/NFE2L2 using continuous-probability M-RNA (receiver-operating-characteristic curve) in training cohort (A), validation cohort (B), and testing cohort (C).
Prediction of MUTKEAP1/NFE2L2 Using Continuous-Probability M-RNA
Decision curve analysis showed the efficiency of the M-RNA, especially for higher predicted probabilities mainly in the testing cohort (Supplemental Figs. 3A–3C).
Prediction of M-RNA-B Using Radiomics Features
On the basis of the 101 patients from the training cohort, only 5 features harbored a significant differential distribution between the 2 M-RNA-B groups: 4 features extracted from PET and 1 extracted from CT (Supplemental Table 2). Selected radiomics features harbored a significant correlation with 7 of 9 retained transcriptomics features as shown in Supplemental Table 3. A positive M-RNA-B status was seen for 29.7% and 17.5% (P = 0.09) of the training and testing cohorts, respectively (Supplemental Table 4).
In the training cohort, the M-PET/CT combined the 5 previously presented radiomics features, resulting in a mean accuracy of 74.1%. The most important feature was the Wavelet-HLH_glcm_MaximumProbability, with an importance of 82.0%. In the training cohort, M-PET/CT-C achieved an AUC of 0.90 (P < 0.001). When the 20% probability threshold maximizing the Youden index was applied, M-PET/CT-B resulted in a BACC of 80.4%, a sensitivity of 83.3%, a specificity of 77.5%, and a κ of 0.55. On the testing cohort, M-PET/CT decreased to an AUC of 0.71 (P = 0.02), a κ of 0.34, a BACC of 70.5%, a sensitivity of 60%, and a specificity of 80.9%. In the training and testing cohorts, respectively, M-PET/CT-B resulted in negative predictive values of 91.7% and 90.5% and positive predictive values of 61.0% and 40.0% (Table 2).
Receiver-Operating Characteristics of M-RNA-B Using M-PET/CT-C in Each Cohort
The receiver-operating-characteristic curves for each cohort (training and testing cohorts) are available in Figures 3A and 3B, and the mean accuracy for M-PET/CT is presented as Supplemental Figure 4.

Prediction of M-RNA-B using M-PET/CT-C (receiver-operating-characteristic curve): M-PET/CT-C in training cohort (A) and in testing cohort (B).
In the testing cohort, analysis of the decision curve for M-PET/CT-C showed a positive net clinical benefit for probabilities ranging between 0% and 33% (Supplemental Fig. 5).
Prediction of MutKEAP1/NFE2L2 Using M-PET/CT-C
An exploratory analysis regarding the prediction of MutKEAP1/NFE2L2 using M-PET/CT-C was performed. For the 26 patients included in the training cohort, M-PET/CT-C reached an AUC of 0.71 (P = 0.06), whereas the AUC changed to 0.80 for the 15 patients in the testing cohort.
Impact on LRFS
Prediction of LRFS in NSCLC-Operated Patients Using M-PET/CT-B
With a median follow-up of 58.8 mo (95% CI, 43.4–64.6 mo), the LR rate was as low as 4.6% (6 of 123 patients from the NSCLC-Radiogenomics cohort). No significant difference was found according to the M-PET/CT-B as shown in Figure 4A.

Prediction of LRFS in NSCLC-Radiogenomics (A) and volumetric modulated arc radiotherapy (B) cohorts using M-PET/CT-B.
Prediction of LRFS in NSCLC Patients Treated with Curative Radiotherapy Using M-PET/CT-B
In a retrospective cohort of 151 patients with a median follow-up of 28.9 mo (95% CI, 21.1–35.1 mo), LR occurred in 15.1% of the patients. M-PET/CT-B significantly stratified patients regarding their risk of LR, with a hazard ratio of 2.61 (95% CI, 1.07–6.40; P = 0.02) with a LR rate of 15.1% as shown in Figure 4B.
DISCUSSION
To our knowledge, this study is the first to focus on the prediction of the KEAP1/NFE2L2 mutation. Not being available in the clinical practice because of its cost and novelty, noninvasive prediction could have a significant therapeutic impact given the shorter LRFS in patients harboring such mutations. When 5 PET/CT radiomics features were combined, the M-PET/CT was predictive of LRFS in an external cohort of 151 patients treated with radiotherapy.
The KEAP1/NFE2L2 molecular pathway is of growing interest given recent data, making it a potential biomarker of radioresistance (14). Our model could have a substantial impact on the treatment of NSCLC. With a negative predictive value of 90.5%, patients with a M-PET/CT-C of 20% or less could thus continue with their radiotherapy plan, whereas patients with a M-PET/CT-C of more than 20% could be proposed for either tumor RNA or genome sequencing. In the testing cohort alone, this would avoid such genetic tests for 73.7% (42/57) of the testing cohort. In the overall cohort, the M-PET/CT would avoid unnecessary genetic testing for 64.6% of the cohort, with the risk of only 9 false-negative patients (5.7%). The BACC decreased in the testing set, especially with a lower sensitivity. Apart from the performance of the M-PET/CT itself, this can partly be explained by the lower rate of M-RNA-B–positive patients in the testing set.
In the case of a proven mutation affecting the KEAP1/NFE2L2 pathway, management remains unclear to this day. Operable patients could be referred to a thoracic surgeon. However, a significant number of patients are probably not suitable for surgery. For this subset of patients, dose escalation or treatment combination could be proposed. Use of radiosensitization agents such as glutaminase inhibitors could lower the risk of LR (13,14).
The second major finding in our work is the significant stratification allowed by M-PET/CT-C regarding the LR risk in patients treated with radiotherapy. Patients with a M-PET/CT-C greater than 20% were 2.6 times more likely to present with LR in an external cohort. These data highlighted the strength of radiogenomics and opened the possibility of imputing our model in LR prediction modeling and possibly not using the M-RNA. As expected, results were not significant in the radiogenomics cohort. Response to treatment is known to be independent from MutKEAP1/NFE2L2 in patients who had surgery (14).
Certain limitations could not be overcome. Prediction of the MutKEAP1/NFE2L2 rather than a surrogate would probably limit the complexity of our approach. Nevertheless, the AUC of 0.80 for the prediction of MutKEAP1/NFE2L2 using M-PET/CT-C in the testing cohort demonstrates the potential of our approach. The M-PET/CT was trained and validated in patients among several cohorts. The semiautomatic segmentation ensures robustness and low intervariability. The neuroCombat harmonization method (28,29) limits the heterogeneity associated with multicentric data without compromising interpatient variability. Although the external validity of such a model is probably enhanced, the testing cohort for M-PET/CT-B cannot be seen as an external validation. Having a real external validation remains necessary, especially given the possible instability of wavelet-based features (30). Finally, the pathogenicity of MutKEAP1/NFE2L2 was not evaluable, thus limiting the explainability of M-PET/CT. Maximum probability is a radiomics feature extracted on the gray level cooccurrence matrix. It represents the number of occurrences of the most predominant pair of neighboring intensity values. Although a significant correlation was found between the selected radiomics features including the maximum probability and most transcriptomics features, the positive correlation between the maximum probability and M-PET/CT-B indicates that the probability of mutation is associated with the 18F-FDG heterogeneity uptake. Despite these limitations, M-PET/CT-B significantly stratified patients treated with radiotherapy in an external cohort.
CONCLUSION
Using a hybrid approach, a model combining PET/CT-extracted radiomics features was able to predict the MutKEAP1/NFE2L2 as well as the risk of LR after radiotherapy. This model appears to be generalizable without any added costs or sequencing delays and could be used in the selection of patients for genetic testing and LR prediction modeling. It could thus have a significant impact in helping clinicians select thoracic radiotherapy or surgery for their patients. External validation of this model is currently under investigation, opening the field to new treatment strategies.
DISCLOSURE
No potential conflict of interest relevant to this article was reported.
KEY POINTS
QUESTION: Can a PET/CT-based radiomics model predict the MutKEAP1/NFE2L2 and thus LRFS after thoracic radiotherapy?
PERTINENT FINDINGS: In this innovative research article, a transcriptomics signature was developed and internally validated using a cohort of 770 NSCLC patients. A radiomics-based M-PET/CT was able to predict the transcriptomics signature. This radiomics signature was validated on an external cohort of 151 patients treated with radiotherapy, in which patients at high risk of relapse as calculated by the radiomics signature were 2.6 times more likely to present with LR.
IMPLICATIONS FOR PATIENT CARE: This model appears to be generalizable without any added costs or sequencing delay and could be used for the selection of patients for genetic testing and LR prediction modeling. This model is accessible for external use and validation on request.
Footnotes
Published online Feb. 15, 2024.
- © 2024 by the Society of Nuclear Medicine and Molecular Imaging.
REFERENCES
- 1.
- 2.
- 3.
- 4.
- 5.
- 6.
- 7.
- 8.
- 9.
- 10.
- 11.
- 12.
- 13.
- 14.
- 15.
- 16.
- 17.
- 18.
- 19.
- 20.
- 21.
- 22.
- 23.
- 24.
- 25.
- 26.
- 27.
- 28.
- 29.
- 30.
- Received for publication September 25, 2023.
- Revision received January 2, 2024.