


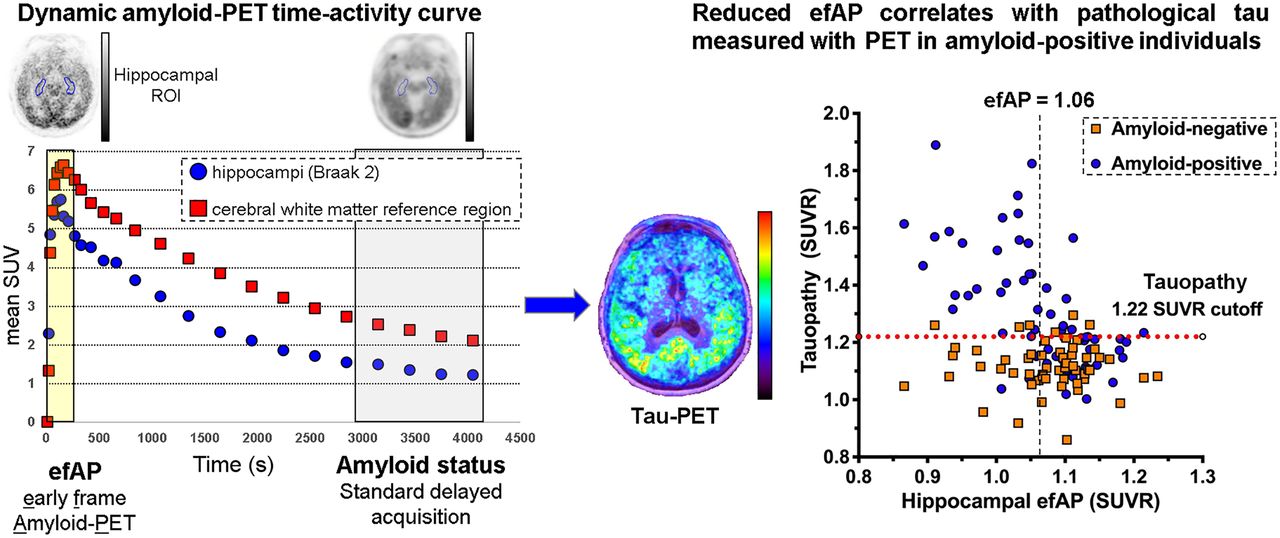
Visual Abstract

Abstract
Measuring amyloid and predicting tau status using a single amyloid PET study would be valuable for assessing brain AD pathophysiology. We hypothesized that early-frame amyloid PET (efAP) correlates with the presence of tau pathology because the initial regional brain concentrations of radioactivity are determined primarily by blood flow, which is expected to be decreased in the setting of tau pathology. Methods: The study included 120 participants (63 amyloid-positive and 57 amyloid-negative) with dynamic 18F-florbetapir PET and static 18F-flortaucipir PET scans obtained within 6 mo of each other. These subjects were predominantly cognitively intact in both the amyloid-positive (63%) and the amyloid-negative (93%) groups. Parameters for efAP quantification were optimized for stratification of tau PET positivity, assessed by either a tauopathy score or Braak regions. The ability of efAP to stratify tau positivity was measured using receiver-operating-characteristic analysis of area under the curve (AUC). Pearson r and Spearman ρ were used for parametric and nonparametric comparisons between efAP and tau PET, respectively. Standardized net benefit was used to evaluate improvement in using efAP as an additional copredictor over hippocampal volume in predicting tau PET positivity. Results: Measuring efAP within the hippocampus and summing the first 3 min of brain activity after injection showed the strongest discriminative ability to stratify for tau positivity (AUC, 0.67–0.89 across tau PET Braak regions) in amyloid-positive individuals. Hippocampal efAP correlated significantly with a global tau PET tauopathy score in amyloid-positive participants (r = −0.57, P < 0.0001). Compared with hippocampal volume, hippocampal efAP showed a stronger association with tau PET Braak stage (ρ = −0.58 vs. −0.37) and superior stratification of tau PET tauopathy score (AUC, 0.86 vs. 0.66; P = 0.002). Conclusion: Hippocampal efAP can provide additional information to conventional amyloid PET, including estimation of the likelihood of tau positivity in amyloid-positive individuals.
Alzheimer disease (AD) is the primary cause of age-related dementia, affecting approximately 50 million people worldwide. AD pathophysiologic processes begin years before clinical symptoms. Established neuroimaging biomarkers include neurodegeneration with MRI and 18F-FDG PET, as well as 18F-florbetapir, 18F-florbetaben, and 18F-flutemetamol for amyloid plaques and 18F-flortaucipir for tau tangles, respectively (1). These biomarkers can predict pathophysiologic progression and cognitive performance (1,2).
In standard amyloid PET studies, amyloid status is measured 30–120 min after injection, depending on the tracer (3,4). Dynamic acquisition allows collection of a second potential biomarker during the initial tracer flow–delivery phase (5–7), but the clinical role of these early uptake measures is not well defined. Several groups have shown strong correlations between early flow measures from dynamic amyloid PET and regional cerebral perfusion measured with 15O-water PET (6,8) and between early flow measures from dynamic amyloid PET and regional cerebral glucose metabolism measured with 18F-FDG (9–11). Other studies have shown that a higher tau burden as measured with PET correlates with regional hypometabolism observed with 18F-FDG PET (12,13). This body of work led us to pursue the relationship between flow measures with dynamic amyloid PET and the presence of tau pathology.
The objectives of this study were to determine the relationship between early-frame amyloid PET (efAP) and tau PET in amyloid-positive individuals and to assess the potential of dynamic amyloid PET to predict tau PET status. We chose a relatively simple method to calculate efAP in order to increase the clinical relevance and ease of implementation. We hypothesized that reduced efAP would correlate with pathologic tau measured by PET in amyloid-positive individuals evaluated with both dynamic amyloid and tau PET scans within 6 mo of each other.
MATERIALS AND METHODS
Study Population
Participants were selected from a cohort at the Charles F. and Joanne Knight Alzheimer Disease Research Center at Washington University in St. Louis. The recruitment, assessment, and exclusion criteria methods have been published previously (14) and are available at https://knightadrc.wustl.edu. All studies were approved by the Institutional Review Board at Washington University in St. Louis and the University of Alabama at Birmingham, indicating compliance with all ethical regulations; informed consent was obtained from all participants before study enrollment.
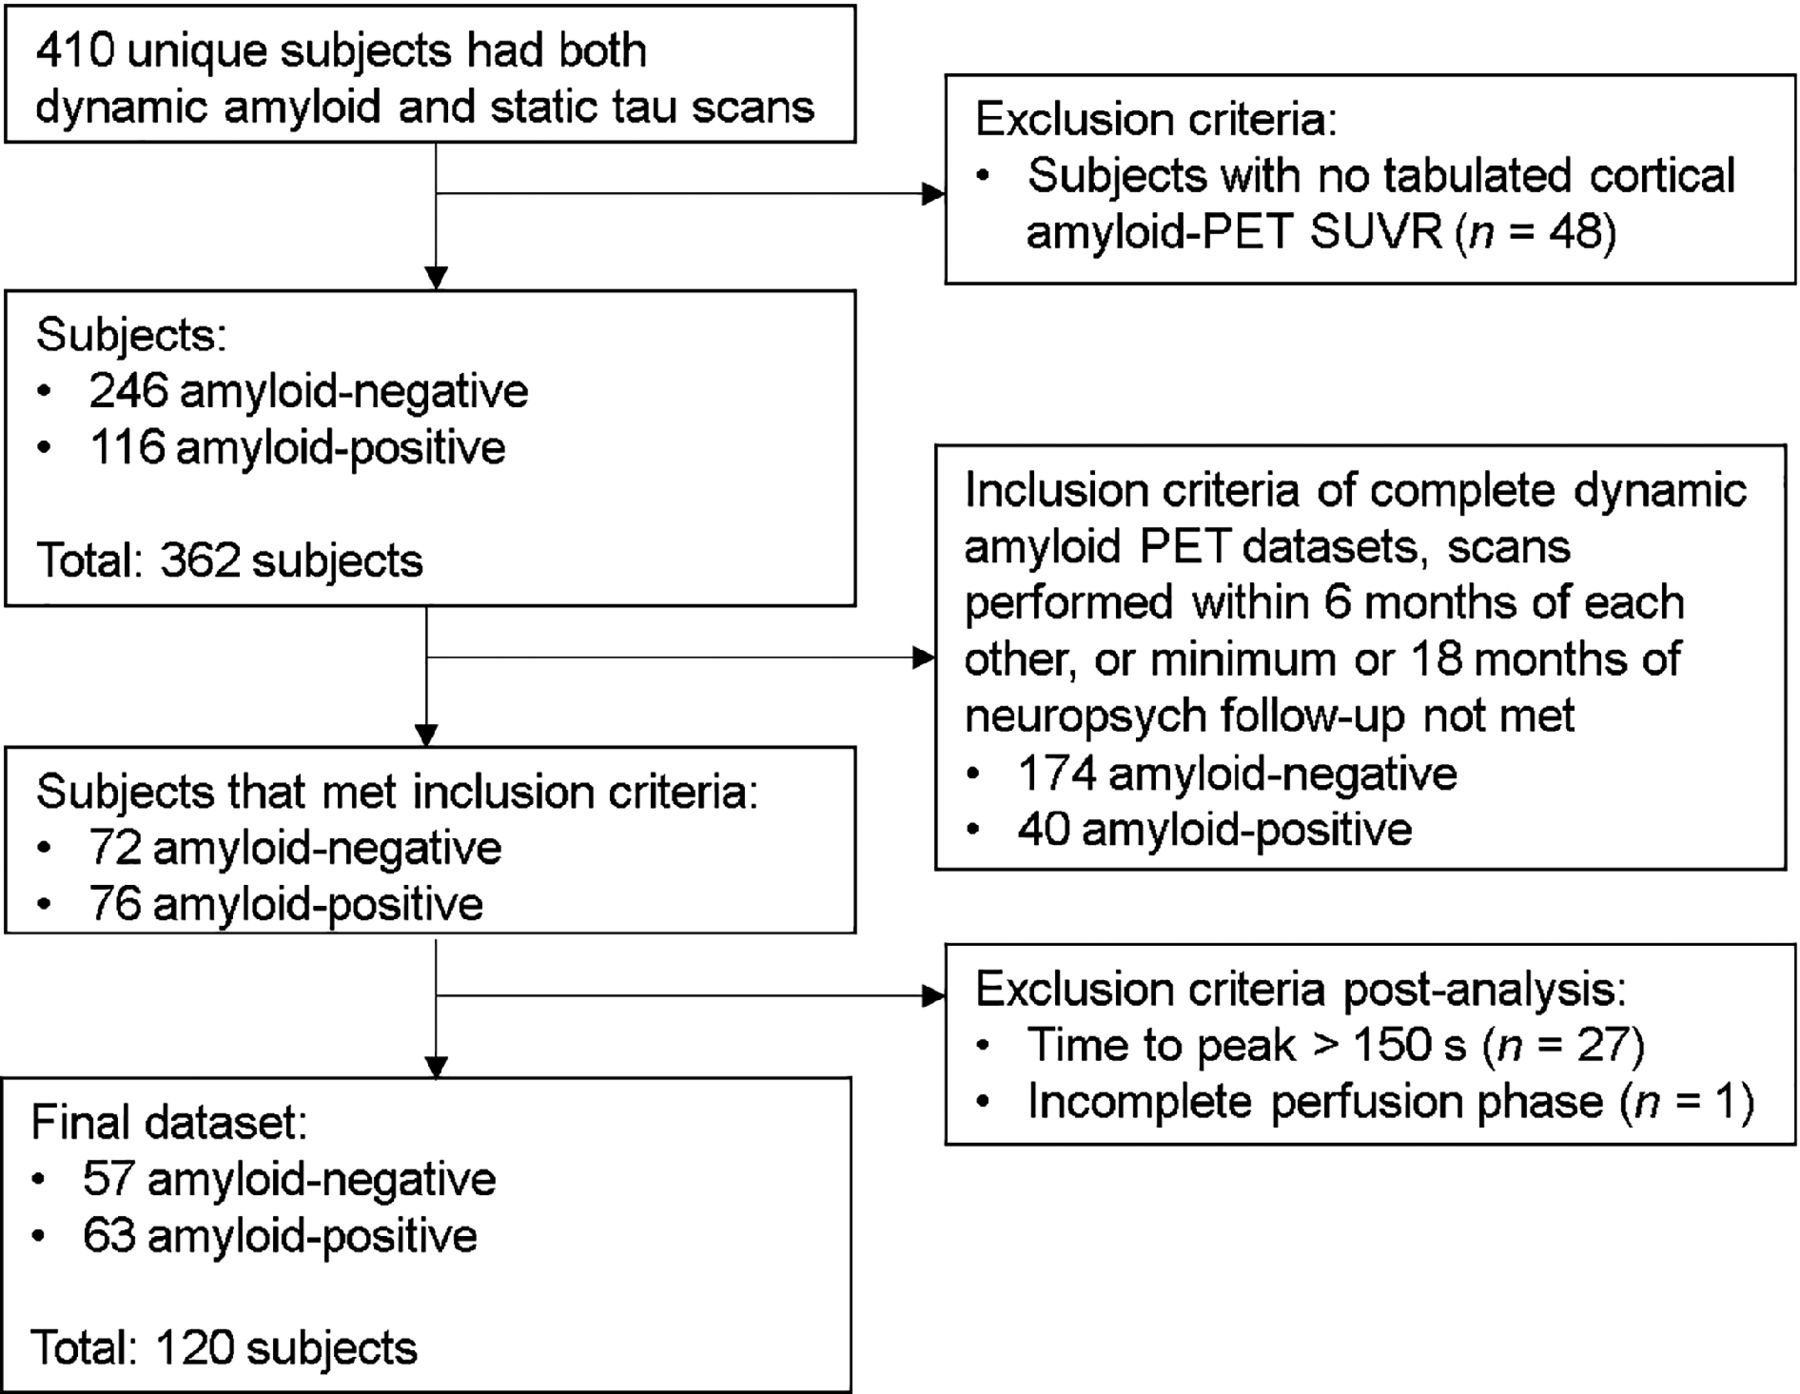
From the cohort of 410 unique participants, 63 amyloid-positive and 57 amyloid-negative participants who met the eligibility criteria were selected. Subjects had to have dynamic amyloid PET, tau PET, and brain MRI completed within 6 mo of each other and at least 18 mo of neuropsychologic evaluation after completion of imaging. Subjects were categorized as amyloid- and tau-positive or -negative on the basis of established cutoffs from the Charles F. and Joanne Knight Alzheimer Disease Research Center (15,16). Specifically, a mean cortical SUV ratio (SUVR) of 1.19 for amyloid PET (16) and a tauopathy SUVR of 1.22 for tau PET (15) were used to stratify amyloid and tau positivity and screen subjects on the basis of prior analyses. Subject selection and demographics, including cognitive measures, are presented in Figure 1 and Table 1, respectively.

Flowchart for selection of 63 amyloid-positive and 57 amyloid-negative subjects for analysis in this study from retrospective cohort of 410 subjects.
Cohort Demographics
Image Sets Used for Analysis
18F-florbetapir PET was performed using an intravenous bolus of 274–418 MBq (7.4–11.3 mCi) on a Siemens Biograph mMR scanner. Data were acquired at the time of injection through 70 min, and reconstruction was performed with 26 frames (4 × 15 s, 4 × 30 s, 3 × 60 s, 3 × 120 s, 2 × 240 s, and 10 × 300 s). Data from 50 to 70 min after injection were used for amyloid quantification (16). Amyloid SUVRs were calculated in brain regions of interest (ROIs), using the entire cerebellum as the reference ROI.
MRI and 18F-flortaucipir PET acquisition and preprocessing were performed as previously reported (15). Tau PET was performed on a Siemens Biograph 40 PET/CT scanner using an intravenous bolus of 266–400 MBq (7.2–10.8 mCi) of 18F-flortaucipir. Data from 80 to 100 min after injection were used for regional brain tau quantification (15). Tau SUVRs were calculated in brain ROIs, using cerebellar gray matter as the reference ROI.
Calculation of Flow-Phase Parameters from Dynamic Amyloid PET
Regional dynamic amyloid and static tau PET data were measured using MRI-based FreeSurfer segmentation (17) with an algorithm (biomarker localization, analysis, visualization, extraction, and registration) developed by our group (18). Calculation of efAP from dynamic amyloid PET was performed in Matlab, version R2019b (MathWorks). A set of time-averaged early-frame efAP intervals was generated in Matlab to test a range of different start points (5%–50% of peak cerebral cortex radioactivity) and endpoints of early-frame intervals (45–600 s from the start of acquisition). In total, 79 target (T) ROIs based on FreeSurfer segmentation were integrated over each early-frame interval and subsequently normalized to the integrated time–activity curve of the appropriate reference (R) ROI over the same period. Since we used discrete integrals based on the radioactivity (A) and associated frame duration (D) over the selected set of early frames, the equation could be simplified as follows:
 Eq. 1
Eq. 1
Tau Assessment in Tauopathy Summary Measure, Braak ROIs, and In Vivo Braak Staging
A tauopathy summary measure was previously experimentally derived using a sparse k-means clustering with resampling analysis to identify the ROIs most informative in dividing a cognitively normal population into high-tau and low-tau groups. The highest-weighted FreeSurfer ROIs separating these groups were the entorhinal cortex, amygdala, lateral occipital cortex, and inferior temporal cortex, and an average SUVR in these 4 ROIs was used as a summary metric for 18F-flortaucipir uptake (15).
To replicate Braak neuropathologic staging, tau PET Braak ROIs were created from volume-weighted FreeSurfer subregions as defined by the algorithm our group developed (18). Braak ROIs refers to specific anatomic regions regardless of their tau status, whereas Braak staging refers to the presence of pathologic tau in these ROIs based on 18F-flortaucipir PET. Similar to Schöll et al. 2016, tau PET Braak staging was performed by first categorizing the following volume-weighted, composite ROIs: transentorhinal (Braak stage I/II), limbic (Braak stage III/IV), and isocortical (Braak stage V/VI) (19). To maintain consistency across thresholding techniques, the same 1.22 cutoff (15) as was used to determine tau status was applied to the composite Braak ROIs as follows: subjects positive (SUVR > 1.22) across all 3 ROIs (Braak ROIs I/II, III/IV, and V/VI) were assigned Braak stages V and VI; subjects positive in Braak ROIs I/II and III/IV but negative in V/VI were assigned Braak stages III and IV; subjects positive in Braak ROI I/II but negative elsewhere were assigned Braak stages I and II; and subjects negative across all 3 composite ROIs were assigned Braak stage 0.
Calculation of Normalized Hippocampal Volume
Hippocampal volume was reported as the percentage of the cerebral cortex to normalize across different participants, as calculated using the following equation (20):
 Eq. 2
Eq. 2
Statistical Analyses
All statistical analyses were performed using SPSS Statistics, version 26.0 (IBM), and Matlab, version R2019b (MathWorks), to compare efAP values with tau PET positivity. All parametric analyses between Braak ROIs used the Pearson r correlation coefficient, whereas nonparametric analyses across all Braak stages used the Spearman ρ and nonparametric analyses between individual Braak stages used the Wilcoxon rank sum test. The significance level was a P value of less than 0.05 with a Bonferroni adjustment for multiple comparisons.
Intersubject, univariate Pearson correlations were performed between efAP and tau PET Braak ROIs I–VI across all 120 subjects, separating subjects by amyloid status. Because only 1 subject was positive in tau PET Braak ROI VI (SUVR > 1.22), this ROI was excluded for optimization purposes. Additionally for optimization purposes, and to align with our hypothesis, only the 63 amyloid-positive subjects were used. Area under the curve (AUC) was used to test the performance of the receiver-operating-characteristic (ROC) curve, with efAP being used as the predictor variable and tau positivity (SUVR > 1.22) in tau PET Braak ROIs I–V being used as the outcome variable. The early-frame interval and target ROI corresponding to the maximum AUC (mean ± SD) was selected for the remainder of the study. Similarly, the following 6 reference ROIs for the calculation of efAP were compared for the ability to predict positive tau PET findings: the entire cerebellum, the cerebral white matter, the region pre- and postcentral gyri, the Braak VI tau ROI, the Braak V/VI composite ROI, and the basal ganglia.
Logistic regression models were used to examine the accuracy of efAP in distinguishing between tau-negative and tau-positive groups. The performance of efAP was assessed using ROC curves to compare sensitivity and specificity and to determine the optimal cutoff for efAP and the best time interval. For parameter optimization for the dataset, AUC was calculated and compared with a value of 0.5 (random agreement) using the methods of Obuchowski et al. (21). Sensitivity, specificity, positive predictive value (PPV), and negative predictive value (NPV) were reported at the optimal cutoff based on the maximum Youden index (22). To evaluate performance between biomarkers in stratifying for tau positivity, ROC curves were compared using the methods of DeLong et al. (23), with SE as calculated by SPSS. Additionally, standardized net benefit was used to measure the improvement in efAP as an additional predictor over hippocampal volume, with tau PET positivity set as the outcome variable (24,25).
RESULTS
The Hippocampus Is Selected as the Optimal Target ROI, and the Cerebral White Matter Is Selected as the Optimal Reference ROI
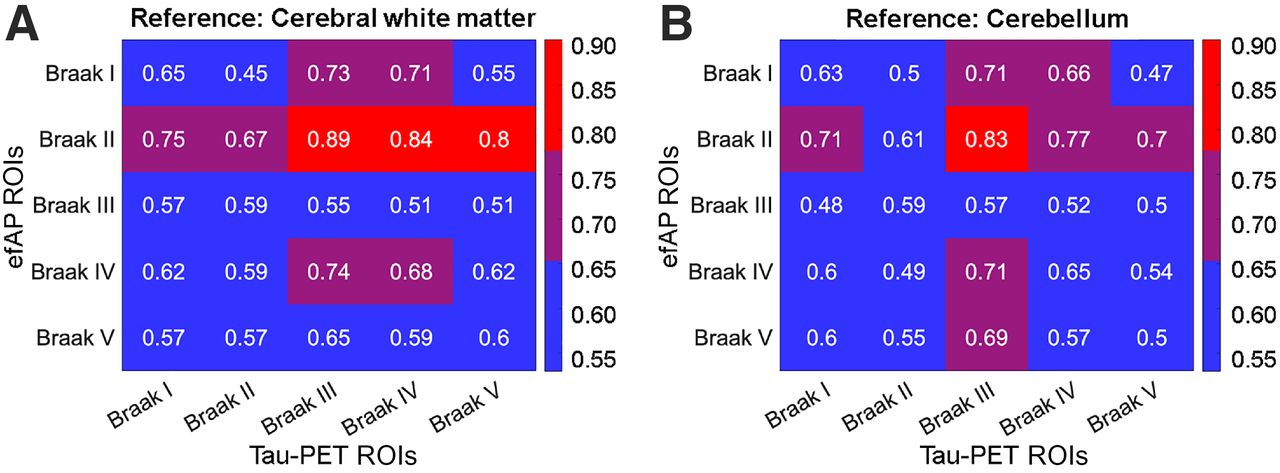
Our first objective was to determine which target ROI, reference ROI, and time frames would optimize the predictive performance of efAP. When evaluating efAP as the predictor variable for each of the 79 ROIs and tau positivity as the outcome variable, we found that efAP in tau PET Braak ROI II (hippocampus) showed the strongest AUC across Braak ROIs I–V when using a cerebral white matter reference ROI (0.79 ± 0.082), peaking at 0.89 for tau PET using Braak ROI III (Fig. 2; Supplemental Figs. 1 and 2; supplemental materials are available at http://jnm.snmjournals.org). Thus, the hippocampus was chosen as the target ROI and the cerebral white matter was chosen as the reference ROI for efAP calculations for the remainder of the study.

efAP Braak II ROI (hippocampus) and cerebral white matter chosen as target and reference ROIs, respectively. AUC was used to test performance of ROC curve. AUC between first 5 tau PET Braak ROIs shown for efAP was used as predictor variable, and tau PET was used as outcome variable. Different reference ROIs for calculation of efAP were compared with cerebral white matter (A) and cerebellum (B), showing strongest AUC across efAP in Braak II ROIs, also known as hippocampus. Color scale shows ranges of AUCs in tables, with blue being lowest, purple intermediate, and red highest.
The Optimal Early-Phase Interval Starts at 5% of Cerebral Cortex Peak Activity and Ends at 3 Minutes After Injection
Next, we determined which dynamic amyloid PET early time interval was most closely associated with tau PET. Using ROC analysis, we compared the AUCs when applying hippocampal efAP as the predictor variable and tau PET positivity across tau PET Braak ROIs I–V as the outcome variables (Supplemental Fig. 3). The endpoint of the early-phase interval was determined to be ideal at 3 min after injection, when the AUC was highest (0.79 ± 0.0042). Selection of the endpoint showed only a 3.3% decline from this peak AUC until 6 min after injection and a 8.5% decline until 10 min after injection, emphasizing the relative stability of efAP measurement to varying time intervals. Although altering the start point of the early-phase interval showed only marginal variations in the AUC (<5%), setting a higher threshold of peak cerebral cortex activity for selection of the first frame used in efAP measurement marginally decreased the AUC at all points (Supplemental Fig. 3). Thus, the early-phase interval starting at 5% of cerebral cortex peak activity and ending at 3 min after injection was deemed optimal.
Hippocampal efAP Correlates with Tau PET Results in Amyloid-Positive Participants
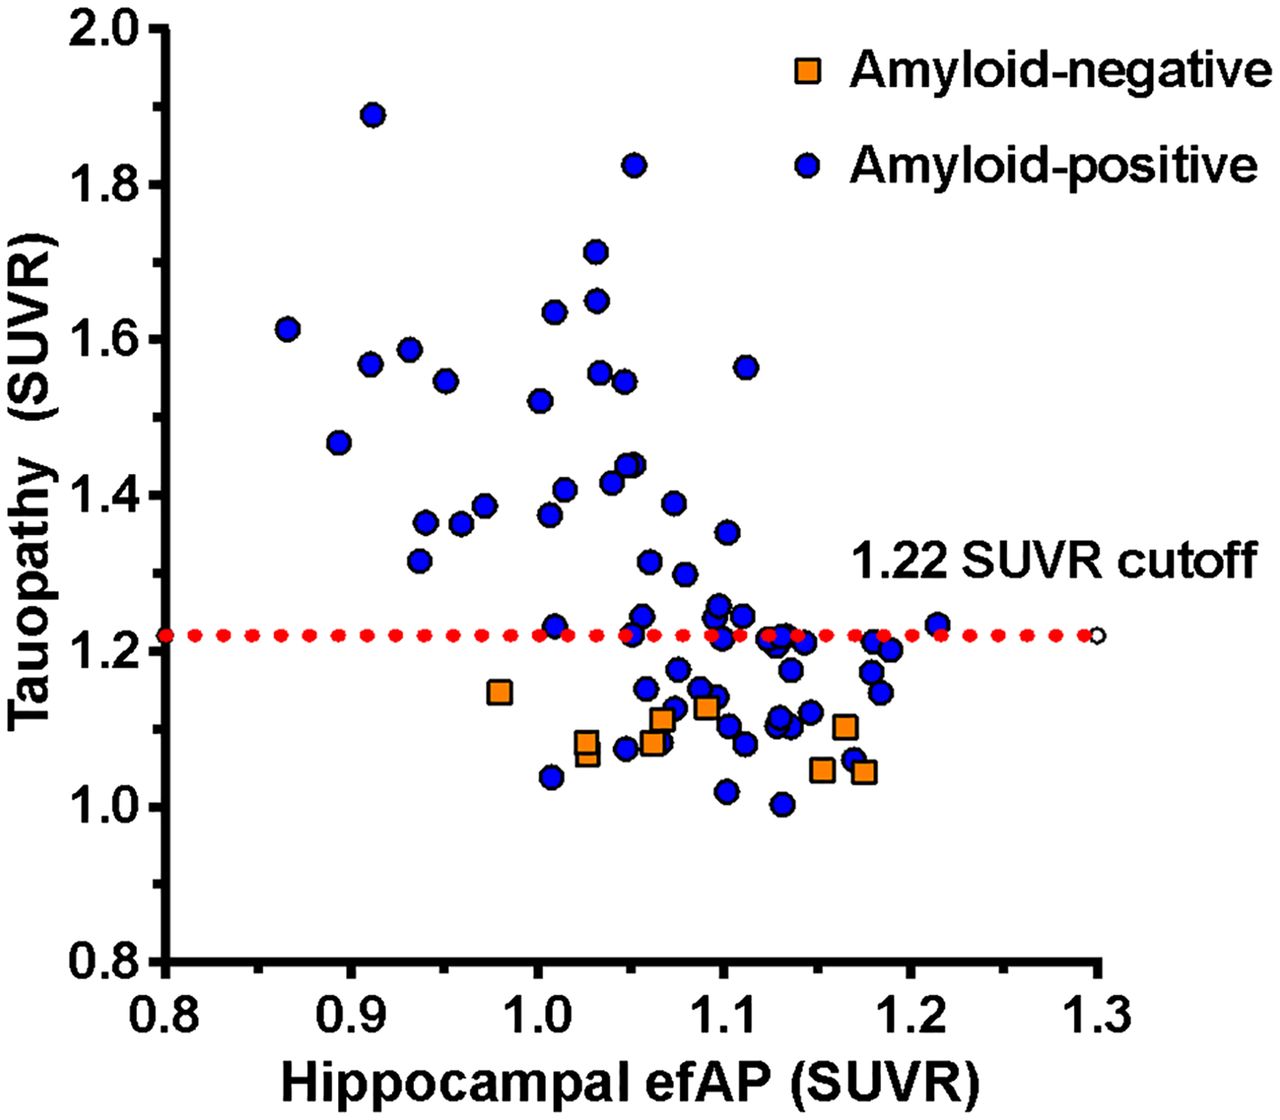
Next, we evaluated the relationships between hippocampal efAP and tau PET. A visual example of the inverse correlation between hippocampal efAP and tau PET for a cognitively normal subject (tau PET Braak stage 0) and for late-stage disease (tau PET Braak stages V and VI) is shown in Figure 3. Comparing hippocampal efAP with the tauopathy summary measure showed a significant Pearson correlation coefficient in amyloid-positive participants (r = –0.57, P < 0.0001). As expected, this relationship was absent in amyloid-negative participants (Fig. 4). Significant regional correlations (P < 0.001) were also seen in amyloid-positive participants across tau PET Braak ROIs I, II, III, IV, and V (r = –0.50, –0.43, –0.58, –0.66, and –0.48, respectively; Supplemental Fig. 4). ROC analysis revealed that hippocampal efAP could be used to strongly predict tau positivity on tau PET in amyloid-positive participants at a global level using the tauopathy summary measure (AUC, 0.86; efAP cutoff, 1.06; sensitivity, 71%; specificity, 93%; PPV, 93%; and NPV, 72%; Fig. 5A). Regional analyses in individual Braak ROIs I, II, III, IV, and V also showed strong discrimination of tau PET positivity (AUCs of 0.75, 0.67, 0.89, 0.84, and 0.80, respectively; Supplemental Fig. 5).
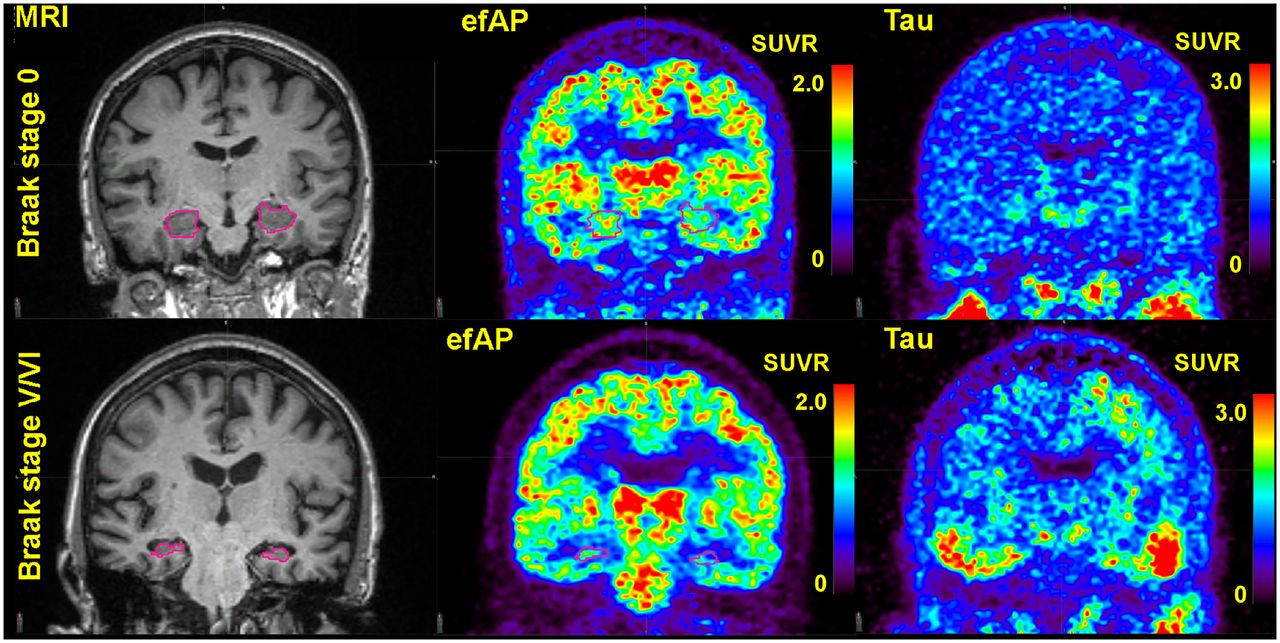
Example of inverse relationship between hippocampal efAP and tau PET Braak stage. Comparisons of representative subjects from tau PET Braak stage 0 and Braak stages V and VI show appearance of efAP at 2 ends of disease spectrum. First column highlights hippocampus in pink on volumetric MRI, second column shows efAP values from dynamic florbetapir PET, and third column shows tau PET. Intensity scales for PET images are shown as SUVRs.

Comparison of hippocampal efAP and tau PET tauopathy summary measure for amyloid-positive (r = –0.57, P < 0.0001) and amyloid-negative (r = 0.05, P = 0.69) participants. efAP parallels and predicts tau PET pathology. Tau PET SUVR cutoff was used to stratify subjects for tau positivity.

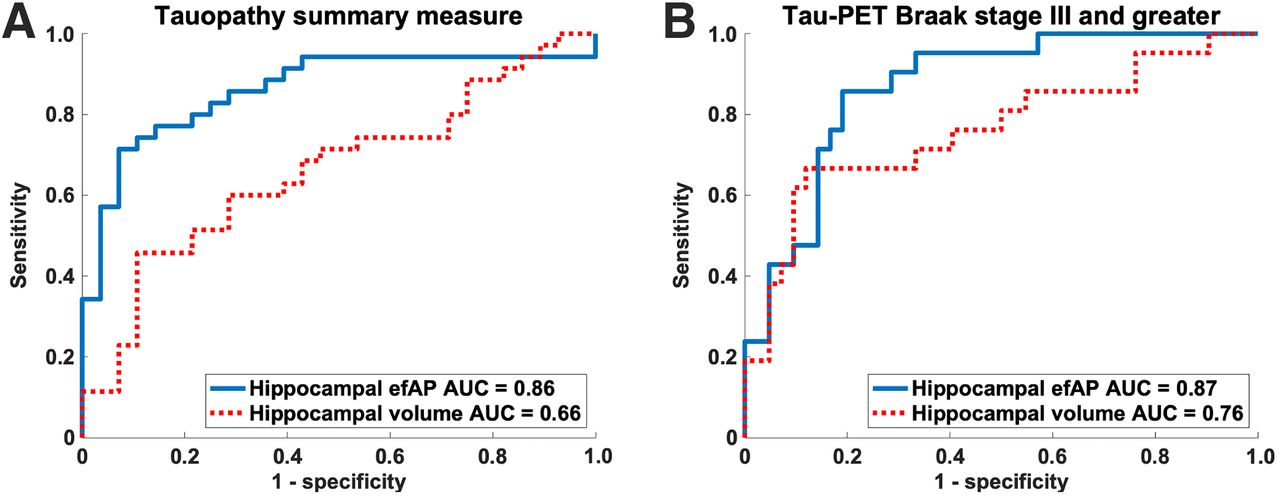
Predictor variables: ROC curves for efAP and normalized hippocampal volume. Outcome variables: tau PET positivity in tauopathy summary measure and Braak stage III or greater. Hippocampal efAP has stronger discriminatory ability than hippocampal volume for predicting tau PET positivity in amyloid-positive subjects. Tau positivity was defined as SUVR > 1.22. (A) AUC measured for efAP cutoff of 1.06 was 0.86, with sensitivity and specificity of 71% and 93%, respectively, and PPV and NPV of 93% and 72%, respectively; AUC measured for volume was 0.66, with sensitivity and specificity of 46% and 89%, respectively, and PPV and NPV of 84% and 57%, respectively. AUC difference was statistically significant (z = 3.08, P = 0.002). (B) AUC measured for efAP cutoff of 1.05 was 0.87, with sensitivity and specificity of 86% and 81%, respectively, and PPV and NPV of 69% and 92%, respectively; AUC measured for volume was 0.76, with sensitivity and specificity of 67% and 88%, respectively, and PPV and NPV of 74% and 84%, respectively. This AUC difference did not reach statistical significance (z = 1.54, P = 0.12).
Hippocampal efAP Shows Stronger Correlation with Tau Status Than Does Hippocampal Volume
A reduction in hippocampal volume could reduce SUVs because of partial-volume averaging. Therefore, we compared these 2 biomarkers in amyloid-positive individuals to determine whether hippocampal efAP conveyed additional information not provided by hippocampal volume measurement alone. Characterizing subjects by their tau PET Braak stage showed that both hippocampal efAP and hippocampal volume significantly decreased with increasing tau PET Braak stage (Fig. 6). Hippocampal efAP showed a stronger inverse relationship with tau PET Braak stage (ρ = –0.58, P < 0.0001; Fig. 6A) than with hippocampal volume (ρ = –0.37, P = 0.0034; Fig. 6B). Wilcoxon rank sum testing between individual groups showed similar results, with the differences between Braak stages I and II and Braak stages III and IV being the greatest for both hippocampal efAP (1.11 ± 0.07 vs. 1.00 ± 0.07, P = 0.0002; Fig. 6A) and hippocampal volume (1.86 ± 0.18 vs. 1.60 ± 0.20, P = 0.0014; Fig. 6B). When looking at efAP and hippocampal volume as individual predictors of tau PET, the discriminatory ability to predict tau positivity was superior for hippocampal efAP compared with hippocampal volume across the tauopathy summary measure (AUC, 0.86 vs. 0.66; z = −3.08; P = 0.002) with higher sensitivity (71% vs. 46%), specificity (93% vs. 89%), PPV (93% vs. 84%), and NPV (72% vs. 57%) (Fig. 5A). Although hippocampal efAP showed a trend toward higher predictive ability than hippocampal volume for Braak stage III or greater, the results did not reach statistical significance (AUC, 0.87 vs. 0.76; z = 1.54; P = 0.12; Fig. 5B).
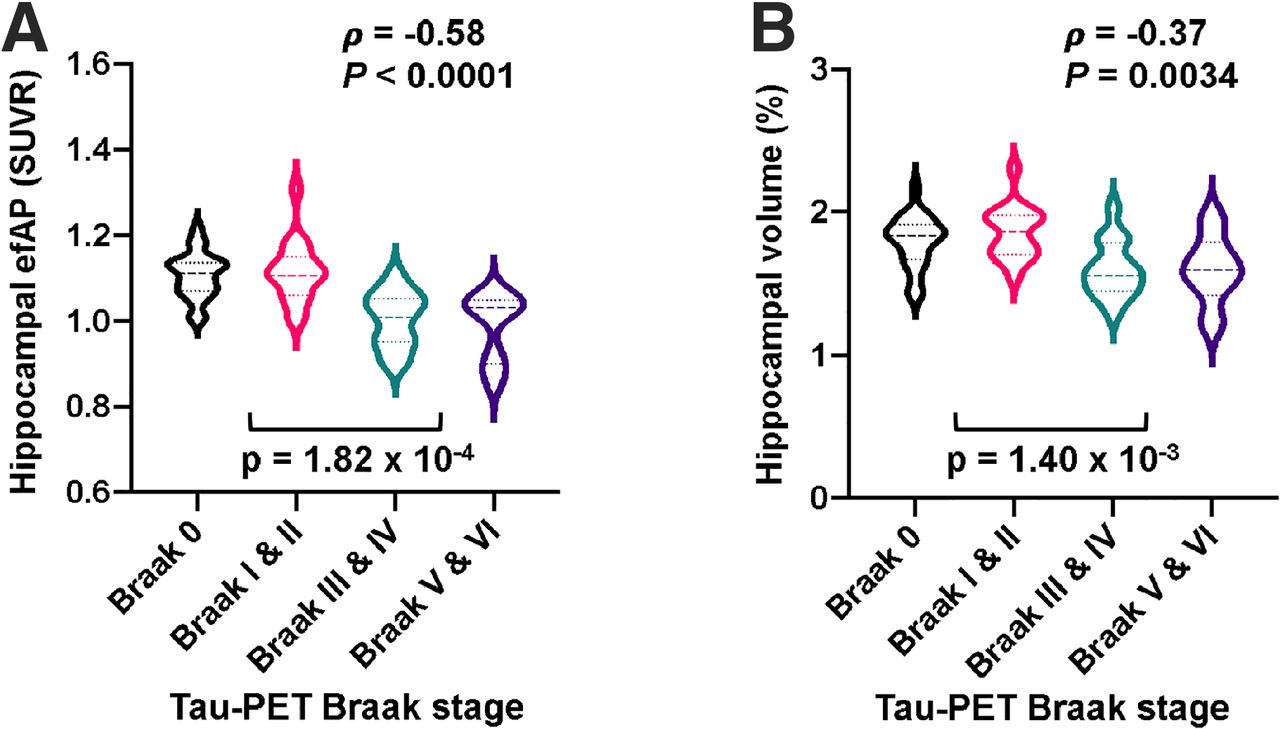
Amyloid-positive participants stratified by tau PET Braak stage and violin plots displayed for hippocampal efAP (A) and normalized hippocampal volume (B). Tau PET Braak stage shows stronger association with efAP than with volume within hippocampus. Spearman rank ρ was used to test for association across all groups, and Wilcoxon rank sum test was used to test for association between individual groups, with P < 0.05 denoted as significant.
Similarly, when efAP and volume were grouped as copredictors of tau positivity, efAP showed a significant, additive benefit to simply using hippocampal volume alone to predict tau positivity when utilizing tauopathy summary ROI (Δ standardized net benefit, 0.3472; P = 0.0070) but not when utilizing Braak stage III or greater positivity (Δ standardized net benefit, 0.0998; P = 0.38).
DISCUSSION
Hippocampal efAP, a biomarker related to flow during the early frames of dynamic amyloid PET, correlates with tau PET in amyloid-positive individuals. Hippocampal efAP shows promise for predicting tau pathology measured with 18F-flortaucipir PET and—in predicting tau pathology—provides significant, additive utility over hippocampal volume alone. The use of efAP could add specificity to the assessment of AD with amyloid PET and allow a more comprehensive neuroimaging examination.
Our cross-sectional retrospective analysis demonstrated a strong, significant association between hippocampal efAP and tau PET Braak stage (Fig. 6A). Our results also showed that hippocampal efAP had strong discriminatory performance in assessing tau positivity at the optimal cutoff, based on the maximum Youden index (22), whether using either a validated tauopathy measure (15) or Braak staging. For instance, hippocampal efAP had a high PPV (93%) and moderate NPV (72%) in amyloid-positive individuals, compared with the tauopathy summary measure with 18F-flortaucipir PET. The SUVR threshold for tau positivity (1.22) used in this study was based on the previously conducted study at the Charles F. and Joanne Knight Alzheimer Disease Research Center (15). This SUVR threshold may vary with the population and PET study parameters but likely will fall within a fairly narrow range based on studies by other groups, which reported optimal cutoffs ranging from 1.23 to 1.27 (26–28).
Among the 79 target ROIs evaluated for efAP, the hippocampus provided the strongest predictive power for tau positivity. Identification of the hippocampus as the most accurate target ROI for efAP was somewhat surprising, as the precuneus and posterior cingulate gyrus show hypometabolism (29) and hypoperfusion (30) early in the course of AD. Previous research has explored mainly direct, one-to-one regional correlations between 18F-FDG PET and tau PET (12,13,31) and between 18F-FDG PET and perfusion (9–11,32), and it is recognized that spatial differences exist between 18F-FDG and tau PET (31), such as in the hippocampus, where hypometabolism does not correlate well with tau pathology (12). Alternative methods for estimating perfusion from dynamic amyloid PET exist, such as pharmacokinetic modeling (11,33). In particular, Joseph-Mathurin et al. noted that pharmacokinetics-derived R1 values from 11C-Pittsburgh compound B spatially correlated with 18F-FDG PET but that early-frame intervals did not (33).
We found that the optimal early-frame time window started at 5% of peak cerebral cortex activity and ended at 180 s after injection. Importantly, efAP was found to be relatively stable up to 6 and 10 min, with small reductions in AUC. Our results were similar to another 18F-florbetapir study that evaluated the performance of early-frame dynamic amyloid PET imaging compared with 18F-FDG PET, in which the 1- to 6-min time window provided the best surrogate for perfusion based on 18F-FDG PET (32). Several other studies that used 11C-Pittsburgh compound B instead of 18F-florbetapir showed similar results (6,10,11,34). One of these studies, in particular, corroborated our results by finding that a shorter interval, specifically 20–130 s after injection, best discriminated between AD patients and controls even though with 18F-FDG PET a longer interval correlated better (10). Our efAP method focused on quantitative analysis rather than visual interpretation, and it is possible that a longer interval would be more suitable for visual analysis by reducing image noise.
Reduction in hippocampal volume, as measured by MRI, has been robustly validated and remains one of the core biomarkers in AD because of strong evidence supporting its diagnostic and prognostic value (2,35). In our present study, decreases in both hippocampal efAP and hippocampal volume were shown to be inversely correlated with tau PET Braak staging. On the basis of the tauopathy summary measure, hippocampal efAP was a better predictor of tau positivity than was hippocampal volume measurement alone, with additive benefit. A trend toward better performance with hippocampal efAP than with hippocampal volume (P = 0.12) was observed for Braak stage III or higher but did not reach statistical significance. The relatively small number of participants with elevated tau in Braak ROI III or higher (n = 21) prevents a definitive conclusion regarding the additional value of hippocampal efAP versus hippocampal volume for individual Braak stages.
Our work has limitations that are important to address in future work. Our study population included a large proportion of amyloid-positive subjects who were cognitively normal or had mild cognitive impairment. Our efAP results, including the optimal brain ROI for efAP measurement, may be different in individuals with more advanced AD. For the hippocampal efAP analysis, we chose to focus on amyloid-positive subjects because 18F-flortaucipir is best suited for imaging the pathologic form of tau that is deposited in AD. Our evaluation of the amyloid-negative subjects was more limited because this group is potentially heterogeneous and is not expected to have many individuals positive for tau based on 18F-flortaucipir PET. The PET tracer injection technique was not optimized for the early-frame measurement of efAP. Although exclusion criteria did help by removing subjects if the bolus perfusion phase was inadequate based on their time to peak (>150 s), the time to peak for included subjects still varied widely, from 45 to 150 s. Our findings suggest that efAP was not highly sensitive to differences in the rate of bolus delivery, but future studies would benefit from a more standardized injection technique.
CONCLUSION
We have shown that efAP acquired concurrently with a standard amyloid PET study is a strong predictor of tau pathology in amyloid-positive individuals. Successful development of this approach has the potential to provide information on both amyloid and tau pathology in a single PET session, which may reduce imaging costs and the burden on patients and their families.
DISCLOSURE
This work was supported by National Institutes of Health grants P20AG068024, RF1AG059009, and T32GM008361; the Medical Science Training Program, the Alzheimer Drug Discovery Foundation, and the Department of Radiology at the University of Alabama at Birmingham. Tammie Benzinger is funded by NIH grants P50AG005681, P01AG003991, P01AG026276, UF01AG032438, R01AG05326, RF1AG053550, R01AG054567, and R01AG052550. John Morris is funded by NIH grants P50AG005681, P01AG003991, P01AG026276, and UF01AG032438. The recruitment of participants and their clinical characterization and neuroimaging were supported by NIH grants P50AG05681, P01AG03991, and P01AG026276. Avid Radiopharmaceuticals, which is a wholly owned subsidiary of Eli Lilly (18F-florbetapir and 18F-flortaucipir imaging), provided the 18F-florbetapir doses and partial support for 18F-florbetapir scanning through an investigator-initiated research grant awarded to Washington University (John Morris and Tammie Benzinger); provided technology transfer; and provided precursor for 18F-florbetapir. Jonathan McConathy has declared a relationship with Eli Lilly and Avid, to which he provides consulting and from which he receives research support. No other potential conflict of interest relevant to this article was reported.
ACKNOWLEDGMENTS
Data used in the preparation of this article were obtained from the Charles F. and Joanne Knight Alzheimer Disease Research Center at the Washington University in St. Louis and are available on request (https://knightadrc.wustl.edu/). 18F-flortaucipir was produced under a material transfer agreement between Washington University and Avid Radiopharmaceuticals.
KEY POINTS
QUESTION: Do the first few frames after tracer injection on dynamic amyloid PET predict tau pathology on tau PET in amyloid-positive participants?
PERTINENT FINDINGS: This retrospective study showed that decreased activity in the hippocampus as measured with efAP predicts tau pathology on tau PET in amyloid-positive individuals.
IMPLICATIONS FOR PATIENT CARE: Our findings show that efAP may facilitate prediction of tau status from an amyloid PET study and provide a more comprehensive neuroimaging assessment of cognitive impairment, with increased specificity for AD.
Footnotes
Published online May 28, 2021.
- © 2022 by the Society of Nuclear Medicine and Molecular Imaging.
REFERENCES
- Received for publication August 27, 2020.
- Revision received April 23, 2021.


