


Abstract
Neuroendocrine neoplasms (NENs) constitute a heterogeneous group of tumors arising in various organs and with a large span of aggressiveness and survival rates. The Ki-67 proliferation index is presently used as the key marker of prognosis, and treatment guidelines are largely based on this index. 3′-deoxy-3′-18F-fluorothymidine (18F-FLT) is a proliferation tracer for PET imaging valuable in the monitoring of disease progression and treatment response in various types of cancer. However, until now only data from 10 patients with NEN were available in the literature. The aim of the present study was to investigate 18F-FLT PET as a prognostic marker for NENs in comparison with 18F-FDG PET and Ki-67 index. Methods: One hundred patients were PET-scanned with both 18F-FLT and 18F-FDG within the same week, and the prognostic value of a positive scan was examined in terms of progression-free survival (PFS) and overall survival (OS). The correlation between the Ki-67 index and 18F-FLT uptake was also investigated. Results: Thirty-seven percent of patients had a positive 18F-FLT PET scan, and 49% had 18F-FDG PET–positive foci. Patients with a high 18F-FLT uptake had a significantly shorter OS and PFS than patients with low or no 18F-FLT uptake. No correlation was found between Ki-67 index and 18F-FLT uptake. In a multivariate analysis 18F-FLT, 18F-FDG, and Ki-67 all were significant prognostic markers of PFS. For OS, only 18F-FDG and Ki-67 remained significant. Conclusion: 18F-FLT PET has prognostic value in NEN patients but when 18F-FDG PET and Ki-67 index are also available, a multivariate model revealed that 18F-FLT PET only adds information regarding PFS but not OS, whereas 18F-FDG PET remains predictive of both PFS and OS. However, a clinically robust algorithm including 18F-FLT in addition to 18F-FDG and Ki-67 could not be found. Accordingly, the exact role, if any, of 18F-FLT PET in NENs remains to be established.
Neuroendocrine neoplasms (NENs) include a diversity of tumors derived from various organ systems, in particular the intestinal tract, pancreas, and lungs (1–3). Thus, the clinical course and prognosis of the disease can vary substantially. The treatment options are likewise multiple. Guidelines for diagnosis and therapy are based on tumor origin and histologic grading (4–12). At present, a key factor in the characterization of NEN is the Ki-67 proliferation index. The clinical course is associated with this index, and the treatment strategies are chosen accordingly (13,14). Determination of Ki-67 index requires tissue from the resected tumor or in nonresectable cases an invasive core biopsy.
Recently, 18F-FDG PET demonstrated strong prognostic value in NENs, which may even exceed the value of the Ki-67 index and other traditional markers such as plasma chromogranin A or the presence of liver metastases (15).
The radiolabeled thymidine analog 3′-deoxy-3′-18F-fluorothymidine (18F-FLT) is a tracer used for PET imaging of proliferation (16,17). 18F-FLT is trapped inside the cells after phosphorylation by thymidine kinase-1. Thymidine kinase-1 is upregulated during the S-phase of cell proliferation as a key enzyme in the DNA salvage pathway, hence although 18F-FLT is not incorporated into DNA, it represents an indirect measurement of proliferation (16,17). 18F-FLT PET could be considered a noninvasive Ki-67 index (18) and might add valuable information about tumor aggressiveness and prognosis. The value of 18F-FLT PET in the diagnosis and treatment of other cancer forms has been extensively evaluated, and in general the background uptake is high in the liver, bone marrow, and renal system, limiting the use in these organs (19). 18F-FLT PET has been used in pulmonary lesions to differentiate malignant from benign disease (20,21) and to stage non–small cell lung cancer (22,23). 18F-FLT PET has also been reported of diagnostic value in brain and breast cancer and in the evaluation of early response to chemotherapy in several types of cancer (24–30).
Until now, the prognostic value of 18F-FLT PET has not been described in NEN. The aim of the present prospective study was therefore to investigate 18F-FLT PET as a prognostic marker for NENs in comparison with Ki-67 index and 18F-FDG PET.
MATERIALS AND METHODS
Patients
From 2011 to 2013, 103 consecutive patients were prospectively enrolled in the study at the European Neuroendocrine Tumor Society (ENETS) European Center of Excellence for Treatment of Neuroendocrine Neoplasms in Copenhagen. Inclusion criteria were histologically verified NEN and presence of a primary tumor or metastatic disease at enrollment. All patients were scheduled for an 18F-FLT PET and 18F-FDG PET scan within the same week. One hundred patients completed both scans. Patient characteristics are shown in Table 1. Approximately 80% had tumors in the gastroenteropancreatic system, and 7% were lung NENs. The group described as others consisted of 3 patients with NENs derived from the stomach, 4 from the urogenital system, and 1 from the ovaries. In the group of patients with unknown primary tumor, the NEN diagnosis was based on biopsies from liver metastasis in 4 patients, lymph node metastasis in 3 patients, and bone metastasis in 1 patient.
Characteristics of Study Group of 100 NEN Patients Scanned with Both 18F-FLT and 18F-FDG PET
The results of the PET scans were masked to the patients and their clinicians, and during follow-up the patients were treated according to standard care and guidelines based on the routine CT and somatostatin receptor imaging performed (4–12,31). CT results from the routine follow-up, described by an expert in radiology, were used to determine progression according to RECIST (32). The diagnostic CT scan from the 18F-FLT PET scan was used as baseline, and progression-free survival (PFS) was calculated as the time from the 18F-FLT PET scan to the first CT scan hereafter showing progression or if the patient died. Patients without progression were censored at the time of their latest CT scan, whereas patients still alive in the overall survival (OS) assessment were censored at a cutoff date of June 27, 2015.
The regional scientific ethical committee approved the study (H-3-2011-092). A written informed consent form was obtained from all the participants.
18F-FLT and 18F-FDG PET
18F-FLT was synthesized on a TRACERlab MX Synthesizer (GE Healthcare) using 3-N-Boc-5′-O-dimethoxytrityl-3′-O-nosylthymidine as a precursor. 18F-FLT cassettes and reagents were purchased from ABX GmbH. The radiochemical purity of 18F-FLT was 99.5% (97.7%–100%). 18F-FDG was produced as a part of the routine production for clinical 18F-FDG PET scans. The radiochemical purity of 18F-FDG was 99.3% (98.4%–99.7). For 18F-FLT, the patients received 5 MBq/kg and the mean injected dose was 328 MBq (206–473 MBq); for 18F-FDG, patients received 4 MBq/kg and the mean injected dose was 303 MBq (179–444 MBq). Images were acquired at 1 h after injection after resting. Patients were positioned with arms above the head and scanned from forehead to mid thigh, 2–3 min per bed position depending on body mass index. The PET/CT scans were obtained on a Biograph 40 or 64 PET/CT scanner (Siemens Medical Systems). CT in combination with 18F-FLT PET was performed as contrast-enhanced scans of diagnostic quality with intravenous and oral contrast medium. The CT scans of the 18F-FDG PET/CTs were low-dose CTs to minimize the radiation burden. The CT data were used for attenuation correction of the PET images. PET, CT, and fused images were reconstructed in all 3 planes for analysis on the Siemens Leonardo workstation using TrueD software. Experts in nuclear medicine and radiology analyzed all images in consensus. Pathologic foci were reported, and tracer accumulation was quantified as the SUVmax in the tumor tissue. If no tracer accumulation was seen, the scan was reported as PET negative.
Ki-67 Immunohistochemical Determination
Ki-67 was detected with a monoclonal antibody MIB1 (DAKO) using the manufacturer’s guidelines. The Ki-67 index was calculated as the mean percentage of cells with nuclear labeling in 20 hot spot areas and was measured as part of the clinical routine. Additional staining on existing paraffin-embedded histologic tissue was done if possible for patients without existing Ki-67 measurements. The median time between the Ki-67 measurements and the 18F-FLT scan was 351 d (interquartile range, 104–754 d), and none of the biopsies for Ki-67 measurement were guided by 18F-FLT/18F-FDG PET images. For patients with more than one Ki-67 measurement, the one obtained closest to the 18F-FLT scan was chosen and if more simultaneous Ki-67 indices existed the highest was chosen. Three patients without existing Ki-67 did not have tissue left for Ki-67 staining. The tumors were classified according to the classification from the World Health Organization (WHO) from 2010 for NEN of the gastrointestinal system into grade G1, Ki-67 ≤ 2%; G2, Ki-67 3%–20%; and G3, Ki-67 > 20% (33), including the lung NENs as suggested by Rindi et al. (34), although this is controversial.
Statistics
PFS and OS were chosen as endpoints to establish the prognostic value. The sample size was chosen on the basis of the observed event rates in a previous study of the prognostic value of 18F-FDG PET in NEN patients. A 1-y follow-up among 100 patients in that study was sufficient to detect significant differences in PFS and OS among groups and perform multivariate analysis of PFS including 3–4 variables (15). 18F-FLT and 18F-FDG PET data were reported as negative or positive scans. Furthermore, the patients with high 18F-FLT SUVmax (above median) were compared with patients with lower SUVmax (below median) or negative scans. Ki-67 index classified the patients into the WHO groups (G1, G2, and G3). Probabilities of PFS and OS were analyzed by the method of Kaplan and Meier, and differences between groups were tested by the log-rank test. Hazard ratios (HRs) were calculated by the Cox proportional hazards regression analysis. The multivariate analyses of independent prognostic factors were performed using stepwise backward elimination of variables with a P value above 0.05. The statistical analyses were performed using SPSS version 22 (IBM SPSS Statistics, IBM Corp.). Survival curves were created in Prism version 6 (Graph Pad Prism Inc.). The significance level was set at a P value of 0–05.
RESULTS
The results of the 18F-FLT and 18F-FDG PET scans in relation to tumor type and Ki-67 index are shown in Table 2.
Distribution of 18F-FLT, 18F-FDG, and Ki-67 in 100 NEN Patients
Thirty-seven patients (37%) were 18F-FLT PET–positive. Forty-nine patients (49%) were 18F-FDG PET–positive. Twenty-nine patients (29%) were positive on both the 18F-FLT and the 18F-FDG PET scans, 8 were only 18F-FLT–positive, and 20 were only 18F-FDG–positive. Thus, 57 patients (57%) were positive on at least one of the scans and 43% were negative on both.
An example of a patient with an 18F-FLT PET–positive focus in the cervical spine negative on the 18F-FDG PET scan is shown in Figure 1. Figure 2 shows a patient with an intestinal focus positive on both the 18F-FLT and the 18F-FDG scan. In Figure 3, an intestinal focus is seen only by 18F-FDG (and the diagnostic 68Ga-DOTATOC scan) but not on 18F-FLT.
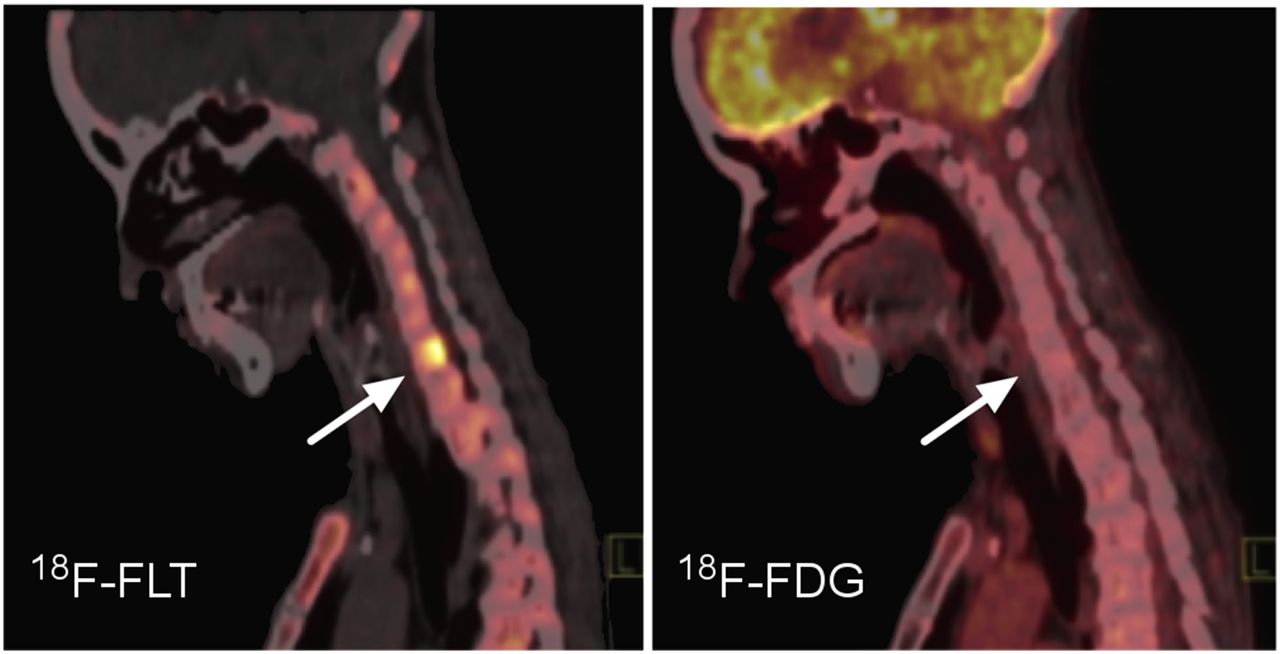
Sagittal image of head and neck in a patient with small bowel neuroendocrine tumor and metastases to lymph nodes and bone. On 18F-FLT PET (left), a focus with high uptake is seen in cervical spine. 18F-FDG PET (right) is without pathologic foci, and only high physiologic uptake in brain is seen.

Whole-body fused 18F-FLT or 18F-FDG PET and CT as well as axial PET/CT images of intestinal tumor (arrow). Gray scale images: PET alone showing additional foci on 18F-FDG PET (lower) compared with 18F-FLT PET (upper).

Transversal PET/CT fused images of 3 different PET scans in the same patient. 18F-FLT PET (left) does not show intestinal focus (arrows) found on 18F-FDG PET (middle) and 68Ga-DOTATOC (right). Whole-body PET images on top are 18F-FDG and in the middle maximum-intensity projections for 18F-FLT scan (left) and 68Ga-DOTATOC scan with physiologic uptake in pituitary gland (right).
Somatostatin receptor scans were positive in 86 of the patients and negative in 14. No significant differences were seen in 18F-FLT or 18F-FDG positivity in these groups. Thus, 38% (33/86) and 28% (4/14) were 18F-FLT–positive, and 48% (41/86) and 42% (6/14) were 18F-FDG–positive.
Ninety-seven patients could be categorized according to Ki-67 index, and a slightly higher percentage of the G3 patients were positive in both the 18F-FLT and the 18F-FDG PET scans. Ki-67 index did not correlate to 18F-FLT (data not shown). A comparison of only Ki-67 indices obtained within 1 y from 18F-FLT scans also did not reveal any correlation.
18F-FLT PET–positive versus –negative scans showed no relation to prognosis. However, both PFS and OS were significantly shorter in patients with an 18F-FLT SUVmax above the median value (FLThigh) than in patients with values below median or negative scans (FLTlow) (Figs. 4A and 4B).
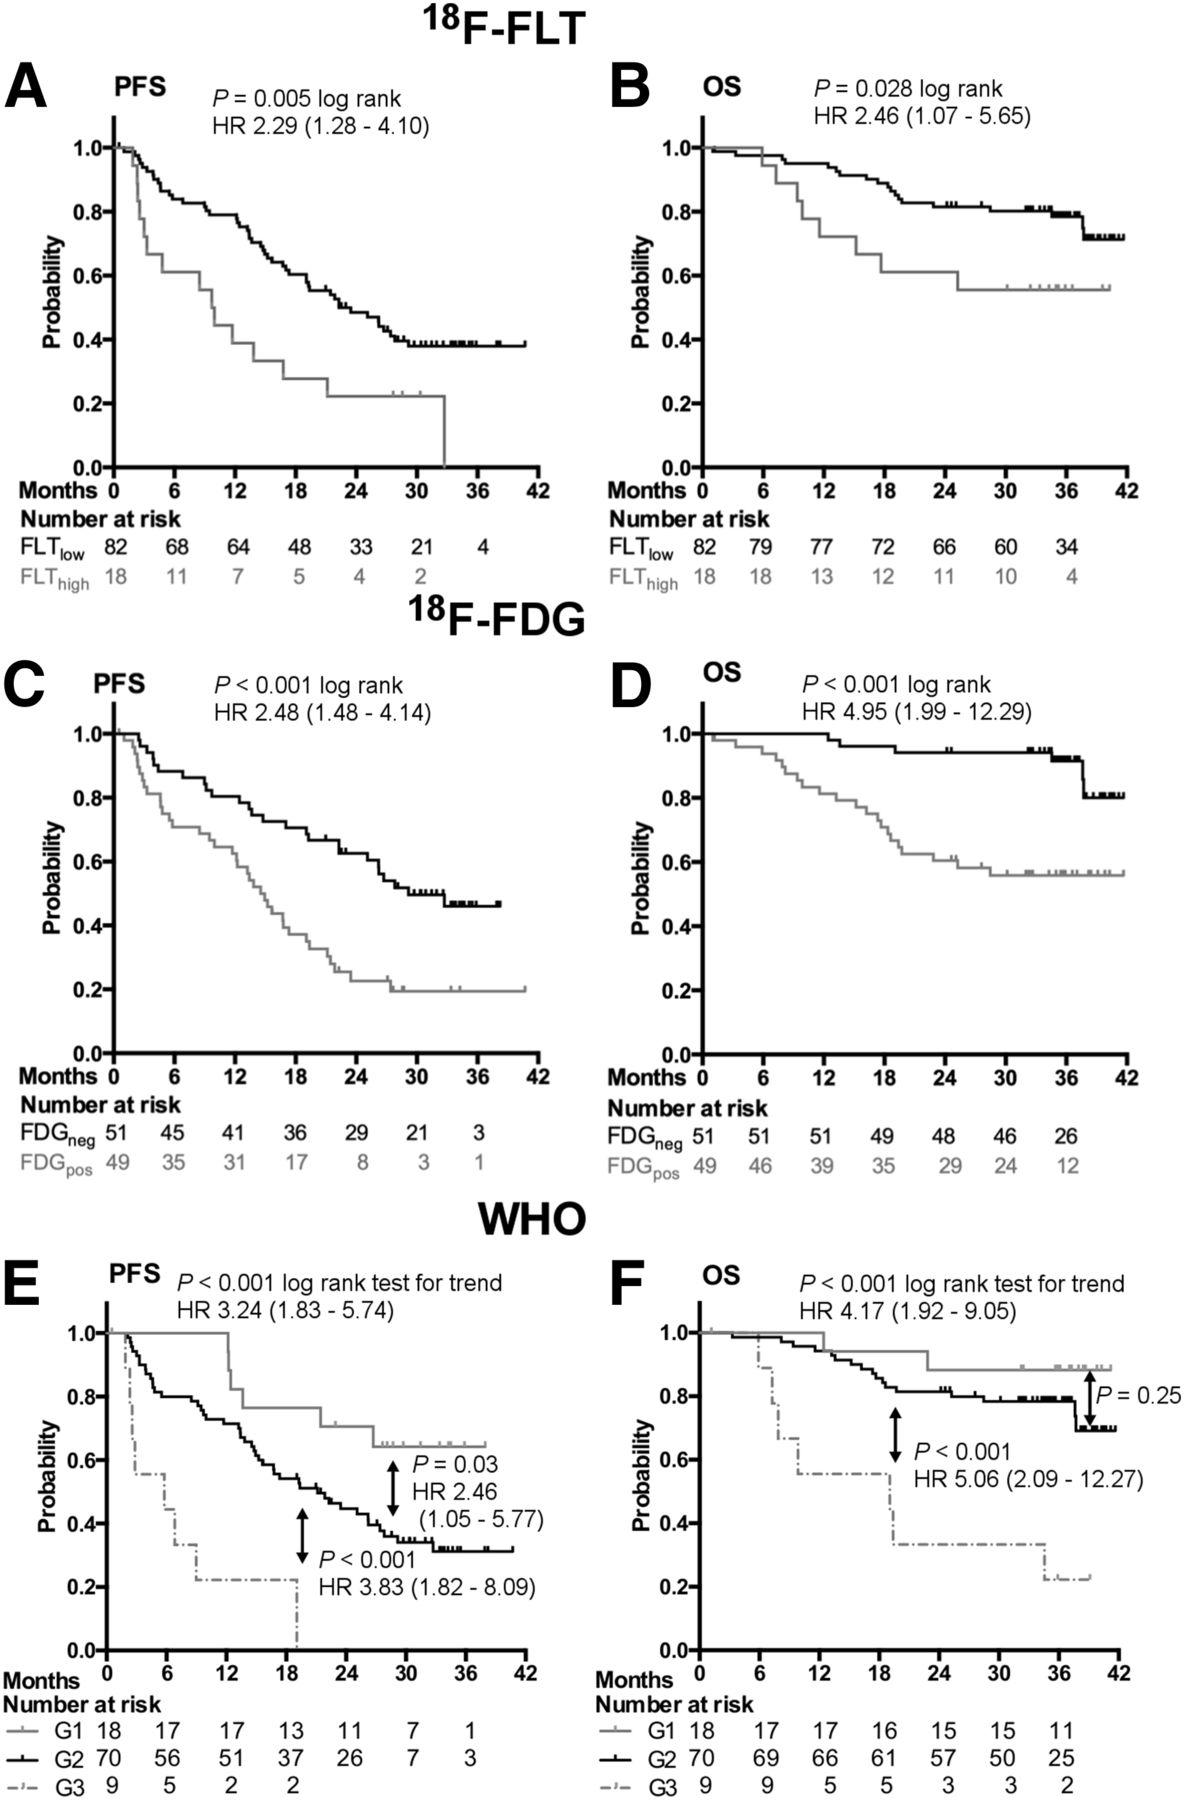
PFS and OS according to results of 18F-FLT PET (A and B; n = 100); 18F-FDG PET (C and D; n = 100); and WHO groups G1, G2, and G3 (E and F; n = 97).
Patients with a positive 18F-FDG PET scan (FDGpos) also had a significantly worse prognosis than patients with a negative 18F-FDG PET (FDGneg) scan (Figs. 4C and 4D).
PFS and OS for patients in the 3 Ki-67 index–based groups are shown in Figures 4E and 4F. A significantly worse prognosis was found with increasing Ki-67 index. Pairwise comparison showed that G1 and G2 groups were significantly different in this cohort of patients only for PFS but not for OS. The highly proliferative G3 group, however, differed significantly from the G2 group both with regard to PFS and OS. HRs and P values are shown in the figures.
Looking exclusively at the G1 and G2 groups of patients (Fig. 5), both 18F-FLT and 18F-FDG stratified these patients into an FLTlow and an FDGneg group with significantly longer PFS than the FLThigh and the FDGpos counterparts (Figs. 5A and 5C). For OS (Figs. 5B and 5D), only a positive 18F-FDG PET scan was significant.

PFS and OS according to results of 18F-FLT PET (A and B) and 18F-FDG PET (C and D) in 88 patients with G1 and G2 NENs.
No significant differentiation was gained by subdividing the 18F-FDG groups further into FLThigh or FLTlow (data not shown).
Sixty events of progression and 26 events of death were observed in the 97 patients with available Ki-67 values. Thus, multivariate Cox proportional hazards regression analysis of 3 parameters was considered permissible.
In the multivariate analysis applied to PFS with 18F-FLT and 18F-FDG and WHO groups entered into the model, all 3 parameters remained significant predictors of PFS, with HRs of 2.0 (P = 0.028), 2.2 (P = 0.006), and 3.5 (P < 0.001), respectively. In the same analysis applied to OS (n = 97; 26 events), only 18F-FDG and WHO groups remained significant predictors, with HRs of 4.2 (P = 0.002) and 3.9 (P = 0.001), respectively.
In G1 and G2 patients only, 51 events of progression and 19 deaths were observed. When multivariate analysis was applied to 18F-FLT, 18F-FDG, and WHO groups, only 18F-FDG grouping remained significant, with HRs of 2.4 (P = 0.003) for PFS and 5.3 (P = 0.001) for OS.
With only 9 patients with G3 tumors included in our study, isolated evaluations within this group are speculative. However, FLThigh scans detected the 3 patients with the shortest time to progression (P = 0.002).
DISCUSSION
To our knowledge, this is the first study to describe 18F-FLT PET in a large group of patients with NEN. In a previous study using 18F-FLT PET in 10 patients with well-differentiated gastroenteropancreatic NENs, all were negative (35). It was suggested that this might be due to the low proliferation rate of the tumors. However, in our study 18F-FLT PET was positive in more than one fourth of the patients with Ki-67 ≤ 2 and in 37% of all the patients. The simultaneous 18F-FDG PET scan was positive in 49% of the patients, and the proportions both positive on 18F-FLT PET and 18F-FDG PET increased with increasing proliferation index. For NENs, Ki-67 index is a key factor in the treatment decision algorithms as outlined in the ENETS guidelines (5–12). This is based on the fact that Ki-67 index correlates well with both PFS and OS in NEN patients, which we confirmed in the present study. However, a noninvasive way to assess tumor proliferation and predict prognosis would be preferable especially when repeated examinations are needed to monitor disease. Also a noninvasive method for whole-body evaluation would elegantly circumvent sampling error as seen with biopsies. Surprisingly, we found no correlation between 18F-FLT PET SUVmax and Ki-67 index in our study. Conflicting results have been seen in studies investigating the correlation between Ki-67 and 18F-FLT uptake. In a meta-analysis by Chalkidou et al. (18), it was concluded that a significant correlation between 18F-FLT uptake and Ki-67 was more often found in studies comparing SUVmax with a mean or average value of Ki-67 instead of Ki-67 max (hotspot). Furthermore, best correlations were seen when surgical samples were examined for Ki-67 rather than biopsies (18). Our study was not designed to obtain the optimal conditions for correlations between 18F-FLT uptake and Ki-67 index. Neuroendocrine tumor centers determine the Ki-67 index in NENs by counting in hotspot areas and often only from small biopsies. In contrast, the 18F-FLT uptake is calculated from the whole tumor and because of tumor heterogeneity the Ki-67 index might not represent and characterize the whole tumor well enough (36). Also, if hotspot-determined Ki-67 should correspond with SUVmax of 18F-FLT PET, the latter would need to have a much higher resolution. A prerequisite to expect good correlation between the Ki-67 index and 18F-FLT uptake is that biopsies or surgical specimens used for Ki-67 should be from the same site from which 18F-FLT uptake is measured. None of the tissue samples for Ki-67 determination were taken guided by the 18F-FLT PET images, and in only 4 of the 37 18F-FLT PET–positive patients the 18F-FLT SUVmax focus was at the site of Ki-67 indexing. We believe this lack of concordance is the main reason that we found no correlation between Ki-67 and 18F-FLT uptake. We used Ki-67 data from tissue samples taken before initiation of the present study, for some patients several years. However, if we restricted correlation analysis to Ki-67 samples taken within 1 y of the 18F-FLT scan, we did still not find any correlation pointing to the topographic explanation being most important.
We found that a high level of 18F-FLT uptake was a negative prognostic marker for both PFS and OS. A positive 18F-FDG PET scan likewise predicted a worse outcome. HR for OS was higher for 18F-FDG than for 18F-FLT. The prognostic value of 18F-FDG has earlier been shown (15) and is now confirmed in the present series of NEN patients. The WHO 3-tier system based on Ki-67 index as a prognostic factor was also confirmed although no significant difference was found for OS between the G1 and G2 groups. It has been discussed whether the G3 and maybe also the low-proliferative patients could be further stratified to individualize the treatment more. We included only 9 patients with G3 tumors in our study, which made further evaluation of this group difficult and speculative. Nevertheless, FLThigh scans significantly detected the 3 patients with the shortest time to progression, and OS was also significantly different for the FLThigh group. No such correlation was found for 18F-FDG in the G3 group, possibly indicating that 18F-FLT is superior to 18F-FDG in the stratification of G3 patients.
In the 88 G1 and G2 patients, WHO groups, 18F-FLT, and 18F-FDG all significantly identified patients with longer PFS whereas only 18F-FDG–positive scans could predict a group with significantly shorter OS. Likewise, only 18F-FDG remained significant in the multivariate analysis including WHO groups, 18F-FDG, and 18F-FLT for both PFS and OS. In this large low-proliferative group, 18F-FDG is a stronger predictor than the existing WHO groups and 18F-FLT cannot challenge 18F-FDG in this.
In the multivariate analysis of all patients, including the G3, 18F-FLT PET remained an independent predictor of PFS also when WHO groups and 18F-FDG were included in the model, indicating that 18F-FLT adds additional information about prognosis on top of that from the WHO group and 18F-FDG. However, a simple clinical algorithm using all 3 parameters could not be found. In the multivariate analysis of OS, only WHO group and 18F-FDG remained significant predictors. However, it is crucial to emphasize that especially in NEN patients, who have a long life expectancy despite disseminated disease, PFS is an important parameter for monitoring disease control.
As only 37% of the patients had a positive 18F-FLT PET and additional foci were often seen on other scans (Figs. 2 and 3), it is not justified to use 18F-FLT PET as a primary diagnostic tool in NEN patients. The high background uptake of 18F-FLT in the liver challenges the imaging of liver metastases, and PET-based somatostatin receptor ligand tracers are far superior in that respect (37,38). A rather high percentage (71%) of lung NENs had positive 18F-FLT PET scans. A preclinical study showed that an early 18F-FLT PET scan could predict the effect of everolimus treatment in human xenograft NENs of lung origin in mice (29). Further studies are needed to show whether 18F-FLT might have particular value in NENs from specific sites or for monitoring of treatment response in 18F-FLT–positive NENs.
CONCLUSION
18F-FLT PET has prognostic value in NEN patients and predicts both OS and PFS. However, if 18F-FDG PET and Ki-67 index are also available, 18F-FLT PET added independent information regarding PFS but not regarding OS, whereas 18F-FDG PET had independent information regarding both PFS and OS. However, a clinically robust algorithm including 18F-FLT in addition to 18F-FDG and Ki-67 could not be found. Accordingly, the exact role, if any, of 18F-FLT PET in NENs remains to be established.
DISCLOSURE
The costs of publication of this article were defrayed in part by the payment of page charges. Therefore, and solely to indicate this fact, this article is hereby marked “advertisement” in accordance with 18 USC section 1734. The following funds are gratefully acknowledged: The National Advanced Technology Foundation, Danish Cancer Society, The Lundbeck Foundation, Novo Nordic Foundation, The Danish Medical Research Council, Svend Andersen Foundation, Research Council for Strategic Research, Rigshospitalets Research Council, the Research Foundation of the CapitalRegion, the Arvid Nilsson Foundation, the John and Birthe Meyer Foundation, and A. P. Moeller Foundation. The funders had no role in study design, data collection and analysis, decision to publish, or preparation of the manuscript. No other potential conflict of interest relevant to this article was reported.
Acknowledgments
We gratefully acknowledge the staff at the Department of Clinical Physiology, Nuclear Medicine and PET for their help in providing the PET tracers and performing the PET/CT studies.
Footnotes
Published online Jul. 28, 2016.
- © 2016 by the Society of Nuclear Medicine and Molecular Imaging, Inc.
REFERENCES
- Received for publication March 12, 2016.
- Accepted for publication June 27, 2016.


Jump to section
Related Articles
Cited By...
- Prospective Phase II Trial of Prognostication by 68Ga-NOTA-AE105 uPAR PET in Patients with Neuroendocrine Neoplasms: Implications for uPAR-Targeted Therapy
- Somatostatin Receptor Imaging and Theranostics: Current Practice and Future Prospects
- Dual PET Imaging in Bronchial Neuroendocrine Neoplasms: The NETPET Score as a Prognostic Biomarker
- 18F-FDG PET is Superior to WHO Grading as a Prognostic Tool in Neuroendocrine Neoplasms and Useful in Guiding PRRT: A Prospective 10-Year Follow-up Study
- 64Cu-DOTATATE PET/CT and Prediction of Overall and Progression-Free Survival in Patients with Neuroendocrine Neoplasms
- Circulating tumor cells and miRNAs as prognostic markers in neuroendocrine neoplasms