


Abstract
18F-fluoroethyl-SPA-RQ (18F-FE-SPA-RQ) was recently developed as a radioligand for the measurement of neurokinin 1 (NK1) receptor with PET. In this study, we used 18F-FE-SPA-RQ with PET to visualize and quantify NK1 receptor in the human brain. Methods: PET scans were performed on 7 healthy men after intravenous injection of 18F-FE-SPA-RQ. Binding potential (BPND) was calculated by the indirect kinetic, simplified reference tissue model (SRTM), and ratio methods. The indirect kinetic method was used as the gold standard method and was compared with the SRTM method, with scan times of 180, 270, and 330 min, and with the ratio method, with time integration intervals of 120–180, 210–270, and 300–330 min. The cerebellum was used as the reference brain region. Results: Regional radioactivity was highest in the caudate head and putamen; mid level in the parahippocampus, cerebral cortex, and thalamus; and lowest in the cerebellum. BPND values by the indirect kinetic method were 3.15 ± 0.36, 3.11 ± 0.66, 1.17 ± 0.25, and 0.46 ± 0.14 in the caudate, putamen, parahippocampal region, and thalamus, respectively. For cerebral cortical regions, BPND values by the indirect kinetic method were 0.94 ± 0.23, 0.82 ± 0.15, 0.76 ± 0.15, and 0.69 ± 0.16 in the occipital, temporal, frontal, and anterior cingulate cortices, respectively. BPND values by the SRTM and ratio methods were in good agreement with those by the indirect kinetic method (r = 0.94–0.98). Conclusion: The regional distribution of 18F-FE-SPA-RQ was in agreement with previous PET studies and postmortem studies of NK1 receptor in the human brain. The ratio method will be useful for clinical research of psychiatric disorders, for the estimation of NK1 receptor without arterial blood sampling and long dynamic PET.
Tachykinins are a family of neuropeptides that serve as neurotransmitters in the central nervous system (CNS) and peripheral nervous system (PNS). Three major mammalian tachykinins—substance P (SP), neurokinin A, and neurokinin B—are known, and they share a consensus amino acid sequence (-Phe-X-Gly-Leu-Met-NH2) in their carboxyl terminals (1–4). SP is a well-characterized neuropeptide, participating in neurotransmission by itself or synergistically with other neurotransmitters such as monoamines, acetylcholine, and glutamate in nerve terminals. Receptors for tachykinins—termed neurokinin 1 (NK1), NK2, and NK3 receptors—have been identified (all are G protein–coupled 7-transmembrane receptors) and demonstrated to selectively show high affinity for SP, neurokinin A, and neurokinin B, respectively (5,6). NK1 receptors are expressed in both CNS and PNS, whereas NK2 and NK3 receptors are expressed in PNS and CNS, respectively (7,8). SP and NK1 receptors have been shown to play significant roles in pain (9), emesis (10), neuroinflammation (11,12), vasomotor control, and many gastrointestinal functions. Because the SP–NK1 system is localized in brain regions (such as the striatum, amygdala, hypothalamus, raphe nucleus, and periaqueductal gray matter) that are involved in the regulation of affective behavior (7,8), the activity of the central tachykinergic pathway mediated by SP and NK1 receptors is conceived to be mechanistically related to psychiatric conditions such as depression and anxiety disorder. Recent clinical trials of the NK1 receptor antagonist aprepitant have shown that the blockade of SP is a highly effective strategy for the prevention of chemotherapy-induced nausea and vomiting (13–15). Aprepitant was recently registered worldwide, and it represents an improvement for antiemetic control during chemotherapy. Early clinical studies also suggested that aprepitant may have antidepressant activity, implicating SP in the modulation of mood and anxiety in humans (16,17). However, recent results from phase III clinical trials indicate that aprepitant is not effective for the treatment of depression (18).
A recently developed nonpeptide PET tracer that can permeate the blood–brain barrier, [18F-2-fluoromethoxy-5-(5-trifluoromethyl-tetrazol-1-yl)-benzyl]([2S,3S]2-phenyl-piperidin-3-yl)-amine) (18F-SPA-RQ) (19), has been proven to bind to NK1 receptors with high affinity and selectivity and applied to in vivo imaging of human brains (20–22).
18F-fluoroethyl-SPA-RQ (18F-FE-SPA-RQ) was recently developed as a radioligand for the measurement of NK1 receptors (23). It is the fluoroethyl analog of 18F-SPA-RQ and was designed for brain imaging with reduced radioactive accumulation in bone by slowing the rate of defluorination. 18F-FE-SPA-RQ has higher affinity for NK1 receptors than does 18F-SPA-RQ (human NK1 inhibitory concentration of 50% [IC50] = 17 and 67 pM for 18F-FE-SPA-RQ and 18F-SPA-RQ, respectively), and a small-animal PET study has been performed using 18F-FE-SPA-RQ (24). In the present study, we aimed to quantify NK1 receptor binding in the human brain using 18F-FE-SPA-RQ with arterial blood sampling and also to validate noninvasive methods for the quantification without arterial blood sampling.
MATERIALS AND METHODS
Subjects
A total of 7 healthy male subjects (age range, 20–31 y; mean ± SD, 24.6 ± 4.0 y) participated in this study. All subjects were free of any somatic, neurologic, or psychiatric disorders, and they had no history of current or previous drug abuse. After we described the study to the participants, written informed consent was obtained. The study was approved by the Ethics and Radiation Safety Committee of the National Institute of Radiologic Sciences, Chiba, Japan.
Radioligand
The NK1 receptor antagonist SPA-RQ (molecular weight, 450M) was labeled with the positron emitter 18F (half-life, 109.8 min). Details of the precursor compound, radiosynthesis, and quality control were described previously (23,25). Briefly, 18F-FCH2CH2Br was prepared from 18F-F− and 2-bromoethyl triflate and purified by distillation. 18F-Fluoroalkylation of the deprotonated phenolic hydroxyl group in the precursor with FCH2CH2Br in dimethyl formamide was performed at 120°C for 10 min. The resultant 18F-FE-SPA-RQ was purified by preparative high-performance liquid chromatography (HPLC). The final product was formulated in saline solution (10 mL) containing polysorbate 80 (75 μL).
PET Procedure
A PET scanner system (ECAT EXACT HR+; CTI-Siemens) was used for all subjects, and a head restraint was used to minimize head movement. A transmission scan for attenuation correction was performed using a 68Ge–68Ga source, and a dynamic PET scan was performed after a 1-min intravenous slow-bolus injection of 210.2–228.8 MBq (221.6 ± 6.7 MBq) of 18F-FE-SPA-RQ. Specific radioactivity of 18F-FE-SPA-RQ was 281.8–487.7 GBq/μmol (355.6 ± 68.7 GBq/μmol). Brain radioactivity was measured from 0 to 90 min (1 min × 10, 2 min × 15, 5 min × 10), from 120 to 180 min (5 min × 12), from 210 to 270 min (5 min × 12), and from 300 to 330 min (5 min × 6). MR images of the brain were acquired with a 1.5-T MRI scanner (Gyroscan NT; Philips). T1-weighted images were obtained at 1-mm slices.
Arterial Blood Sampling and Metabolite Analysis
To obtain the arterial input function, arterial blood samples were taken manually 49 times during PET. Each of the blood samples was centrifuged to obtain plasma and blood cell fractions, and the concentrations of radioactivity in whole blood and in plasma were measured.
The percentage of unchanged 18F-FE-SPA-RQ in plasma was determined by HPLC in 29 of the total blood samples. Acetonitrile was added to each plasma sample, and samples were centrifuged. The supernatant was subjected to radio-HPLC analysis using an XBridge Prep C18 column (Waters) (mobile phase, 6:4 90% acetonitrile:50 mM phosphoric acid). The plasma input function was defined as the radioactivity of plasma multiplied by the percentage of unchanged radioligand. Plasma protein binding was not determined in the present study.
Regions of Interest
All MR images were coregistered to the PET images using a statistical parametric mapping (SPM2) system. Regions of interest were drawn manually on summated PET images with reference to coregistered MRI and were defined for the caudate head; putamen; parahippocampal region; occipital, temporal, frontal, and anterior cingulate cortices; thalamus; and cerebellum, according to our previous study (26). The parahippocampal region included the hippocampus, posterior part of the parahippocampal gyrus, and uncus including the amygdala. Regional radioactivity was calculated for each frame, corrected for decay, and plotted versus time.
Kinetics Model of 18F-FE-SPA-RQ
The 3-compartment model (3CM) with 4 first-order rate constants was used to describe the kinetics of 18F-FE-SPA-RQ in the brain. The 3 compartments were defined as follows: CP, the radioactivity concentration of unchanged radioligand in plasma (arterial input function); CND, the radioactivity concentration of nondisplaceable radioligand in the brain, including nonspecifically bound and free radioligand; and CS, the radioactivity concentration of radioligand specifically bound to receptors. The rate constants K1 and k2 represent the influx and efflux rates for radioligand diffusion through the blood–brain barrier, respectively. The rate constants k3 and k4 are the radioligand transfers between the compartments for nondisplaceable and specifically bound radioligand. This model can be described by the following equations: CT(t) is the total radioactivity concentration in a brain region measured by PET.
Calculation of 18F-FE-SPA-RQ Binding Potential (BPND)
18F-FE-SPA-RQ binding was quantified by the indirect kinetic, simplified reference tissue model (SRTM), and ratio methods. In these methods, 18F-FE-SPA-RQ bindings were expressed as BPND relative to nondisplaceable bindings (27). We used the cerebellum as reference brain region because of its negligible NK1 receptor density (20,22,28). For these analyses, the software package PMOD (PMOD Technologies) was used.
Indirect Kinetic Method.
With the cerebellum as reference region, BPND can be expressed as: where VT(regions) is the total distribution volume (= [K1/k2][k3/k4 + 1]) of target regions and VT(cerebellum) is that of the cerebellum. K1, k2, k3, and k4 values were determined by nonlinear least-squares curve fitting to the regional time–activity curves. In this analysis, blood volume (Vb), which depends on the first-pass extraction fraction of the tracer, was assumed to be 0.04 mL/mL, with use of the radioactivity of whole blood to diminish the influence of the tracer remaining in the blood. In this study, the indirect kinetic method was used as the gold standard method (29).
SRTM Method.
Assuming that both target and reference regions have the same level of nondisplaceable binding, the SRTM can be used to describe time–activity data in the target region as follows (30): where R1 is the ratio of K1/K1′ (K1, influx rate constant for the brain region; K1′, influx rate constant for the reference region), CR(t) is the radioactivity concentration in the reference region (cerebellum), and * denotes the convolution integral. Using this method, 3 parameters (R1, k2, and BPND) were estimated by a nonlinear curve-fitting procedure. Scan data up to 180, 270, and 330 min were used.
Ratio Method.
In the ratio method, BPND can be expressed as: where AUC(regions) is the area under the time–activity curve of target regions and AUC(cerebellum) is the time–activity curve of the cerebellum. The integration intervals of 120–180, 210–270, and 300–330 min were used.
RESULTS
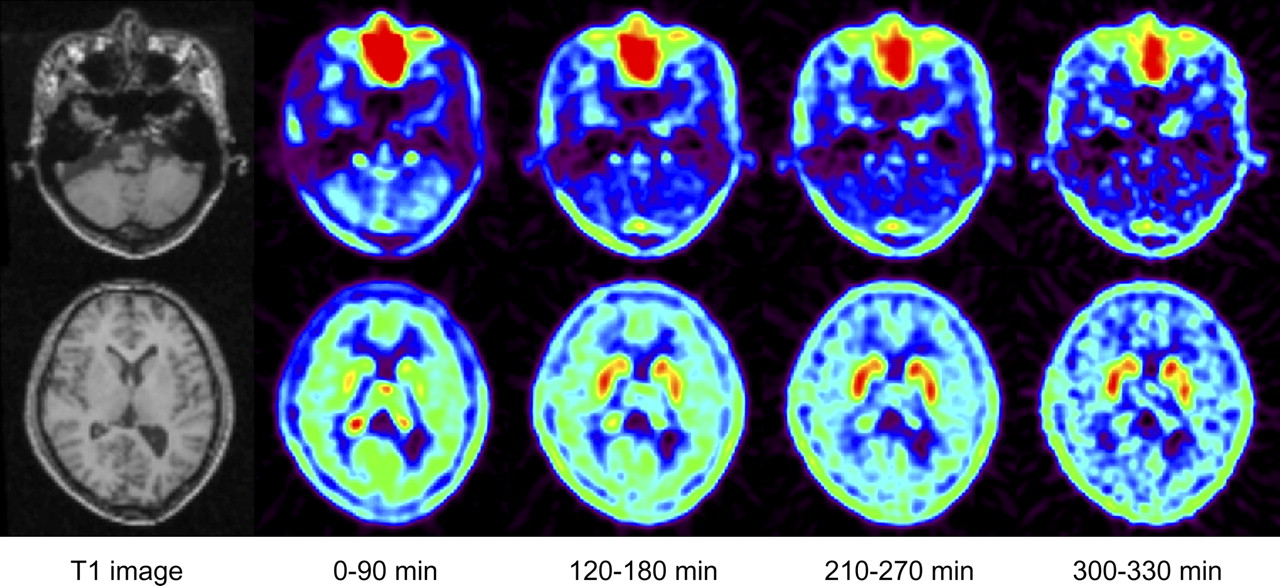
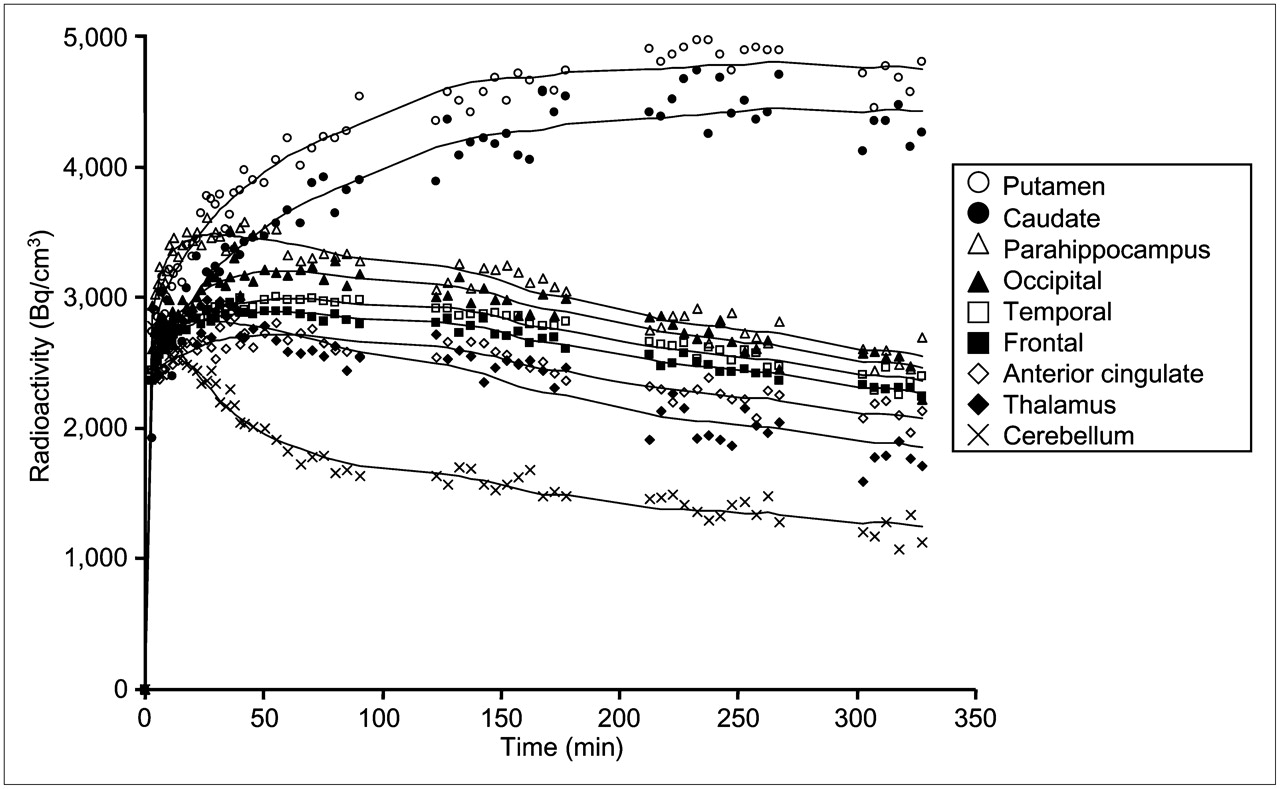
Typical summated PET images of 4 time periods and T1-weighted MR images are shown in Figure 1. Typical time–activity curves in the brain showed that regional radioactivity was highest in the putamen and caudate (Fig. 2). The next highest region was the parahippocampus, followed by the cerebral cortices and thalamus. Among cerebral cortices, the occipital cortex showed the highest radioactivity. Lowest radioactivity was shown in the cerebellum.

Typical summated PET images of 18F-FE-SPA-RQ and T1-weighted MR images. Upper row shows slice of cerebellum, and lower row shows slice of caudate, putamen, and cerebral cortex.

Typical time–activity curves of 18F-FE-SPA-RQ in brain. Time–activity curves of all regions could be described by 3CM.
In this study, the fraction of unchanged 18F-FE-SPA-RQ in plasma could not be measured by HPLC analysis in 3 of the 7 subjects because of low radioactivity in blood samples. So, the average of the fractions of unchanged 18F-FE-SPA-RQ in plasma of the other 4 subjects was used for these 3 subjects for the indirect kinetic method. The average percentage fraction of unchanged 18F-FE-SPA-RQ in plasma of the 4 subjects was 90.0% ± 2.9% at 3 min, 80.9% ± 6.1% at 10 min, 32.0% ± 3.9% at 90 min, 23.9% ± 5.3% at 180 min, 14.6% ± 5.9% at 270 min, and 14.4% ± 7.3% at 330 min (Fig. 3).

Average percentage of unchanged 18F-FE-SPA-RQ in plasma. Bars indicate 1 SD.
The rate constants for the 9 regions determined by the kinetic approach using the 3CM with arterial input function are shown in Table 1. For the cerebellum, the 2-compartment model (2CM) without specific binding compartment was also used. Akaike information criteria of the 3CM were significantly lower than those of the 2CM in the cerebellum (290 ± 28 vs. 409 ± 25, P < 0.0001; paired t statistics).
Rate Constants for Each Brain Region Determined by Kinetic Approach Using 3CM with Arterial Input Function
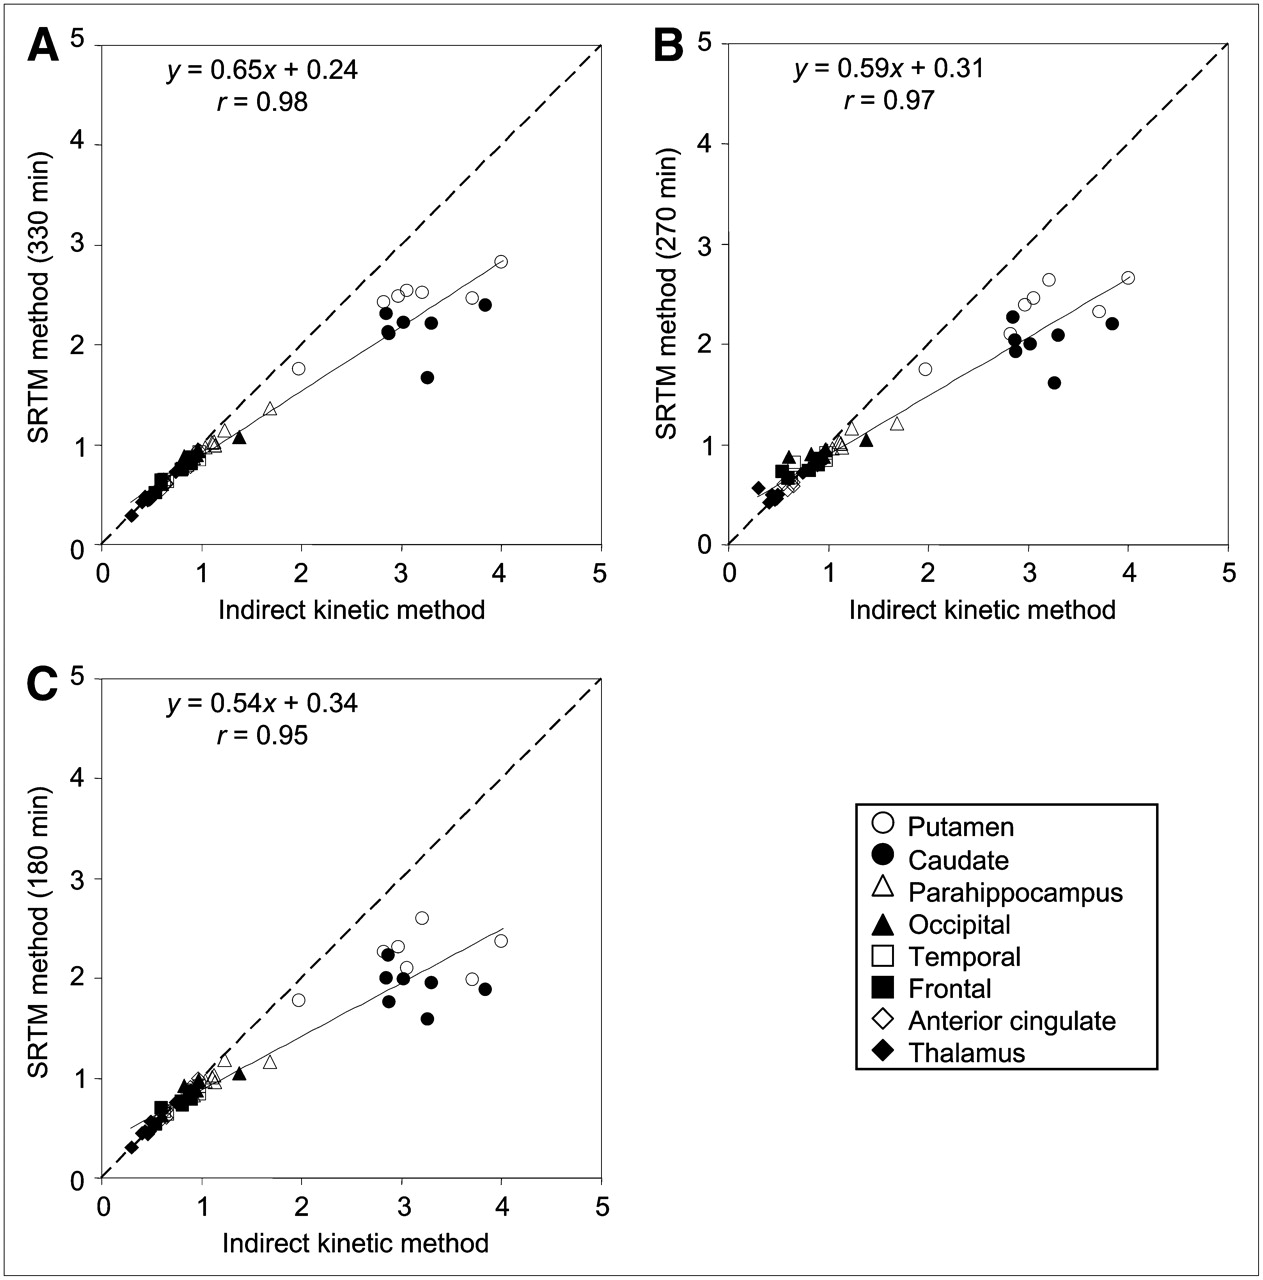
The BPND values of all brain regions calculated by all methods are shown in Table 2. BPND values by the SRTM method with a scan time of 330 min showed the best correlation with those by the indirect kinetic method (r = 0.98) (Fig. 4A). The SRTM method with scan times of 270 and 180 min and the ratio method with time integration intervals of 300–330, 210–270, and 120–180 min were also in good agreement with the indirect kinetic method in BPND values (r = 0.94–0.97) (Figs. 4B and 4C; Fig. 5). The BPND values, except for the caudate and putamen by the SRTM method with a scan time of 180 min and the ratio method with a time integration interval of 120–180 min, were also in good agreement with the indirect kinetic method (SRTM, r = 0.94, y = 0.70x + 0.20; ratio method, r = 0.94, y = 0.69x + 0.20).

Correlation among BPND values in all brain regions estimated by indirect kinetic and SRTM methods, with scan times of 330 (A), 270 (B), and 180 (C) min.

Correlation among BPND values in all brain regions estimated by indirect kinetic and ratio methods, with time integration intervals of 300–330 (A), 210–270 (B), and 120–180 (C) min.
BPND Values for Each Brain Region with All Methods
The BPND values determined by the kinetic approach (= k3/k4) were 4.39 ± 3.93 and 5.94 ± 3.44 in the caudate and putamen. Those in the other regions were much smaller and varied widely.
DISCUSSION
After the intravenous injection of 18F-FE-SPA-RQ, radioactivity was highest in the caudate and putamen and lowest in the cerebellum. BPND values in the caudate and putamen by the indirect kinetic method were 3.15 ± 0.36 and 3.11 ± 0.66, respectively, almost the same as in the previous human PET study with 18F-SPA-RQ (3.08 ± 0.48 in the caudate and 3.71 ± 1.00 in the putamen) (22). The parahippocampal region and cerebral cortices showed moderate uptake, and the occipital cortex showed the highest uptake among the cerebral cortices. The thalamus showed relatively low uptake. The uptake shown in these regions was almost the same order of progression as the uptake in previous human PET studies with 18F-SPA-RQ and autoradiographic studies of the human postmortem brain (20,22,28). In a previous autoradiographic study using 3H-GR205171, the maximum number of binding sites for NK1 receptor in the striatum was 6 times as much as in the cortex (31), a result in accordance with the BPND values in these regions in the present study.
In this study, the indirect kinetic method with arterial blood sampling was used as the gold standard method, because BPND determined by the kinetic approach as k3/k4 showed wide variation. The BPND values in all brain regions determined by the SRTM method (with scan times of 330, 270, and 180 min) and by the ratio method (with time integration intervals of 300–330, 210–270, and 120–180 min) were in good agreement with those determined by the indirect kinetic method. Although good correlations were observed in BPND values among the methods, BPND was underestimated in the caudate and putamen using the SRTM and ratio methods. The underestimations of BPND were 32% and 34% in the caudate and 22% and 16% in the putamen for the SRTM method (with a scan time of 330 min) and the ratio method (with a time integration interval of 300–330 min), respectively. More underestimation was observed in the caudate and putamen with the shorter scan time in the SRTM method and with the earlier time integration interval in the ratio method. The reason might be that striatal radioactivity in some subjects did not reach a peak by 330 min. However, the BPND values of the other regions calculated by the SRTM method (with a scan time of 180 min) and the ratio method (with a time integration interval of 120–180 min) were not greatly underestimated, indicating that the scan time can be shortened to 180 min. Although the indirect kinetic method was considered as the gold standard method, it required a long PET time and arterial blood sampling, an invasive procedure sometimes difficult for patients with psychiatric disorders. The ratio method, which does not require a long PET scanning time and arterial blood sampling, would surely be preferable for clinical investigations. The ratio method, with a time integration interval of 300–330 min, seemed most suitable because the correlation coefficient with the indirect kinetic method was highest and the slope of the regression line was nearest to 1.
The time–activity curves in the cerebellum were well described by the 3CM rather than the 2CM. Similar results were reported for several PET radioligands, with the kinetics in the reference region also being evaluated using the 3CM (29,32,33). The results could be explained if the cerebellum would contain specific bindings for NK1 receptors. However, previous autoradiographic studies showed that the density of NK1 receptors in the cerebellum was low (22), and a previous PET study with 18F-SPA-RQ showed that there was no change in the cerebellar signal before and after high blocking doses of the NK1 receptor antagonist aprepitant (20). Another possible explanation for the results was that the compartments of free and nonspecific binding might have been separated by the kinetic analysis. In addition, 18F-FE-SPA-RQ showed defluorination during the later scans, and bone uptake of 18F might influence the radioactivity in the cerebral cortex and cerebellum adjacent to the skull (although 18F-FE-SPA-RQ showed reduced radioactive accumulation in bone, compared with 18F-SPA-RQ (23)).
CONCLUSION
18F-FE-SPA-RQ is a suitable radioligand for PET measurement of NK1 receptors in the human brain. The 3CM could well describe the brain kinetics of 18F-FE-SPA-RQ. Because the ratio method does not require long scanning times and arterial blood sampling, this method would be useful for clinical research on psychiatric disorders.
Acknowledgments
We thank Dr. Fumitoshi Kodaka, Dr. Tatsui Otsuka, Katsuyuki Tanimoto, Takahiro Shiraishi, and Akira Ando for their assistance in performing the PET experiments at the National Institute of Radiological Sciences. We also thank Yoshiko Fukushima of the National Institute of Radiological Sciences for her help as clinical research coordinator. This study was supported by a consignment expense for the Molecular Imaging Program on Research Base for PET Diagnosis from the Ministry of Education, Culture, Sports, Science and Technology (MEXT), Japanese Government.
Footnotes
-
COPYRIGHT © 2008 by the Society of Nuclear Medicine, Inc.
References
- Received for publication May 14, 2008.
- Accepted for publication July 14, 2008.


Jump to section
Related Articles
Cited By...
- No citing articles found.