


Abstract
Planar γ-scintigraphy is often used to quantify pulmonary deposition patterns from aerosol inhalers. The results are quite different from those obtained using 3-dimensional PET and SPECT. The purpose of this study was to characterize the effects of scatter and tissue attenuation on the distribution of radiolabeled aerosol as measured by planar scintigraphy using Monte Carlo simulations. This study also investigated the applicability of a few correction methods used in inhalation studies. Methods: Body density maps were derived from CT scans. Regions of interest—lungs, major airways, and esophagus—were defined from the same CT volume. Two radioactivity source distribution patterns in the lung, uniform and nonuniform, were used. A Monte Carlo program, SIMIND, was used to generate anterior and posterior γ-images of the composed inhalation distributions for 2 energy windows, photopeak (127–153 keV) and scatter (92–125 keV). The effects of scatter and attenuation were estimated on the basis of the imaging components separated from the simulation. A scatter correction method and 2 attenuation correction methods, all applied to inhalation scintigraphy, were evaluated using the simulated images. Results: The amount of scatter ranges from 24% to approximately 29% in the lungs and from 29% to approximately 35% in the central (airway or esophagus) region on the planar images. Significant differences were found among regions and between source distributions (P < 0.05). The fraction k used for dual-energy–based scatter correction also varied and was found to be less than the commonly used k = 0.5. The simplified narrow-beam attenuation correction and the effective (broad-beam) correction methods were found to either under- or overcorrect the regional activities. Conclusion: The amount of scatter and tissue attenuation in the thorax region depends on source distribution and body attenuation. In applying planar scintigraphy for aerosol inhalation studies, it is difficult to obtain precise quantitative measurements because of the uncertainties associated with scatter and attenuation corrections. Accurate corrections require knowledge of both source and density distributions.
Nuclear imaging of radiolabeled aerosol drugs provides a unique in vivo measurement of the deposition of these inhaled particles. Among the nuclear imaging modalities, planar imaging has been used for inhalation studies for quite some time (1,2). However, there is an apparent difference in the distribution of similar drugs as measured by planar scintigraphy and 3-dimensional (3D) tomography. In a previous study (3), we compared planar γ-scintigraphy and PET measured aerosol lung depositions. A corticosteroid aerosol labeled with positron-emitting radionuclide was inhaled from a metered dose inhaler by healthy volunteers who were scanned by PET. On a following day, the volunteers inhaled the same aerosol drug labeled with 99mTc and were scanned by conventional gamma camera. Planar data analyses were done with scatter and attenuation corrections and compared with both PET and uncorrected planar γ-data. Although the results from the comparison study gave us some insights about the 2 imaging procedures and thus allowed general comparison, they fell short of pinpointing the quantitative difference between planar and tomographic imaging for 2 main reasons. First, there could be no guarantee that the 2 scans (planar and PET) acquired identical inhalations. The same volunteers were used and trained to reproduce inhalations by controlling the flow rate. The radiolabeled aerosol drugs were assayed to ensure that the canister was working properly during the study and to verify that the formulation tested met all manufacturing release specifications. Still, the 2 scans were performed on separate days. It would be extraordinary to have exactly matched deposition patterns, although the distributions are similar between the 2 inhalations. Second, components from nuclear imaging formation, scatter and attenuation, cannot be separated experimentally (4) and cannot be described analytically (5) for general situations in which the source distribution pattern is nonuniform and the attenuation medium is inhomogeneous. Consequently, we decided to use Monte Carlo simulation for the investigation in which all details of experiment can be precisely controlled.
The use of Monte Carlo calculations allows separation of primary and scattered photons in the projections. Furthermore, scatter images can be calculated for any arbitrary source distribution. An overview on the technique and related topics can be found in a recent review (6). As an alternative to the Monte Carlo techniques, other simulation work included a technique for simulating the point spread function (PSF) of gamma-camera images (7). In that study, the primary photon PSF was measured from a point source at different distances in the air and the scatter PSF was also assessed with different thicknesses of water that were fitted to a circularly symmetric biexponential function. Although this measurement-based simulation was intended to avoid complex computations associated with Monte Carlo simulation, it carried certain assumptions. Additional simplifications were made to speed up this measurement-based simulation further with more restrictions and approximations (8). The method was used to simulate planar gamma-camera images from the aerosol deposition pattern in the airway tree (9) and to evaluate the accuracy and precision of the lung aerosol deposition measurement at the same time (10). However, further investigation is required to show the applicability of this simulation methodology to more realistic distributions other than the phantom-type sets with assumptions of either uniform source distribution or homogeneous attenuation medium (e.g., water).
The effects of scatter and attenuation in the human body are complex, especially in the thorax region because of large variations in tissue density. Simplifications, though speedy, may not accurately reflect the true imaging process. Accordingly, the aim of this study was to investigate, in the context of measuring inhaled aerosol in the lung, the quantitative accuracy of planar γ-imaging using the state-of-art Monte Carlo simulation techniques. In addition, this study also evaluated scatter and attenuation correction methods commonly used for quantification in inhalation scintigraphy. Because of its relatively long scanning time, SPECT measurement would average certain biologic processes such as the clearance and absorption after aerosol lung inhalation. SPECT imaging was thus not investigated for inhalation studies.
MATERIALS AND METHODS
Monte Carlo Code
Several Monte Carlo codes are in the public domain. Some of them can be applied directly for calculations in medical physics and others need different degrees of adaptation. Andero and Ljungberg (11) have briefly reviewed these algorithms. One of them, SIMIND, which describes a clinical SPECT Anger camera system and can be easily modified for almost any type of calculation or measurement encountered in SPECT imaging, was selected for use in this study. SIMIND code was verified by experimental results (12–14) and was used successfully for validating correction methods (15–18). Among these studies, an important lung SPECT study compared the effect on the image homogeneity of 2 attenuation correction methods (17). The study also investigated the impact of parameters such as lung contour, body contour, lung density, and effective attenuation coefficient through a digital thorax phantom containing uniform activity distribution in the lung. That study thus served as guidance to our aerosol study. The simulation in SIMIND is based on sampling uniformly distributed random numbers to simulate photon emission and its different types of interactions through the object and the camera. Details of the program have been described (19). A brief summary of the code is given below.
The locations of the decays are sampled by the use of voxel-based source maps where the value of each voxel defines the number of photons emitted and the relative pixel indices define the location in a Cartesian coordinate. Emitted photons are then followed through the inhomogeneous voxel-based phantom (or body), either escaping from the phantom (or body) without interaction or scattered inside it. The inhomogeneous body volume consists of image matrices reflecting the density distribution and the corresponding attenuation coefficients are calculated by multiplying density with a mass-attenuation coefficient as a function of photon energy. In the phantom, bone and soft tissue can be distinguished and both Compton and coherent interactions are simulated according to the relative interaction probabilities for the body material. Because SIMIND uses variance techniques and forced detection with an associated history weight, the maximum order of scattering needs to be determined before the simulation (maximum order is set to 3 in this study). After leaving the computer phantom, the photons are forced in a direction toward the camera. The probability of passing through the collimator within an acceptance angle is calculated and the photons are followed further in the scintillation crystal until absorption or escape.
Because interactions are simulated also in the crystal, the centroid of the imparted energy is calculated to define the position of the event. The energy resolution is simulated by convolving the total imparted energy with an energy-dependent gaussian function. When the magnitude of the total imparted energy in the crystal at the end of a photon history is within a predefined energy window, the history weight is added to a projection matrix at a pixel position corresponding to the centroid of the imparted energy. SIMIND keeps track of whether the photon has been scattered in the phantom so that separate matrices for primary and scatter event can be created. The anterior and posterior projections to be simulated in this study can be generated at 0° and 180° of SPECT rotation, respectively.
Subjects
To be able to create clinically realistic source and phantom maps, 6 healthy, nonsmoking male volunteers (age range, 23–45 y; mean age, 31 y) participated in this study, which was approved by the Institutional Review Board (IRB) for Human Investigation of University Hospitals of Cleveland. All subjects provided written informed consent after the nature of the study was explained to them as mandated by the IRB.
CT Scan and Body Density
CT scanning was conducted using a spiral CT system (Somatom 4+B; Siemens Medical Systems, Inc., Iselin, NJ). CT scans from head to abdomen were obtained for each volunteer. The scanning procedure consisted of 3-mm collimation with a bed speed of 8 mm/s. Respiratory motion artifacts were eliminated by a single breath-hold for approximately 20 s depending on the longitudinal size of the lung. The whole acquisition was divided into 2 segments, 1 with breath-holding for the thorax region and 1 without breath-holding for the head. Images were reconstructed to a resolution of 0.976 mm/pixel in plane and a 4-mm interval between planes. CT data gave attenuation coefficients for x-ray radiation (approximately 70 keV). These CT numbers were transformed into a density map of the body with soft-tissue density scaled to 1.0 g/cm (20). Because the voxel-based approach (21) was adopted in SIMIND, it was not necessary to group image voxels in the body and sources into regional partitions or cells as required for use in other Monte Carlo simulations (22,23).
Regions of Interest and Source Maps
The 3D lung region was defined from the CT data using a semiautomatic technique called region growing (24). The remaining regions of interest (ROIs) were defined manually on the CT images. The central region consisted of major airways (trachea and main bronchi) and esophagus, which overlap each other in a front or rear projection from a planar camera and cannot be separated on planar images.
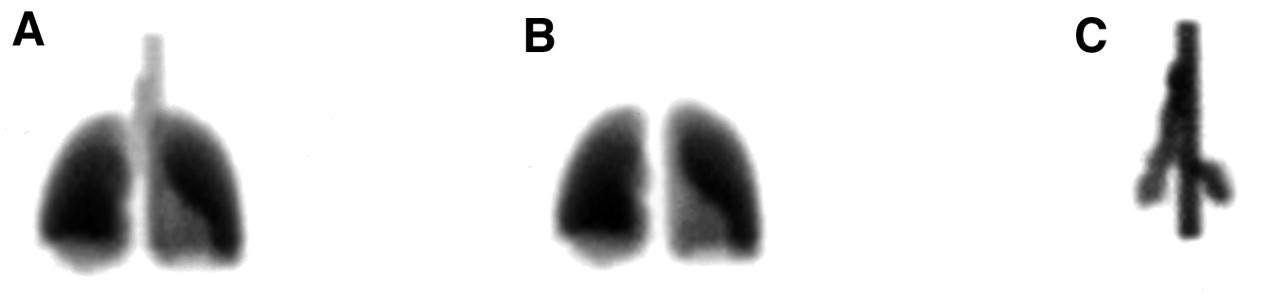
Two source distributions were composed for the simulations: uniform and nonuniform. The uniform source map was obtained by filling the regions with uniform activities as shown in Figure 1. The nonuniform source map was based on PET-measured 3D aerosol distributions for the same volunteers as those in a previous study (3). To create these nonuniform sources, CT and PET scans were aligned using anatomic landmarks and fiducial markers. For each source type, either the entire distribution or individual regional distribution can be obtained by using ROI boundaries to mask and select the desired activity patterns. Figure 1 shows a whole distribution and its regional components. Separate regional analysis is thus possible.

ROIs for aerosol study. (A) All regions combined. (B) Lungs. (C) Central regions (main airways and esophagus overlaid).
Simulated Camera System
The simulated system was based on a commercial camera (MultiSPECT II; Siemens Medical Systems, Inc., Hoffman Estates, IL) with a low-energy, all-purpose, parallel-hole collimator. The thickness of the NaI(TI) crystal is 0.95 cm with a field of view of 53.3 × 38.7 cm2. The planar image matrix size is 128 × 128. The pixel size is 0.479 × 0.479 cm2. The energy resolution at 140 keV is 10.5% (full width at half maximum), and the intrinsic spatial resolution is 0.46 cm. For each simulation run, 2 energy windows were applied: 127–153 keV and 92–125 keV. The first is the photopeak window around 140 keV for 99mTc. The second is the scatter window and is used for evaluating a scatter correction method. In each simulation, both anterior and posterior views were created with the distance between the center of the region and the camera face ranging from 16 to 20 cm depending on the size of the volunteer.
Inhalation Simulations
Simulation A.
The source distribution is “free-in-air” to simulate a study without effects caused by attenuation and scatter.
Simulation B.
The source distribution is inside the density map that has been converted from a CT scan. The primary and scattered photons were tallied in the 20% photopeak window (127–135 keV) of 99mTc.
Simulation C.
This study is the same as simulation B but with the energy window set to cover a part of the energy pulse-height distribution (92–125 keV) that consists of Compton scattered photons only.
All simulation calculations were performed on a Pavilion 4535 PC system (Hewlett-Packard, Roseville, CA) with about 20 million “forced-detection” photons per projection.
Data Analysis
Scatter Component and Correction.
For each inhalation simulated, planar images consisting of scattered photons and total (primary and scattered photons) are generated for each detector head and within each energy window. For the photopeak window, the ratio of scatter to total will indicate the fraction of the scattered photons on an acquired and uncorrected planar image from an inhalation of radiolabeled aerosols. Almost all photons in the scatter window are scattered, and they have been used to estimate the amount of scatter in the photopeak by the subtraction method as (25):
 Eq. 1
which states that a fraction, k, of the image from the scatter window Iscat can be subtracted from the image of the photopeak window Ipp to produce a scatter-corrected image Icorr. Because all images in Equation 1 are generated from simulations, we can determine the value of k for all source distributions and thereby evaluate this scatter correction method for aerosol inhalation studies. We calculate the value of k for each projection as well as the arithmetic mean of anterior and posterior projections.
Eq. 1
which states that a fraction, k, of the image from the scatter window Iscat can be subtracted from the image of the photopeak window Ipp to produce a scatter-corrected image Icorr. Because all images in Equation 1 are generated from simulations, we can determine the value of k for all source distributions and thereby evaluate this scatter correction method for aerosol inhalation studies. We calculate the value of k for each projection as well as the arithmetic mean of anterior and posterior projections.
Primary Photons and Attenuation.
Primary photons are obtained by subtracting the scatter image from the total image in the photopeak. We thus get an image affected only by attenuation of the primary photons as if the scatter correction were perfect. We can then assess the amount of attenuation by comparing the primary image with the true image that is without scatter and attenuation (from simulation A). Consequently, the attenuation correction factor (ACF) can be defined as:
 Eq. 2
for each pixel, or a region, or the entire image. Because the ACF is originally defined on the basis of the geometric mean (GM) of anterior and posterior images (26), all values of ACF in this study are calculated using GM images. The values of ACF for regions such as the lungs and central regions are calculated from the region-based component images (Fig. 1) for each volunteer and each source distribution. ACF is also useful for evaluating GM-based attenuation correction methods commonly used for aerosol inhalation studies. In a simplified correction method, a uniform source distribution is assumed in the lung and calculated independently of source distribution as [from Equation 5 in (26)]:
Eq. 2
for each pixel, or a region, or the entire image. Because the ACF is originally defined on the basis of the geometric mean (GM) of anterior and posterior images (26), all values of ACF in this study are calculated using GM images. The values of ACF for regions such as the lungs and central regions are calculated from the region-based component images (Fig. 1) for each volunteer and each source distribution. ACF is also useful for evaluating GM-based attenuation correction methods commonly used for aerosol inhalation studies. In a simplified correction method, a uniform source distribution is assumed in the lung and calculated independently of source distribution as [from Equation 5 in (26)]:
 Eq. 3
where L is the lung thickness and a and b are the anterior and posterior chest wall thickness, respectively. Also, simple geometry was used as the method originally proposed by assuming the chest wall thickness (a = b = 2 cm). The linear attenuation coefficients for chest wall tissue and lung tissue were μ1 = 0.151 cm−1 and μ2 = 0.038 cm−1, respectively (26). In addition to this simplified correction method, an effective attenuation correction method was also evaluated that has no prior scatter correction but uses a broad-beam attenuation coefficient of 0.12 cm−1 for water or soft tissue (27). In the evaluations, true values of ACF for narrow-beam and broad-beam attenuation corrections are calculated and compared with the corresponding correction methods.
Eq. 3
where L is the lung thickness and a and b are the anterior and posterior chest wall thickness, respectively. Also, simple geometry was used as the method originally proposed by assuming the chest wall thickness (a = b = 2 cm). The linear attenuation coefficients for chest wall tissue and lung tissue were μ1 = 0.151 cm−1 and μ2 = 0.038 cm−1, respectively (26). In addition to this simplified correction method, an effective attenuation correction method was also evaluated that has no prior scatter correction but uses a broad-beam attenuation coefficient of 0.12 cm−1 for water or soft tissue (27). In the evaluations, true values of ACF for narrow-beam and broad-beam attenuation corrections are calculated and compared with the corresponding correction methods.
RESULTS
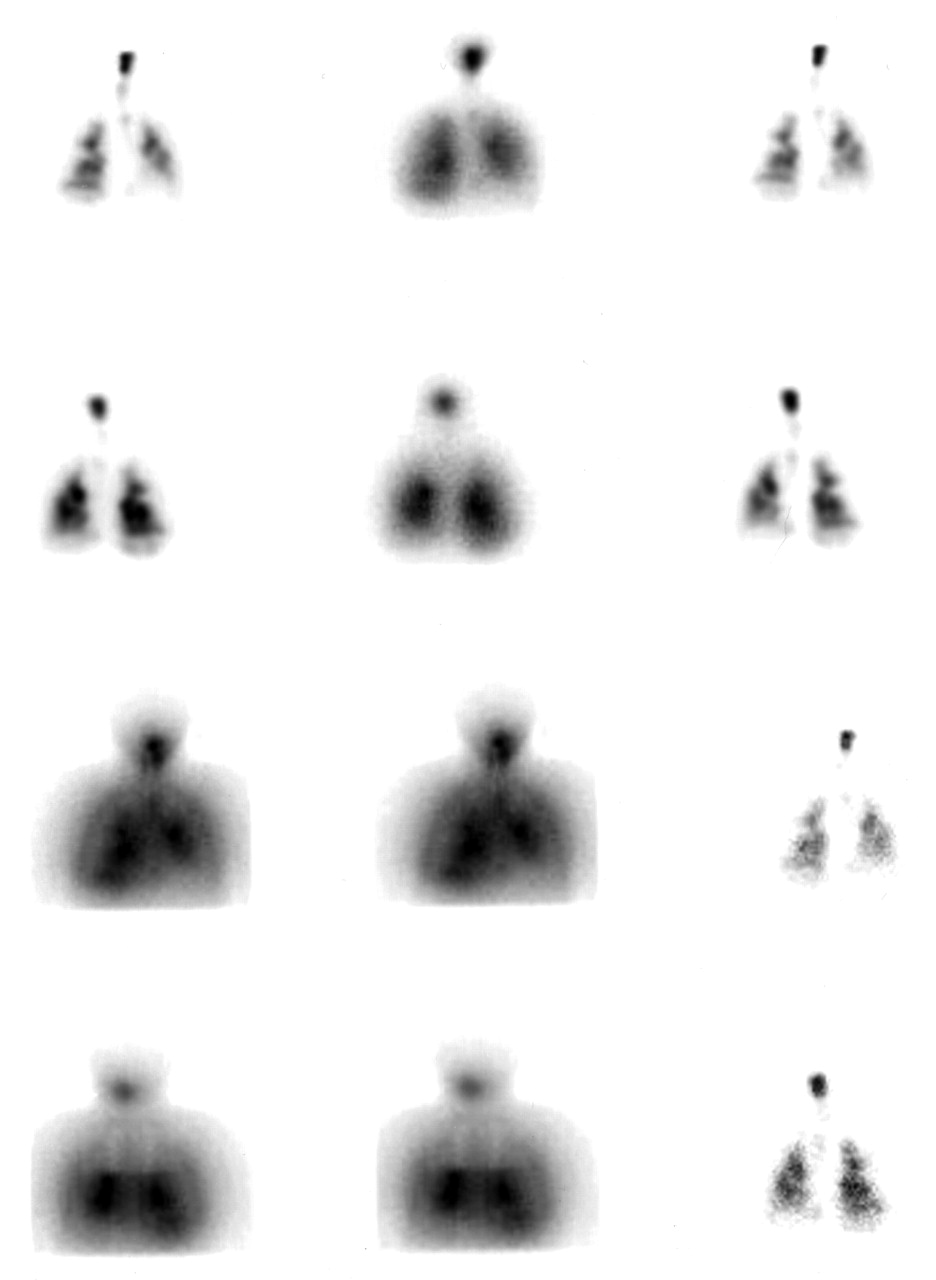
Planar γ-images of the 2 energy windows (photopeak, Compton scatter) were generated from uniform and nonuniform source maps for each volunteer. Figure 2 shows a set of images from 1 volunteer with nonuniform distribution.

Columns, left to right, are counts collected as total (primary and scatter), scatter, and in air (no scatter and attenuation). Upper 2 rows are anterior and posterior projections in photopeak window; lower 2 rows are in scatter window. Each image is normalized to its maximum value.
The ratios of scatter to total from the photopeak images of anterior and posterior projections were calculated for the lung and central regions and for source distributions as listed in Table 1 as means (with SDs, the same format for all tables) along with the arithmetic means from these 2 opposing projections. For the lungs, <30% of the photons in the acquired images were scattered at least once, and more scattered photons occurred in the central region and also in the posterior images. The amount of the scatter is different between lung and central regions for uniform and nonuniform source distributions. The differences are significant (2-way ANOVA; F > F0.05[1,23]). In addition, a paired t test showed that the difference in the amount of the scatter in the lung for uniform and nonuniform source maps is significant (P < 0.05). Figure 3 shows a typical display of scaled spectra for the total, primary, and scattered photons. The k values used for scatter correction of Equation 1 were also calculated on the basis of the known scattered photons in photopeak and Compton windows. The individual k value from each projection and the averaged k value from the 2 opposing projections are given in Table 2. The k values of the posterior images were always larger than those of the anterior images. The averaged values of k varied around 0.44 for the lung region and 0.40 for the central region.

Spectrum from projection. Outer envelop is total spectrum (solid line). Components are (from right) primary (not scattered [solid line]), first-order scatter (dotted line), second-order scatter (dashed line), and third-order scatter (dotted dashed line).
Amount of Scatter in ROIs Measured as Ratio of Scatter/Total Under Uniform and Nonuniform Radiolabeled Aerosol Distributions
Scatter Correction in ROIs Measured as Scatter Fraction Coefficient k Under Uniform and Nonuniform Radiolabeled Aerosol Distributions
True values of regional ACF were calculated for the 2 regions according to Equation 2 for narrow-beam attenuation and for uniform and nonuniform source maps and are listed in Table 3. Additional values of regional ACF are also listed in Table 3 for broad-beam attenuation, which were calculated using a slightly different equation from Equation 2 as:
 Eq. 4
Eq. 4
Attenuation in ROIs Measured as ACF for Narrow Beam Using Equation 2 and Broad Beam Using Equation 4 and Under Uniform and Nonuniform Radiolabeled Aerosol Distributions
ACF computed using Equation 4 can be used to validate the use of effective broad-beam attenuation coefficients for correcting the scatter and attenuation in 1 step. The amount of attenuation is different between lung and central regions for both uniform and nonuniform distributions (2-way ANOVA; F > F0.05[1,23]). However, the difference caused by source distributions (uniform and nonuniform) is not significant (P > 0.24) for this group of volunteers. Two GM-based attenuation correction methods are evaluated by calculating their ACF values according to Equation 3. For the narrow-beam attenuation correction with simplified body geometry, μwater = 0.151 cm−1 was used (26). For broad-beam attenuation correction, μwater = 0.12 cm−1 was used (27). The resultant values of ACF are listed in Table 4 and compared with the known values (from Table 3, relisted as validation references). A paired t test of the lung results showed that both corrections are significantly (P < 0.05) different from their reference values for the uniform source distribution. The simplified narrow-beam attenuation correction method undercorrected the activity in the lungs. The broad-beam (effective) correction method overcorrected the activity in the lungs but undercorrected the activity in the central region.
Validation of 2 Attenuation Correction Methods Under Uniform Aerosol Distribution by Comparing True Values from Table 3
DISCUSSION
Quantitative analysis of inhaled aerosol distribution in airways and lungs is critical to pulmonary and nuclear medicine studies. The quantitative results obtained by PET gave very different impressions of the distribution of an inhaled preparation compared with planar γ-scintigraphic results. Because different drugs, tracers, and formulations have been used in previous studies, it has not been possible to separate real differences in distribution from imaging artifacts and tracer differences. In this study, an in-depth investigation was conducted using Monte Carlo techniques. It was also designed as a validation for commonly used correction methods applied to planar γ-images.
The amount of scatter computed as the ratio of scattered and total photons in the photopeak window ranges from 24% to approximately 29% for the thoracic region, which is in good agreement with values in the literature (28). This ratio was higher for the posterior images because our scan study included a bed that caused more scattered events and on which the volunteers laid. The ratio also varied among the volunteers of different sizes and changed between source distributions (Table 1). These results support a previous observation that the amount of scatter depends on activity source and body density distributions (17). Scatter correction using the dual-energy windows is straightforward to implement. However, the estimated fractional parameter k based on the known components from the simulated images varied among volunteers and between source distribution patterns and k values were less than the phantom-derived and commonly used value k = 0.5 (Table 2). This confirmed a previous report (17). Perhaps, a k value obtained by a method that is similar to an actual measurement should be used for correction. Using such a k value from arranging the cylindric or elliptic phantoms in a patient-like simulation will be closer to a real situation when we have no access to the specific patient geometry and when we cannot measure the k exactly. Further investigation on related issues is warranted. For example, if we spot the exact k, some parts on the image will be overcorrected whereas others will be undercorrected because we are measuring in a lower energy window and we collect more wide-angle scattered photons. Generally, locations close to the source will be underestimated for scatter and far away from the source will be overestimated at the subtraction step. Other scatter correction methods not used by the aerosol researchers, such as the triple-energy window method (29), may offer a better estimate of the scatter. Investigation of these methods for the aerosol inhalation applications is worthwhile.
The analysis of true ACF values also showed that the effects of attenuation on planar images depend on regional source distribution and body density (Table 3). This poses a problem for attenuation correction because the activity distribution between regions is usually unknown, although the body density map can be measured accurately by CT, MRI, or flood transmission scans. A comparison of true ACF values with those obtained from the 2 commonly used (by the aerosol researchers) attenuation correction methods indicates that these methods have a margin of error that is not negligible, larger than the 10% accuracy and precision range estimated by a previous simulation (10). For the simplified correction method (26), there was undercorrection of the lung region even if the scatter correction was perfect (Table 4). The simplified geometry of human subjects in this method can be avoided by use of addition scans of anatomy from CT or MRI. For the effective attenuation correction method, which uses broad-beam attenuation coefficients and requires no a priori scatter correction, the lung region was overcorrected and the central region was undercorrected (Table 4). This occurred because the effective μ also varied with source and object similar to the scatter fraction k, and μ = 0.12 was obtained from a uniform water phantom with different geometry. The use of μ = 0.12 is therefore restricted to certain conditions. These results show that regional source distribution and density inhomogeneity cannot be overlooked. This finding also supports the opinion that the effective attenuation correction method is not always suitable (12).
SPECT was not examined in this study. The relatively long scanning time of about 15 min makes SPECT not ideal for this type of study. After aerosol lung inhalation, clearance and absorption take place at a rate that is significant over the SPECT scanning span (30). Therefore, measured biologic processes would be averaged during the SPECT scan. Currently, dynamic SPECT scanning is under investigation with the aim of improving temporal resolution (31).
CONCLUSION
Planar scintigraphic imaging, though useful for qualitative or semiquantitative studies of aerosol lung inhalation, is inadequate for measuring quantitatively the lung deposition of a tracer. The amount of scatter and attenuation depends on the radioactivity source distribution and the body mass. The corrections to compensate these effects are exact only if the true source and body attenuation coefficients are available. Although a density map of the body can be obtained accurately, the source distribution is usually unknown.
Acknowledgments
The authors thank Liz Russell for technical assistance during CT scanning, the anonymous reviewers for their comments that helped us to present our results more clearly, and Case Western Reserve University Clinical Research Center (CRC) for assistance with the human subject portion of this work. The CRC is supported in part by National Institutes of Health grant National Center for Research Resources MO1RR00080.
Footnotes
Received Nov. 10, 2000; revision accepted Feb. 15, 2001.
For correspondence or reprints contact: Zhenghong Lee, PhD, Nuclear Medicine Division, Radiology Department, University Hospitals of Cleveland, Case Western Reserve University, 11100 Euclid Ave., Cleveland, OH 44106.
REFERENCES
In this issue


Jump to section
Related Articles
Cited By...
- No citing articles found.