


Abstract
In May 2018, the Biograph Vision PET/CT system was installed at the University Medical Center Groningen. This study evaluated the initial experiences with this new PET/CT system in terms of perceived image quality and semiquantitative analysis in comparison to the Biograph mCT as a reference. Methods: In total, 20 oncologic patients were enrolled and received a single 3 MBq/kg injected dose of 18F-FDG followed by a dual-imaging PET scan. Ten patients were scanned on the Biograph mCT first, whereas the other 10 patients were scanned on the Biograph Vision first. The locally preferred clinically reconstructed images were blindly reviewed by 3 nuclear medicine physicians and scored (using a Likert scale of 1–5) on tumor lesion demarcation, overall image quality, and image noise. In addition, these clinically reconstructed images were used for semiquantitative analysis by measurement of SUVs in tumor lesions. Images acquired using reconstructions conform with the European Association of Nuclear Medicine Research Ltd. (EARL) specifications were also used for measurements of SUV in tumor lesions and healthy tissues for comparison between systems. Results: The 18F-FDG dose received by the 14 men and 6 women (age range, 36–84; mean ± SD, 61 ± 16 y) ranged from 145 to 405 MBq (mean ± SD, 268 ± 59.3). Images acquired on the Biograph Vision were scored significantly higher on tumor lesion demarcation, overall image quality, and image noise than images acquired on the Biograph mCT (P < 0.001). The overall interreader agreement showed a Fleiss κ of 0.61 (95% confidence interval, 0.53–0.70). Furthermore, the SUVs in tumor lesions and healthy tissues agreed well (within 95%) between PET/CT systems, particularly when EARL-compliant reconstructions were used on both systems. Conclusion: In this initial study, the Biograph Vision showed improved image quality compared with the Biograph mCT in terms of lesion demarcation, overall image quality, and visually assessed signal-to-noise ratio. The 2 systems are comparable in semiquantitatively assessed image biomarkers in both healthy tissues and tumor lesions. Improved quantitative performance may, however, be feasible using the clinically optimized reconstruction settings.
PET integrated with CT is a standard of care used in oncology (1–3) and many other indications, such as infectious diseases, cardiology, and neurology. In oncology, PET/CT is a commonly used and rapidly evolving technique for, among others, differentiation between benign and malignant tumors, cancer staging, primary tumor definition, therapy prediction and guidance, and radiation therapy planning (1,3).
Improvements in PET instrumentation over the years include the use of fast lutetium oxyorthosilicate crystals permitting shorter coincidence timing windows (4,5), new reconstruction methods with time-of-flight (TOF) application (5–9) for improved image signal-to-noise ratio, and expansion of the axial field of view for increased volume sensitivity and axial coverage (9). Recently, silicon photomultiplier (SiPM)–based detectors emerged, offering several advantages over photomultiplier tubes such as more compact size, higher intrinsic time resolution, and higher photon-detection efficiency, making them favorable for coupling with TOF reconstruction (10,11).
The most commonly used PET radiotracer at present is 18F-FDG, a glucose analog, for which accumulation in tissue is proportional to glucose utilization (1). Based on increased glucose uptake and glycolysis of specific tumors, 18F-FDG PET/CT has been proven to be essential in detecting cancer, staging it, planning its therapy, and evaluating the response (12–16).
In May 2018, the first SiPM-based Biograph Vision PET/CT system (Siemens Molecular Imaging) was installed at the Department of Nuclear Medicine and Molecular Imaging at the University Medical Center Groningen. The 3.2-mm crystal size allows for a high system spatial resolution, and full coverage of the small crystals by the SiPM detector elements optimizes light collection, enabling improved timing resolution and signal-to-noise ratio (17).
The main purpose of this study was to evaluate initial clinical experiences and to explore whether the system yields improved image quality and diagnostic performance (i.e., lesion demarcation, overall image quality, and visually assessed signal-to-noise ratio) in comparison with its predecessor, the Biograph mCT (Siemens Healthineers). Therefore, a comparison between whole-body 18F-FDG clinical images obtained on the Biograph Vision and the Biograph mCT—both being systems of the same vendor—has been explored both visually and semiquantitatively.
MATERIALS AND METHODS
Patient Population
Between June and August 2018, 20 patients who were referred to the Department of Nuclear Medicine and Molecular Imaging for oncologic clinical PET/CT were enrolled in this prospective study. Patients with a glucose level equal to or over 198 mg/dL before 18F-FDG injection were excluded, as were pregnant women and patients unable to lie still for the duration of the examination.
The local medical ethics review board of the University Medical Center Groningen waived the need for formal ethical review (waiver number METc2017/489) on review of the study protocol. In addition, patients were informed about the study aims, procedures, and the need to acquire an additional low-dose CT scan (∼1 mSv) and gave written informed consent to participate.
Imaging Protocol
All patients received a single intravenous injection of a weight-based dose of 18F-FDG (3 MBq/kg, according to European Association of Nuclear Medicine guidelines) (18) and then underwent a dual-imaging PET protocol, including a PET/CT scan on the Biograph Vision and a PET/CT scan on the Biograph mCT. Ten patients first underwent acquisition on the Biograph mCT at 60 min after injection, followed immediately by image acquisition using the Biograph Vision at approximately 90 min after injection. In the other 10 patients, the order was switched to control for tumor metabolic activity increase over time, possibly influencing image quality. Since the PET/CT systems at the Department of Nuclear Medicine and Molecular Imaging at the University Medical Center Groningen are accredited for 18F-FDG PET/CT imaging by the European Association of Nuclear Medicine Research Ltd. (EARL), the EARL imaging protocol is followed strictly. This protocol recommends that the scan start at 60 min after injection (1,19). Second scans were done immediately after the first; therefore, 18F-FDG uptake time and interval between scans were comparable for all 20 patients.
Participants were instructed to fast and avoid strenuous exercise for at least 4–6 h before the 18F-FDG injection. At the time of injection, blood glucose levels were no more than 198 mg/dL. A standard low-dose CT scan was obtained from the top of the head to the mid thighs and used for attenuation correction. On the Biograph Vision, the parameters were an x-ray tube current of 43 mAs, a tube voltage of 100 kV, and a spiral pitch factor of 1. On the 40- and 64-slice Biograph mCT, the respective parameters were an x-ray tube current of 103 and 99 mAs, a tube voltage of 140 and 140 kV, and a spiral pitch factor of 1 and 1.5. Afterward, an emission PET scan was acquired at 3 min per bed position in list mode. All scans were acquired during normal breathing without respiratory motion gating or correction.
Images acquired on the Biograph Vision were reconstructed using the vendor-recommended, clinically most relevant reconstruction protocol—that is, an ordinary Poisson ordered-subset expectation maximization (OP-OSEM) 3-dimensional (3D) iterative algorithm (20) with 4 iterations and 5 subsets, with application of TOF, resolution modeling, and no filtering. The resulting PET images had an image matrix of 440 × 440 with a voxel size of 1.6 × 1.6 × 1.5 mm. Images acquired on the Biograph mCT were reconstructed using the locally preferred clinical reconstruction protocol: 3D TOF OP-OSEM with 3 iterations, 21 subsets, and resolution modeling. A gaussian filter of 5 mm was applied to the reconstructed images, and the resulting image matrix was 400 × 400 with a voxel size of 2 × 2 × 2 mm. In addition, EARL reconstructions (1,19) were obtained for both the Biograph Vision and the Biograph mCT. Images acquired on the Biograph Vision were reconstructed to comply with EARL using 3D TOF OP-OSEM with 4 iterations and 5 subsets, with application of resolution modeling and a gaussian filter of 7 mm. The resulting image matrix was 440 × 440 with a voxel size of 1.6 × 1.6 × 1.5 mm. The EARL reconstruction for images obtained from the Biograph mCT used 3D TOF OP-OSEM with 3 iterations and 21 subsets, resolution modeling, and a gaussian filter of 6.5 mm, for a resulting image matrix of 256 × 256 with a voxel size of 3.2 × 3.2 × 2 mm.
Qualitative Image Analysis
The acquired images were independently reviewed and analyzed using a dedicated syngo.via VB30 workstation (Siemens Healthineers). All PET images acquired from the recommended clinical reconstruction protocols were blindly evaluated by 3 experienced nuclear medicine physicians (with 15, 5, and 10 y of experience in interpreting PET scans). The readers were not aware of the clinical indication for the PET/CT exam.
Readers were allowed to manually adjust the standard window settings. Subsequently, they assessed the following quality criteria based on 5-point Likert scales: tumor lesion demarcation (ranging from 1 [lesion cannot be confirmed] to 5 [excellent lesion margin demarcation]), overall image quality (ranging from 1 [poor overall image quality] to 5 [excellent overall image quality]), and image noise (ranging from 1 [enormous image noise] to 5 [no perceivable image noise]) (10,21). In addition, per clinically recommended reconstruction, the number of suggestive 18F-FDG–avid lesions was counted. In cases of large assessment differences between readers, the specific images were discussed in a consensus meeting.
Semiquantitative Image Analysis
Semiquantitative analyses were performed using the quAntitative onCology moleCUlar Analysis suiTE (ACCURATE) (22). Using the EARL-reconstructed images, 0.5-mL spheric volumes of interest were placed in healthy tissues (aortic arch, semioval center [white matter], lung, left ventricle of the heart, parotid gland, quadriceps femoris muscle, spleen). From these volumes of interest, SUVmax, SUVpeak, and SUVmean were obtained. In addition, using the EARL-reconstructed images and the locally preferred clinical reconstructed images, volumes of interest were placed in the different lesions per patient (with an overall maximum of 5 lesions per patient and a maximum of 2 in the same tissue type). For reference-tissue purposes, a 3-mL spheric volume of interest was placed in the liver. From these measurements, the SUVmax, SUVpeak, and SUVmean were compared between systems.
Statistical Analysis
Statistical analysis was performed with SPSS Statistics, version 25.0 (IBM Corp.). Scoring of the images acquired on the 2 PET/CT systems was compared pairwise using a 2-tailed paired-samples t test. For interreader agreement on tumor lesion demarcation, overall image quality, and image noise, the original 5-point scores were reassigned to 3-point scores (1 + 2 became 1, 3 became 2, and 4 + 5 became 3). Interreader agreement was subsequently evaluated using the κ statistic. Bland–Altman plot analysis was performed to assess the agreement regarding SUVmax, SUVpeak, and SUVmean obtained in healthy tissues and in lesions between the 2 systems. Subsequently, equivalence tests were done on each of the healthy tissues and on the tumor lesions to quantify agreement on SUV between the systems. Furthermore, using partial correlation, the relation between SUV and the interval between scans was evaluated.
RESULTS
In total, 20 oncologic patients (14 men and 6 women; age range, 36–84; mean ± SD, 61 ± 16 y) were enrolled in the study. To simulate the actual clinical experience, different cancer types were included. Table 1 shows relevant demographic and clinical information. The injected 18F-FDG dose ranged from 145 to 405 MBq (mean ± SD, 268 ± 59.4 MBq). All patients had a blood glucose level of no more than 198 mg/dL before dose administration. To control for the possibility that changes in 18F-FDG uptake over time might influence image quality, the first 10 patients were scanned on the Biograph mCT first, whereas the other 10 patients were scanned on the Biograph Vision first. The interval between the start of the first and second scans ranged from 24 to 60 min (mean ± SD, 37 ± 7.7 min).
Demographic and Clinical Data of All Study Participants
Qualitative Image Quality
The average scores of the 3 readers for the Biograph mCT images versus the Biograph Vision images were 3.3 ± 1.0 versus 4.3 ± 0.80 for lesion demarcation, 3.4 ± 0.90 versus 4.3 ± 0.80 for overall image quality, and 3.4 ± 0.70 versus 3.9 ± 0.70 for image noise. Images acquired on the Biograph Vision were scored significantly higher on tumor lesion demarcation (median 5), overall image quality (median 4), and image noise (median 4) than images acquired on the Biograph mCT (medians of 3, 3, and 3, respectively; P < 0.01). The overall interreader agreement showed a Fleiss κ of 0.61 (95% confidence interval, 0.53–0.70). Example images of patients of standard weight (91 and 101 kg) are shown in Figures 1 and 2. Supplemental Figures 1 and 2 show images of a lighter-weight (53 kg) and a heavier-weight (139 kg) patient, respectively (supplemental materials are available at http://jnm.snmjournals.org).

Transaxial CT, PET/CT, PET, and maximum-intensity-projection PET images (from left to right) acquired on Biograph Vision (top) and Biograph mCT (bottom) for 84-y-old man (weight, 91 kg) with metastasized non-small cell lung carcinoma. Position of transaxial slice is indicated on maximum-intensity projection (dashed line).

Transaxial CT, PET/CT, PET, and maximum-intensity-projection PET images (from left to right) acquired on Biograph Vision (top) and Biograph mCT (bottom) for 66-y-old woman (weight, 101 kg) with metastasized thyroid cancer. Position of transaxial slice is indicated on maximum-intensity projection (dashed line).
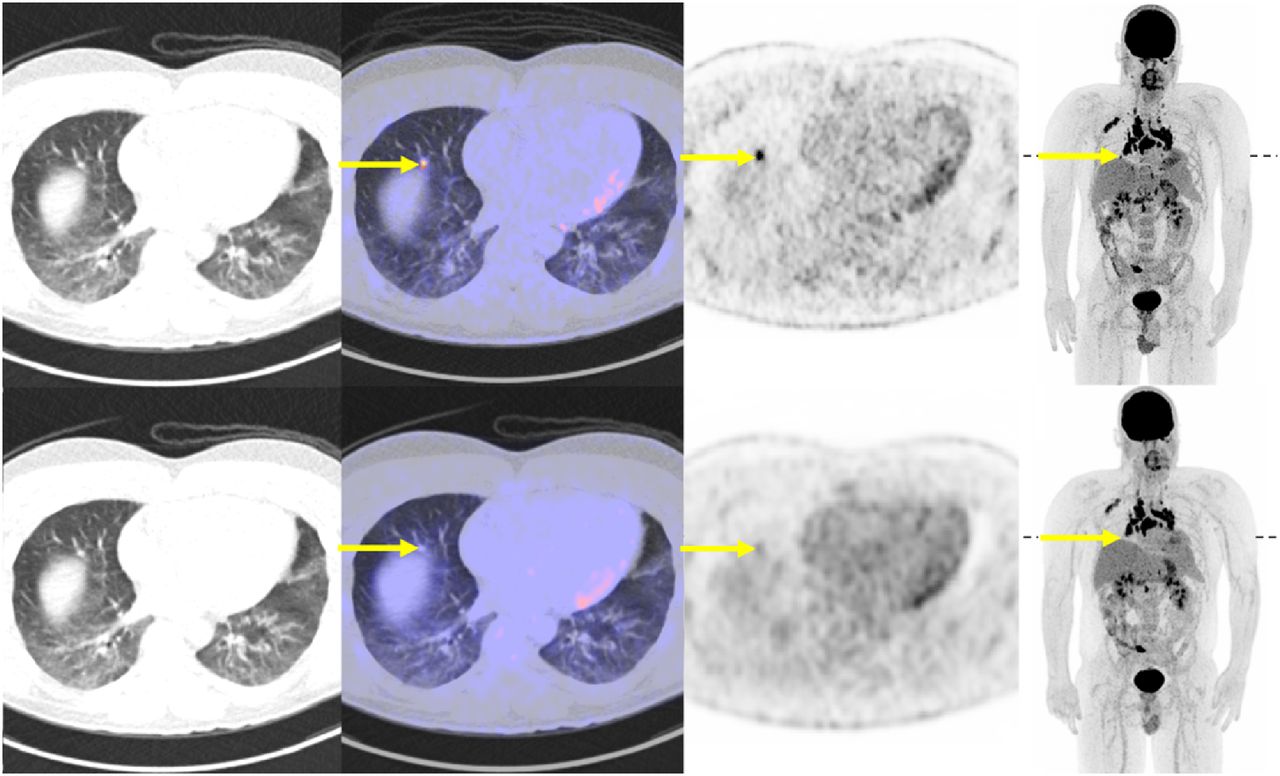
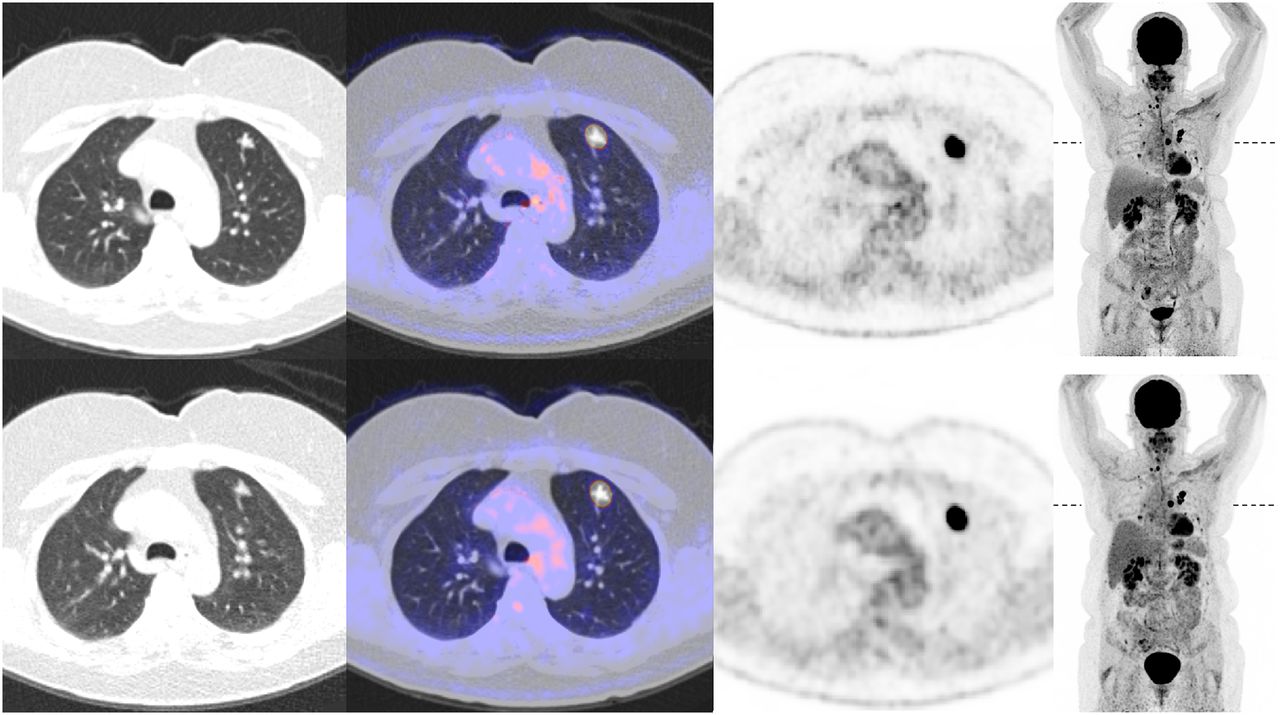
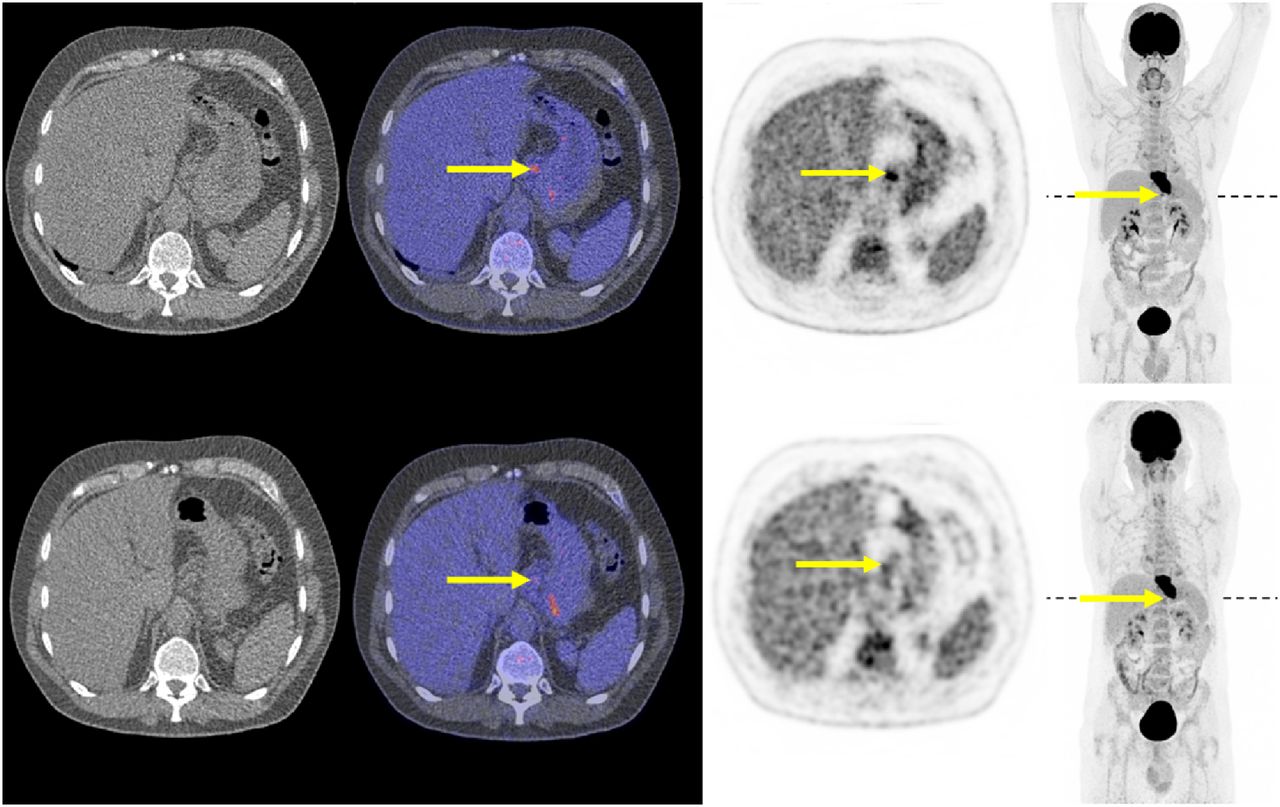
In 7 of the 20 patients, one or more 18F-FDG–avid lesions not seen on the Biograph mCT images were identified on the Biograph Vision images. These additional lesions all measured below 0.75 cm in diameter and were in areas with significant motion, such as the lungs and near the diaphragm. Figures 3 and 4 show examples of the additional lesions found on the Biograph Vison images.

Transaxial CT, PET/CT, PET, and maximum-intensity-projection PET images (from left to right) acquired on Biograph Vision (top) and Biograph mCT (bottom) for 59-y-old man (weight, 106 kg) with metastasized esophageal cancer. Position of transaxial slice is indicated on maximum-intensity projection (dashed line). Arrows indicate small lesion found on Biograph Vision images that did not appear as such on Biograph mCT images.
Transaxial CT, PET/CT, PET, and maximum-intensity-projection PET images (from left to right) acquired on Biograph Vision (top) and Biograph mCT (bottom) for 36-y-old man (weight, 69 kg) with sarcoidosis. Position of transaxial slice is indicated on maximum-intensity projection (dashed line). Arrows indicate small lesion found on Biograph Vision images that did not appear as such on Biograph mCT images.
Semiquantitative Image Quality
The results of the equivalence tests of SUV in healthy tissue matched per patient are presented in Table 2. The SUVs in tumor lesions and healthy tissues agreed well between the 2 PET/CT systems when EARL-compliant reconstructions were used. Bland–Altman plots displaying agreement in SUVmax in normal tissues between the 2 systems are shown in Supplemental Figure 3. The results of the equivalence tests for SUVmax, SUVpeak, and SUVmean in tumor lesions are presented in Table 3; there was no significant difference between the 2 systems. Agreement in tumor lesion SUVmax, SUVpeak, and SUVmean between the 2 systems is shown in Bland–Altman plots in Figure 5. Scatterplots of lesion SUVs from images obtained on the 2 systems are displayed in Supplemental Figure 4. SUVmax, SUVpeak, and SUVmean distributions between EARL-compliant and clinically reconstructed images acquired on the 2 systems are shown in box plots in Figure 6.
Difference in SUVs in Healthy Organ Tissues
Difference in SUVs in Tumor Lesions

(A) Bland–Altman plot of Biograph mCT and Biograph Vision SUVmax lesion differences using EARL-compliant image reconstructions (SUVmax on Biograph mCT minus SUVmax on Biograph Vision) plotted against mean SUVmax (mean SUVmax between systems). (C) Bland–Altman plot of SUVpeak lesion differences plotted against mean SUVpeak. (E) Bland–Altman plot of SUVmean lesion differences plotted against mean SUVmean. Mean difference is illustrated by solid line, and upper and lower limits of agreement are shown by dashed lines. Measurements performed on Biograph mCT first and Biograph Vision first are illustrated with black and gray dots, respectively. For direct comparison with SUVmax, SUVpeak, and SUVmean obtained from locally preferred clinical reconstructed images, Bland–Altman plots showing SUV differences have been added in B, D, and F, respectively.

Box plots showing SUVmax (dark gray), SUVpeak (light gray), and SUVmean (white) distributions between EARL-compliant and locally preferred clinical reconstructed images acquired on Biograph mCT and Biograph Vision. Dots represent outliers; diamonds represent extreme outliers. For clarity, vertical scale was set from 0 to 80; consequently, a few outliers are not visible (but can be found in the Bland–Altman plots in Fig. 5).
Partial correlation testing showed no significant correlation between normal-tissue SUVmax, SUVpeak, or SUVmean and the interval between imaging on the 2 systems, nor was there a correlation between lesion SUVmax, SUVpeak, or SUVmean and the interval.
Furthermore, SUVs of additional lesions found on the Biograph Vision images were compared with SUVs obtained from the Biograph mCT images. SUVmax ranged from 4.5 to 34.5 (median, 7.5) for the Biograph Vision and from 2.1 to 8.7 (median, 2.9) for the Biograph mCT. SUVpeak and SUVmean were similar between the 2 systems.
DISCUSSION
This study evaluated initial experiences with the Biograph Vision and found that it outperforms its predecessor, the Biograph mCT, in terms of visually assessed image quality, tumor lesion demarcation, overall image quality, and signal-to-noise ratio. Semiquantitative analyses showed both systems to be comparable in assessing biomarkers in both healthy tissues and tumor lesions. Furthermore, in 7 of 20 patients, one or more 18F-FDG–avid lesions not found on the Biograph mCT images were identified on the Biograph Vision images, a result that could have important clinical consequences.
Recent technical developments in PET instrumentation have likely contributed to the improved quality observed in images acquired on the Biograph Vision (23). The introduction of SiPM detectors in commercially available PET/CT systems is of clinical importance because of the potential advantages of this new technology. SiPM-based photodetectors are characterized by superior timing resolution, enabling improved TOF estimation (24), and efficient photon detection.
The performance characteristics of the most recently developed SiPM-based PET/CT system, the Biograph Vision, were evaluated and published recently by our group (25). Spatial resolution, sensitivity, count-rate performance, accuracy of attenuation and scatter correction, TOF performance, and image quality were evaluated according to the National Electrical Manufacturers Association (NEMA) NU-2 2012 and NEMA NU-2 2018 standards, showing improved performance with regard to its predecessor, the Biograph mCT (25). Of all the current commercially available PET/CT systems, the Biograph Vision also outperforms other SiPM-based systems. For instance, it has a timing resolution of 210 ps, compared with 310 ps for the Vereos (Philips Healthcare) (26) and 375 ps for the Discovery MI (GE Healthcare) (3). The sensitivity of the Biograph Vision has also improved with regard to the other available SiPM-based systems, at 16.4 kcps/MBq for the Biograph Vision as opposed to 5.2 kcps/MBq for the Vereos and 13.7 kcps/MBq for the Discovery MI.
The benefits of higher sensitivity and improved TOF resolution are a higher signal-to-noise ratio (especially for heavy patients), higher overall image quality, higher lesion detectability, and more accurate image quantification (24). Three of these categories have been qualitatively assessed in this study to see whether theoretic and expected improvement in image quality also translates to an improved perceived image quality in clinical practice. The Biograph Vision scored significantly higher than the Biograph mCT on lesion demarcation, overall image quality, and image noise.
With regard to the semiquantitative measurements, good agreement in SUV in tumor lesions and in healthy tissues was seen between the Biograph Vision and the Biograph mCT when EARL-compliant reconstructions were used, as well as when the locally preferred clinical image reconstructions were used. Because of the balanced order in which the dual scans were performed (10 patients being scanned first on the Biograph mCT and the other 10 being scanned first on the Biograph Vision) and because the EARL guidelines for tumor imaging were followed, the interval between the 2 scans had no significant influence on the normal-tissue or lesion SUVs. When the locally preferred clinical reconstruction settings are used on the Biograph Vision, the higher spatial resolution of the system and the use of smaller voxel sizes result in less of a partial-volume effect; a higher contrast recovery is obtained, resulting in a slight increase in SUVmax (not significant, however [Figs. 5 and 6; Table 3]). Moreover, the SUVs from the locally preferred clinical reconstructed images were higher, overall, than those from the EARL-compliant images (Fig. 5). The occasional increase in SUVmax in the locally preferred clinical reconstructed images of Figure 5 can be explained by the characteristics of the lesions. If the SUVmax is already high (>10) on Biograph mCT images, it will be even higher on Biograph Vision images (because of its higher spatial resolution and smaller voxel size).
The perceived improvement in image quality with the Biograph Vision resulted in identification of one or more additional 18F-FDG–avid lesions in 7 of 20 patients. The additional lesions were all below 0.75 cm in diameter and were in areas with significant motion, such as the lungs and near the diaphragm. In 1 patient, an additional lesion that was found resulted in upstaging of the disease. In none of the patients therapy was altered, since the additional lesions were near the primary tumor or numerous other small metastases were already considered. However, this study had only a small sample size. Nevertheless, these initial findings suggest that the Biograph Vision would be beneficial for detecting small lesions that could have a clinical impact, such as by changing the disease stage or leading to a different choice of therapy.
Because we believe that comparisons between the 2 systems would be more valid if the groups of oncologic disease were more homogeneous, future such studies are warranted to more deeply explore lesion quantification.
CONCLUSION
In this initial study, we found that perceived image quality is better with the Biograph Vision than the Biograph mCT: tumor lesions were more sharply demarcated, image quality higher, and signal-to-noise ratio better. Regarding semiquantitative image quality, the 2 systems performed comparably for imaging healthy tissues and tumor lesions. Improved quantitative performance may, however, be feasible using clinically optimized reconstruction settings. Future studies including more homogeneous groups of oncologic disease are warranted to validate our findings and to assess the potential clinical impact of PET imaging using the Biograph Vision.
DISCLOSURE
The research presented in this study is financially supported by Siemens Molecular Imaging under a collaborative research contract. No other potential conflict of interest relevant to this article was reported.
KEY POINTS
QUESTION: Does the new Biograph Vision PET/CT scanner outperform its predecessor, the Biograph mCT, in terms of perceived image quality and semiquantitative analysis?
PERTINENT FINDINGS: In a dual-imaging study, perceived quality was compared between images acquired on the Biograph Vision and images acquired on the Biograph mCT in 20 patients referred for oncologic PET/CT. The Biograph Vision images were of better perceived quality, with more sharply demarcated tumor lesions, higher overall quality, and better signal-to-noise ratio. With regard to semiquantitative image quality, the 2 systems performed comparably in imaging healthy tissues and tumor lesions. Improved quantitative performance may, however, be feasible using clinically optimized reconstruction settings.
IMPLICATIONS FOR PATIENT CARE: The Biograph Vision might be beneficial for detecting small lesions, which could impact tumor staging or influence the choice of therapy.
Footnotes
Published online Jun. 28, 2019.
- © 2020 by the Society of Nuclear Medicine and Molecular Imaging.
REFERENCES
- Received for publication February 26, 2019.
- Accepted for publication June 7, 2019.


Jump to section
Related Articles
Cited By...
- SNMMI Procedure Standard/EANM Practice Guideline for Brain [18F]FDG PET Imaging, Version 2.0
- Diagnostic Performance of 18F-FDG PET/CT According to Delay After Treatment to Detect Subclinical Recurrence of Head and Neck Squamous Cell Carcinoma
- The Role of 89Zr-Immuno-PET in Navigating and Derisking the Development of Biopharmaceuticals
- Value of SiPM PET in myocardial perfusion imaging using Rubidium-82