


Abstract
Heterogeneity of estrogen receptor (ER) expression in breast cancer is recognized. However, knowledge about varying expression across metastases and surrounding normal tissue in patients is scarce. We therefore analyzed 16α-18F-fluoro-17β-estradiol (18F-FES) PET to assess ER expression heterogeneity. Methods: 18F-FES PET on accredited PET/CT camera systems performed in patients with ER-positive metastatic breast cancer November 2009–December 2014 was analyzed. Lesions with an SUVmax 1.5 or more were considered ER-positive, but liver lesions were excluded given high background liver signal. CT lesions with a diameter 10 mm or more were included. We used multilevel linear-mixed models to evaluate determinants of 18F-FES uptake. Cluster analysis was performed with different imaging features per patient as input variables. Results: In 91 patients, 1,617 metastases in bone (78%), lymph node (15%), lung (4%), or liver (2%) were identified by CT (11.2%), PET (56.6%), or both (32.2%). Median tumor uptake varied greatly between patients (SUVmax, 0.54–14.21). 18F-FES uptake in bone metastases was higher than in lymph node and lung metastases (geometric mean SUVmax, 2.61 [95% confidence interval (CI), 2.31–2.94] vs. 2.29 [95% CI, 2.00–2.61; P < 0.001] vs. 2.23 [95% CI, 1.88–2.61; P = 0.021]), respectively. Cluster analysis identified 3 subgroups of patients characterized by particular metastatic sites and 18F-FES PET/CT features. SUVmax in surrounding normal tissue, highest in the bones, varied per patient (range, 0.7–3.3). Conclusion: 18F-FES uptake is heterogeneous in tumor and normal tissue and influenced by anatomic site. Different patterns can be distinguished, possibly identifying biologically relevant ER-positive metastatic breast cancer patient subgroups.
See an invited perspective on this article on page 1210.
Breast cancer is the most common cause of cancer death among women (1). Data are accumulating that both inter- and intralesional differences occur in breast cancer patients (2). This heterogeneity is thought to be caused by clonal selection due to intrinsic cellular factors such as genetic mutations and extrinsic factors as paracrine signaling (3). This implies that tumor characteristics can be different within a tumor lesion as well as between metastases within the same patient (4).
Currently, the most important molecular characteristic of breast cancer is the estrogen receptor (ER). Targeting the ER by hormonal therapy is one of the pillars of breast cancer treatment in the adjuvant as well as metastatic setting (5). Tumor response to this treatment is mainly dependent on the ER expression by the tumor cells, which is the case in approximately 75% of all breast cancers (6).
However, discrepant ER expression between primary tumor and metastases is on average present in about 20% of the breast cancer patients (7,8). Currently, limited knowledge is available about differences in ER expression between metastatic sites. Increasing our understanding of ER heterogeneity could aid in providing precision medicine regarding endocrine therapy of breast cancer patients (4).
Generally, ER status is determined by immunohistochemistry on biopsy material of the primary tumor or a metastasis. Whole-body visualization and quantification of ER of all lesions within 1 patient can be performed by PET imaging with 16α-18F-fluoro-17β-estradiol (18F-FES) as a tracer. Uptake of the tracer in tumor lesions correlates well with ER expression in the tumor lesions measured with immunohistochemistry (9). Therefore, 18F-FES PET provides whole-body information regarding ER status and enables quantification of ER expression in the primary tumor and metastases in patients (10). In addition, this method allows visualization and quantification of ER expression in normal tissue surrounding metastases.
In this study, we aimed to analyze heterogeneity of metastatic breast cancer and its surrounding normal tissue based on 18F-FES uptake between and within ER-positive metastatic breast cancer patients, taking into account the site of metastases. Furthermore, we explored the presence of distinct patterns of ER-positive metastatic breast cancer defined by 18F-FES PET/CT imaging results.
MATERIALS AND METHODS
Patient Population
18F-FES PET scans were obtained in patients with newly diagnosed metastatic breast cancer as well as patients receiving prior hormonal of chemotherapeutic treatment for metastatic disease. Scans between November 2009 and December 2014 were reanalyzed. All patients had biopsy-proven ER-positive breast cancer (primary and/or metastatic) based on immunohistochemistry. 18F-FES PET scans of all consecutive patients, within this time frame in the University Medical Center Groningen, were analyzed for inclusion.
Excluded were scans that were not obtained using a dedicated PET/CT camera, scans obtained in patients diagnosed with nonbreast cancer metastases, and scans obtained in ongoing 18F-FES PET studies (ClinicalTrials.gov identifier NCT01957332 and NCT01988324) (Supplemental Fig. 1; supplemental materials are available at http://jnm.snmjournals.org). Included in this analysis were patients who underwent scans as routine care or baseline 18F-FES PET scans when enrolled in completed 18F-FES PET studies (11,12). Conforming to Dutch Law and retrospective study design, no informed consent of the patients was needed.
18F-FES PET/CT
18F-FES PET scans were obtained as described earlier (13). 18F-FES was administered intravenously in a dose of approximately 200 MBq. Whole-body 18F-FES PET was performed 60 min after tracer injection, using European Association of Nuclear Medicine Research Ltd.– accredited PET/CT camera systems (Siemens CTI), high definition and time-of-flight, and 2-mm spatial resolution. Emission scans were acquired for 3 min per bed position, and a low-dose CT-scan was obtained for attenuation correction. In some patients a contrast-enhanced CT was acquired as well. All scans and quantifications were performed according to the guidelines for tumor 18F-FDG PET of the European Association of Nuclear Medicine (14). Scans were reconstructed with a Gaussian filter of 5 mm in full width at half maximum, using image matrixes of 256 × 256 mm, and iterative reconstruction methods were used with 3 iterations and 24 subsets.
Analysis of Imaging Results
18F-FES PET and low-dose or contrast-enhanced CT scans were evaluated for the presence of lesions. For 54 patients (59.3%), a contrast-enhanced CT scan was available. Lesions detected by 18F-FES-PET were recorded, and 18F-FES uptake was quantified. Congruent with our previous 18F-FES PET studies, the SUVmax was used to quantify ER expression. Lesions with an SUVmax of 1.5 or more were considered 18F-FES–positive (13,14).
Because of this high physiologic 18F-FES liver uptake (15), liver lesions were excluded from quantitative analyses. Background 18F-FES uptake in various healthy tissue types, including fat, lung, liver, muscle and bone, was quantified in all individual patients. Various bones were considered (skull, cervical spine, thoracic spine, lumbar spine, and femur). Background measures were not performed if interference by metastatic lesions was plausible.
CT data were used to allocate PET-positive lesions to an anatomic substrate, to identify 18F-FES PET–negative lesions, and for the detection of liver lesions. Low-dose CT scans were evaluated by an experienced radiologist for presence of metastases. Contrast-enhanced CT scans performed within 6 wk of 18F-FES PET scan were also eligible for analysis. CT results were compared with findings on 18F-FES PET. Lesions present on CT, but negative on 18F-FES PET, were quantified on 18F-FES PET by obtaining the SUVmax of a volume of interest drawn on fused PET/CT images. Only CT lesions with a width of minimally 10 mm were included for identification of 18F-FES PET–negative lesions, because lesions of 10 mm or more may be false-negative on 18F-FES PET due to resolution limitations.
Statistical Analysis
First, we evaluated the frequency of metastases visible on CT and/or 18F-FES PET according to site, and within and between patients. Site-to-site variability in 18F-FES uptake was expressed as the coefficient of variation (SD/mean). Liver lesions were excluded from quantitative analyses.
To assess the relation between site and 18F-FES uptake in unaffected tissue and metastases, we used multilevel linear mixed models, taking within-patient clustering into account as random intercept. 18F-FES uptake was first evaluated continuously following natural log transformation to obtain approximate normal distributions (yielding geometric mean differences upon backtransformation). We also evaluated metastatic 18F-FES uptake binary considering an SUVmax ≥ 1.5 as 18F-FES PET–positive (yielding absolute differences in percentage 18F-FES PET–positive metastases). We similarly studied the influence of ER-antagonist use on 18F-FES uptake, and mutually corrected the effects of ER-antagonist use and metastasis site by including both variables simultaneously in the models. P values and 95% CIs for these linear mixed model analyses were obtained by 2,000-fold bootstrap resampling, and a nominal α of <0.05 was considered significant.
Finally, we explored whether metastatic breast cancer patients with ER-positive disease can be clustered into distinct groups based on 18F-FES PET/CT imaging results. For this we used agglomerative hierarchical Ward clustering with Spearman’s rho as distance measure, based on 13 patient-based imaging features: the number of metastases visible on 18F-FES PET and/or CT, overall and per site (bone, brain, breast, liver, lung, and lymph nodes); the overall number and percentage of metastases visible on CT respectively being 18F-FES PET–positive; and the mean and standard deviation of 18F-FES SUVmax, for all nonliver metastases. We determined the appropriate number of clusters based on a majority vote using 30 indices. We then tested for differences between clusters in the distribution of above imaging features using the Kruskall–Wallis rank-sum test and report those imaging features that were statistically significant following Bonferroni correction (i.e., with a critical α of 0.05/13 = 0.0038).
Statistical analyses were performed in R (R Foundation; 3.2.1 for Mac OS, particularly using the function hclust from the package stats, NbClust from the package NbClust, and lmer from the package lme4) (16). All reported P values are 2-sided.
RESULTS
Patients
In total, 91 patients were included for analyses. Six of them were premenopausal (flow chart diagram, Supplemental Fig. 1). Twenty-eight patients discontinued ER antagonists (22 tamoxifen, 6 fulvestrant) use a median 5.2 wk before the 18F-FES PET scan.
Patient and tumor characteristics are listed in Table 1 and Supplemental Table 1. The mean time between 18F-FES PET scanning and biopsy of primary tumor and metastasis was 9 y (range, 0–29 y) and 3 y (range, 0–16 y), respectively.
Patient Characteristics
Distribution of Metastases by Anatomic Site
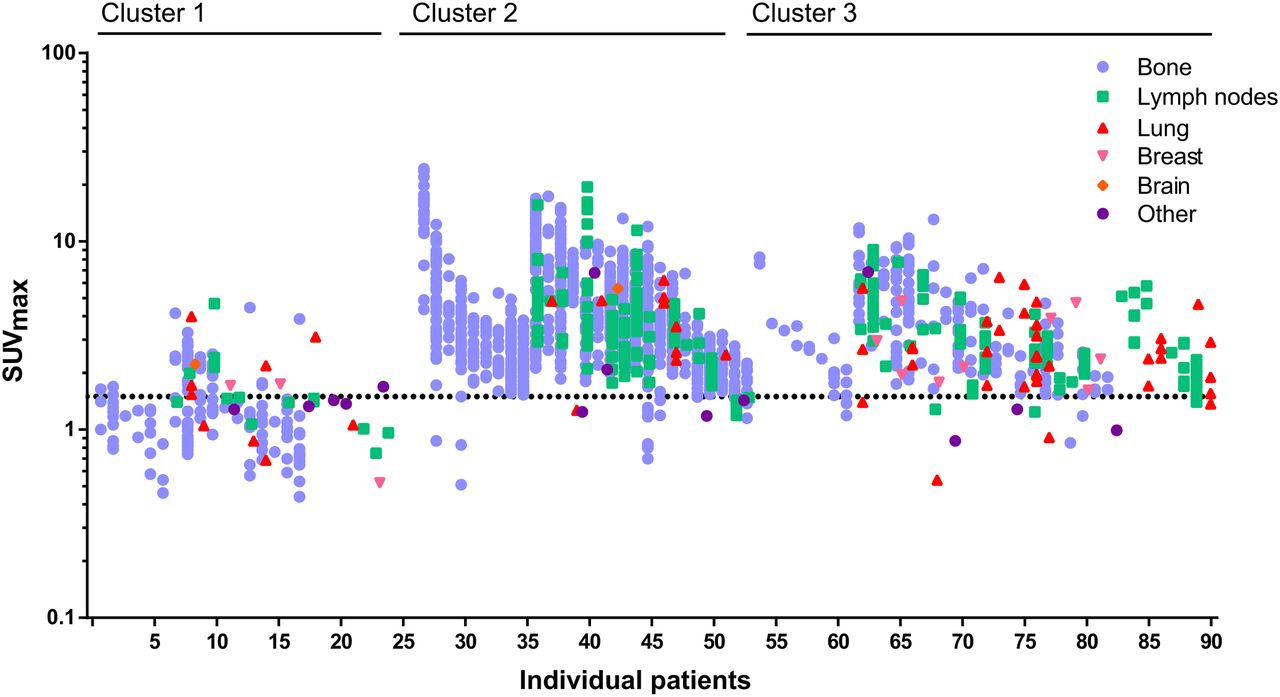
In total, 1,617 lesions were identified in 91 patients. These lesions were identified on either CT (n = 181; 11.2%), on 18F-FES PET (n = 915; 56.6%), or both (n = 521; 32.2%). Lesions were present in bone (78%), lymph nodes (15%), lung (4%), liver (2%), breast (1%), brain (0.1%), and other sites (1%). Distribution of metastases by their location is presented in Table 2. The median number of lesions per patient was 9 (range, 1–110). The 18F-FES uptake of all metastases in the 91 individual patients is depicted in Figure 1.
Sites of Metastases

Distribution of metastases per patient. Distribution and 18F-FES uptake of all metastases (n = 1,617) in 91 individual patients. Bone (blue), lymph node (green), lung (red), breast (pink), brain (orange), and other (purple) lesions are presented. Patients are categorized on the basis of subgroups derived from the cluster analysis.
Inter- and Intrapatient Heterogeneity of 18F-FES Uptake by Metastases
Median SUVmax per patient varied between 0.54 and 14.21. The SUVmax of 18F-FES–positive lesions varied up to 11-fold within individual patients (range per patient, 1.8–19.4). Most patients had one or more 18F-FES–positive lesions (78 patients; 86%); in 45 patients (49%), all lesions were 18F-FES–positive. In 44 patients (48%), one or more negative lesions were identified; in 11 patients (12%) only 18F-FES–negative lesions were detected. Thus, in 33 patients (36%) 18F-FES–positive as well as –negative lesions were identified. Two patients had only liver metastases (2%). Univariate analysis showed a trend toward lower SUVmax for patients with human epidermal growth factor receptor 2–positive primary disease (geometric mean SUVmax, 1.68 [1.10–2.52]) compared with human epidermal growth factor receptor 2–negative primary disease (geometric mean SUVmax, 2.57 [2.15–3.06]) (P = 0.058). The coefficient of variation was high for all metastatic sites, namely 61% for lung metastases, 47% for lymph node metastases, and 57% for bone metastases.
With agglomerative hierarchical clustering of imaging features, 3 clusters of patients were identified (Table 3; Supplemental Fig. 2). The clusters identified with this unbiased approach correspond with distinct patterns characterized by particular metastatic sites and 18F-FES uptake. As shown in Table 3, patients in group 1 (n = 26, 29%) have the lowest number of metastases, which are almost always visible on CT but are seldom 18F-FES PET–positive. On the other hand, metastases from patients in group 2 (n = 27, 30%) and group 3 (n = 38, 42%) are nearly always 18F-FES PET–positive and are visible on CT in about 50%. The predominant difference between group 2 and 3 is the number of metastases, with a median of 33 metastases per patient in group 2 (particularly bone metastases). The percentage of patients using ER antagonists was different between the clusters (group 1, 46%; group 2, 11%; and group 3, 24% ([P = 0.013]), but ER antagonist use did not contribute to the cluster formation.
Three Distinct ER-Positive Metastatic Breast Cancer Subgroups as Identified by Agglomerative Hierarchical Cluster Analysis of 18F-FES PET/CT
Pattern of Varying 18F-FES Uptake by Metastases, per Site
18F-FES uptake in metastases differed per site in the body. Geometric mean SUVmax of bone metastases was 2.61 (95% CI, 2.31–2.94) compared with 2.29 (95% CI, 2.00–2.61) for lymph nodes and 2.23 (95% CI, 1.88–2.64) for lung metastases. Lymph node metastases showed on average 12.4% (95% CI, 6.2–18.3; P < 0.001) and lung metastases 14.7% (2.5–25.5; P = 0.021) lower SUVmax than bone metastases. These differences remained present after correction for recent ER antagonist use (respectively, 12.4% and 14.4% decrease).
Without taking clustering of metastases within patient into account, 90.4% of all nonliver metastases were 18F-FES–positive and 9.6% were 18F-FES–negative using the SUVmax threshold of 1.5. Bone, lymph node, and lung metastases were 18F-FES–negative in, respectively, 8.9% (95% CI, 7.5–10.6), 8.2% (95% CI, 5.4–12.4), and 15.0% (95% CI, 8.1–26.1) (not significant; Fisher exact test P = 0.242). Patients for whom all metastases were 18F-FES–positive had on average more metastases than patients with one or more 18F-FES–negative metastases (23 vs. 12 metastases; independent sample t test P = 0.020). When taking these interpatient differences into account by multilevel analysis, the percentage 18F-FES–positive lesions also did not differ according to metastatic site (compared with bone metastases, the difference in 18F-FES positivity rate was −2.4% [95% CI, −5.6 to 0.8; P = 0.15] for lymph node and −3.0% (95% CI, −9.3 to 3.2; P = 0.35] for lung metastases). These results were also not affected by recent ER antagonist use.
Pattern of 18F-FES Uptake by Normal Surrounding Tissue, per Location
Background SUVmax in healthy tissue differed per location (Fig. 2). Geometric mean SUVmax was higher in bone than in lung, fat, and muscle (all P < 0.001). In the skeleton, background uptake also differed per location. Of all background measurements excluding liver measurements, a remarkable 9% were higher than the SUV threshold of 1.5, namely in fat, muscle, femur, femur head, thoracic spine, and lumbar spine. In the lumbar spine, 54% of the background measurements exceeded the SUVmax of 1.5. In lung, skull, and cervical spine, no background measurements reached the prior set threshold of 1.5.
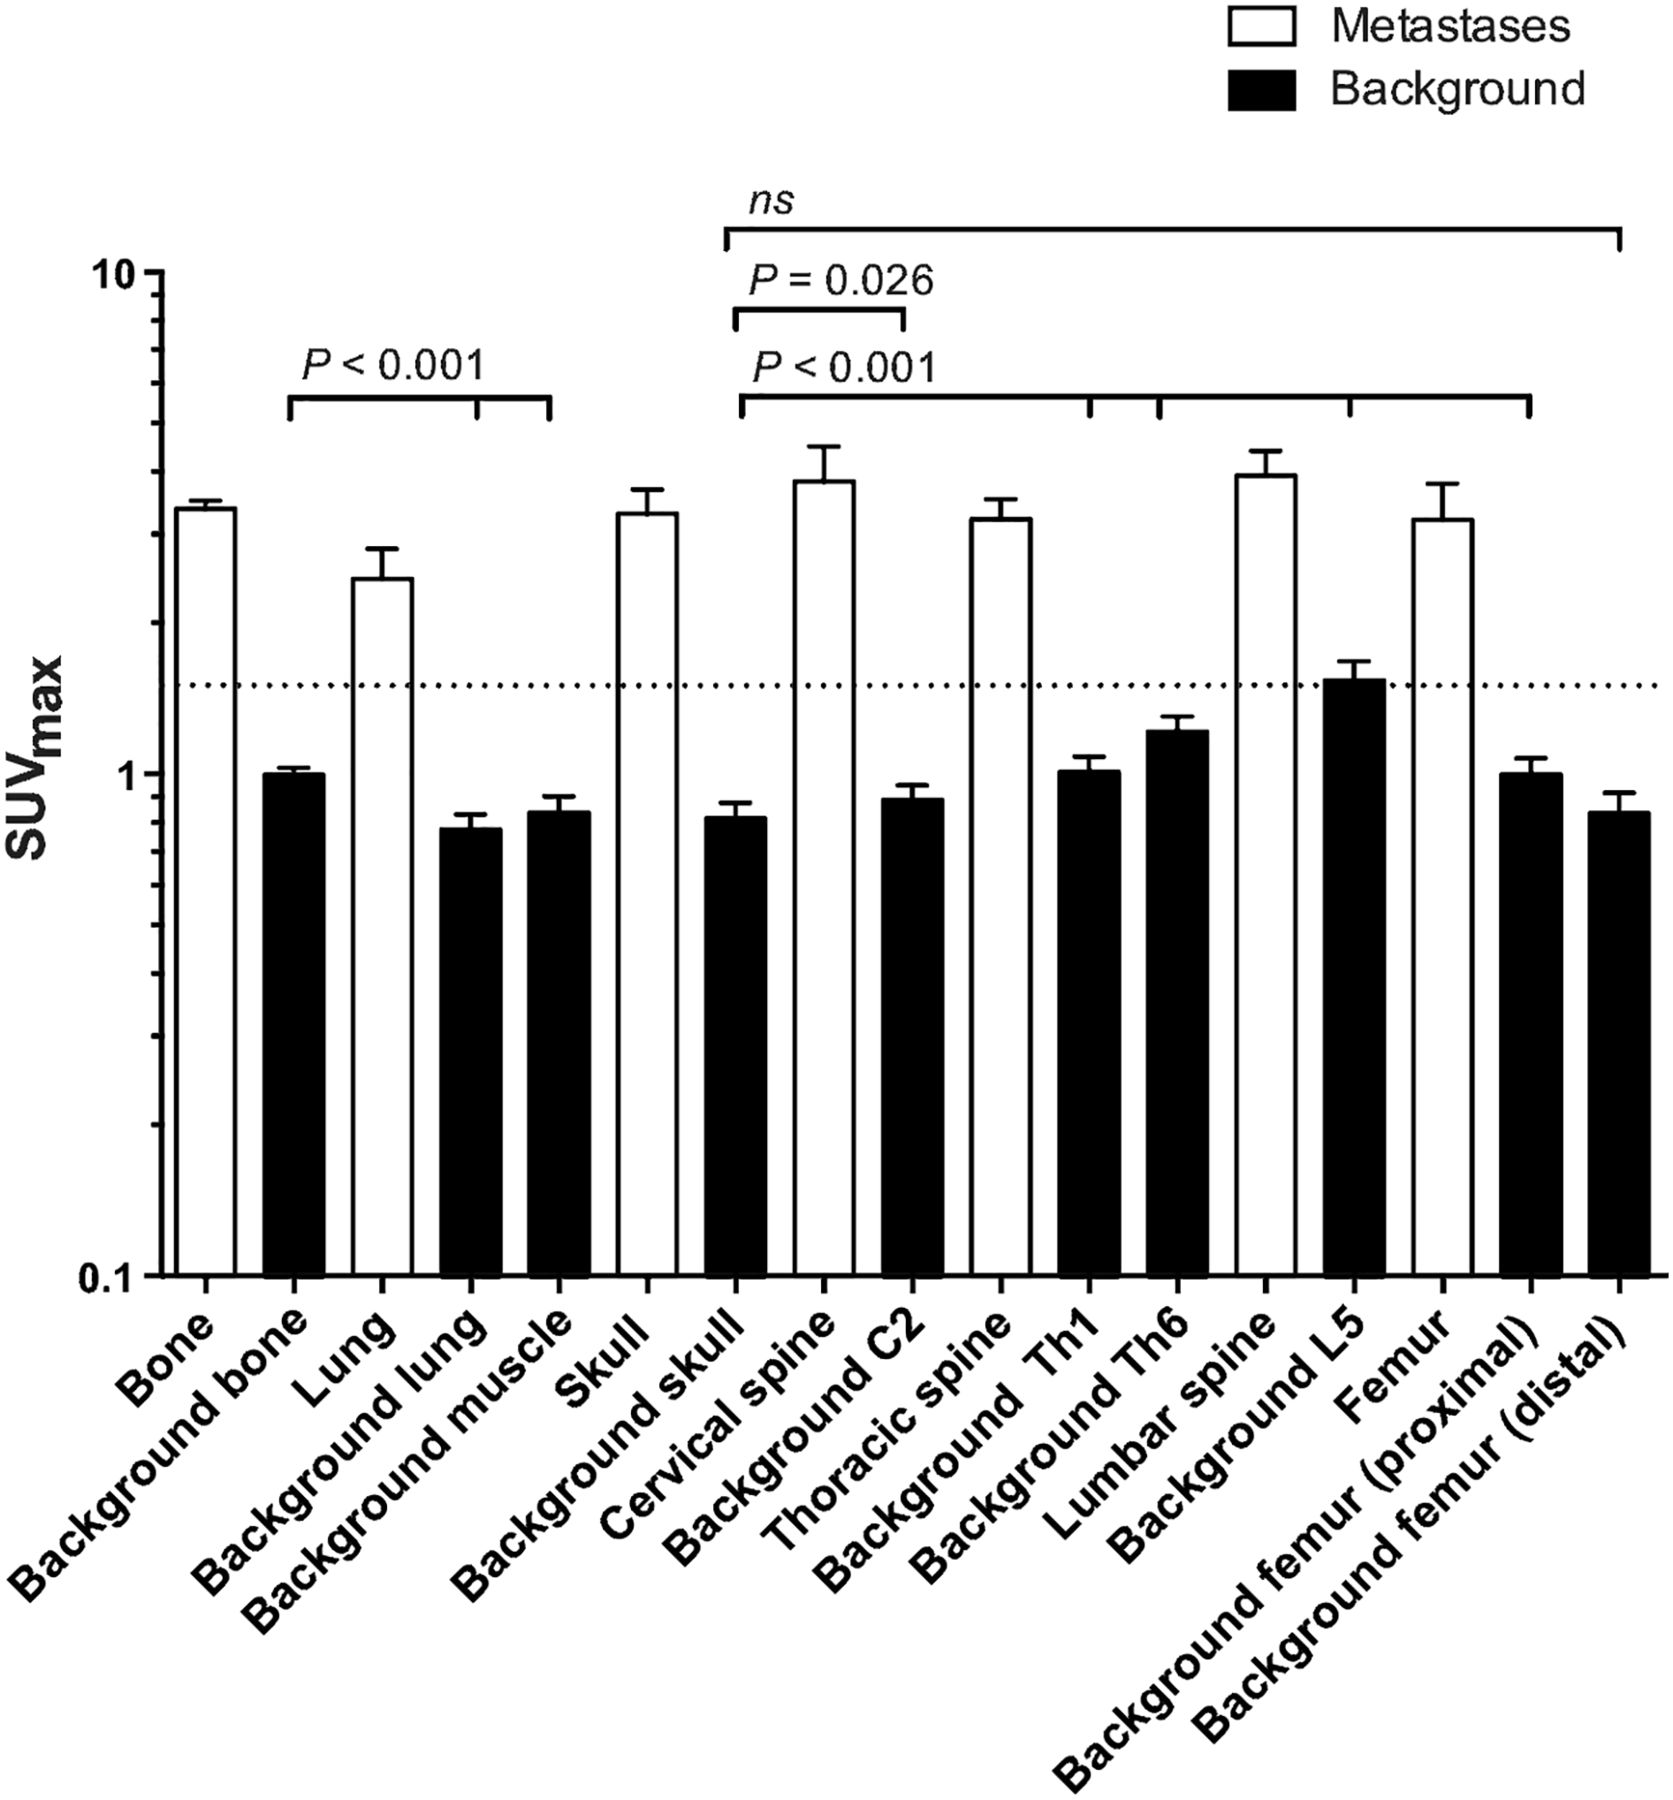
Median 18F-FES uptake in healthy tissues. Geometric mean SUVmax was 0.99 (95% CI, 0.95–1.04) in bone, 0.77 (95% CI, 0.72–0.84) in lung, 0.64 (95% CI, 0.59–0.96) in fat, 0.84 (95% CI, 0.77–0.91) in muscle, and 15.43 (95% CI, 14.25–16.70) in liver (all P < 0.001 compared with bone). From lowest to highest background uptake, geometric mean SUVmax within skeleton was 0.82 (95% CI, 0.76–0.88) in skull, 0.83 (95% CI, 0.78–0.90) in distal femur, 0.89 (95% CI, 0.83–0.96) in cervical spine, 1.02 (95% CI, 0.95–1.09) in femur head, 1.02 (95% CI, 0.94–1.10) in thoracic spine Th1, 1.23 (95% CI, 1.14–1.33) in thoracic spine Th6, and 1.55 (95% CI, 1.41–1.68) in lumbar spine (all P < 0.001 compared with skull, except for cervical spine [P = 0.027] and distal femur [P = 0.62]).
Effect of ER Antagonists on 18F-FES Uptake in Metastases
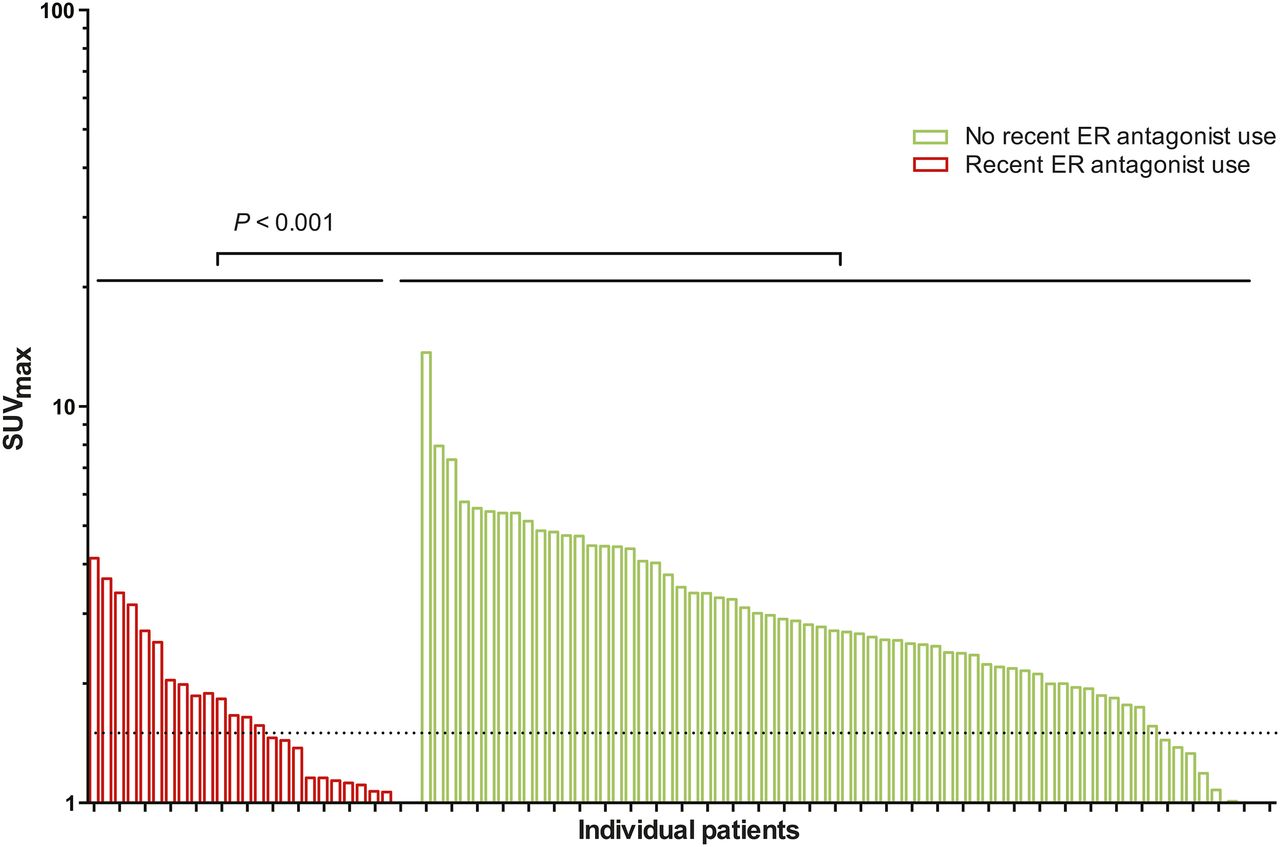
The geometric average of SUVmax of metastases was 42.1% lower (95% CI, −26.6 to 52.7; P < 0.001) in patients who did versus those who did not recently use ER antagonists before 18F-FES PET, even after a median of 5.2 wk since end of ER antagonist use (Fig. 3). After adjustment for metastatic site, this association between ER antagonist use and SUVmax did not change. Also, the percentage of 18F-FES–negative lesions was higher in patients who only recently stopped ER antagonist use, with an absolute difference of 25.3% (95% CI, 16.3%–34.1%; P < 0.001). Again, adjustment for metastatic site did not affect these results. There was no difference seen in the effect of ER antagonist use for the different organs (bone, lung, lymph node, and other). No relation was observed between the duration of withdrawing from the ER antagonist and 18F-FES PET and 18F-FES uptake.

18F-FES uptake in tumor lesions per patient with and without ER antagonist use before 18F-FES PET. Twenty-eight patients were withdrawn from ER antagonists (median, 5.2; range, 3−11 wk) before 18F-FES PET. The geometric average of SUVmax was 42.1% lower (95% CI, −52.7% to −29.6%; P < 0.001) in patients using ER antagonists before PET than in patients who did not recently use ER antagonists.
There was no difference in 18F-FES uptake in normal tissue between patients who did versus those who did not recently use ER antagonists before 18F-FES PET (4.7% lower after ER antagonist use; 95% CI, −8.3% to 16.1%; P = 0.47). This result was independent of the anatomic site of the background tissue.
DISCUSSION
In this study, we show heterogeneity in 18F-FES uptake between tumor lesions within and between metastatic breast cancer patients with ER-positive tumors. Moreover, we show differences in 18F-FES uptake between healthy tissues. Additionally, we identified 3 subgroups of patients characterized by particular metastatic sites and 18F-FES PET/CT features.
To our knowledge, we are the first to evaluate on a large scale the use of simultaneous PET/CT with the 18F-FES tracer. We detected diversity between 18F-FES uptake in tumors within as well as between patients, underlining the heterogeneous character of breast cancer metastases in ER expression. Moreover, this approach better identifies 18F-FES–negative lesions. For clinical purposes, the main advantage of the 18F-FES PET/CT technique is that both molecular as well as anatomic information can be acquired simultaneously within 1 procedure. Heterogeneity in 18F-FES tumor uptake has also been evaluated in a retrospective study in 91 patients who had undergone 18F-FDG PET within 30 d of 18F-FES PET (17). This study, in which 505 lesions were identified in 91 patients, showed the development of 18F-FES–negative disease in 37% of patients with a previous ER-positive biopsy result. In addition, it detected only few patients who had highly discordant 18F-FES uptake across tumor sites.
Although all patients included in our study had biopsy-proven ER-positive disease (primary or metastatic), 48% of the patients had one or more 18F-FES–negative lesions. Moreover, 36% of the patients had both 18F-FES–positive and 18F-FES–negative lesions, indicating heterogeneous disease. Previous studies have shown that 18F-FES– negative lesions are predictive for the absence of response to endocrine therapy (18).
Although the existence of tumor heterogeneity is evident, there is an ongoing debate on how to characterize this heterogeneity further and how to personalize clinical trials for optimizing treatment (19). Most studies focus on heterogeneity by gene expression analysis and transcriptomics, mainly on primary tumor material. With agglomerative cluster analysis on functional parameters as input variables including 18F-FES uptake and metastatic site, we identified 3 distinct patterns. These clusters were mainly characterized by differences in number of metastases, metastatic site, and 18F-FES uptake. Thus, in the apparent heterogeneous group of ER-positive breast cancer, several characteristics are shared by multiple patients that might indicate communal tumor evolutionary aspects. Similar to the predictive capacity of gene expression analysis for primary breast cancer, the identified imaging clusters for 18F-FES PET/CT may aid in predicting treatment response in the metastatic setting.
Heterogeneity in 18F-FES uptake could partly be explained by differences in organ characteristics, because bone metastases had higher 18F-FES uptake than nodal and pulmonary metastases. An earlier study, which evaluated ER expression in primary tumor and metastases by a radioactive binding assay on cytosol, described no difference between metastatic sites regarding ER expression (20). However, lung, bone, and liver metastases were not included in this analysis and ER expression was quantified differently from the current golden immunohistochemical standard and was scored dichotomously. In our study, interestingly, not only did bone metastases have higher 18F-FES uptake, but also healthy bone had higher uptake than healthy lung and fat tissue. Bone shows estrogen responsiveness, mediated via ERα. For example, estrogen-mediated activation of ERα in osteoblasts attenuates bone resorption (21). ER-positive metastatic breast cancer is predominantly characterized as bone disease (22). Also, in our study in patients with immunohistochemically proven ER-positive breast cancer, most metastases were present in bone (78%). Together, these observations are in line with relatively high background estrogen signaling in normal bone compared with other tissues. This could possibly attract ER-positive luminal breast cancer cells to the skeleton. Colonization of cancer cells has an organ-specific character, which demands distinct cancer cells as well as host organ properties (23). Several microenvironmental factors, capable of modulating ER expression and signaling activity, are known to be differentially expressed among various organs (24,25).
In addition, other techniques can contribute to a better understanding of tumor heterogeneity such as synchronous biopsies of primary and metastatic lesions as well as autopsies (26,27). In this study, we show lower 18F-FES uptake in lymph node and pulmonary metastases than bone metastases. This might imply that patients with bone metastases show better response to hormonal therapy than patients with pulmonary and or lymph node metastases. Evaluating heterogeneity by 18F-FES PET might aid in selecting patients who respond on endocrine therapy (28).
In agreement with European Association of Nuclear Medicine guidelines (14), we used an SUVmax as the outcome parameter. Large lesions, however, tend to have higher SUVmax than small lesions, as statistically more voxels can be affected by extreme noise that leads to the hottest voxel (29). We have used a threshold of 1.5 or greater for the identification of 18F-FES–positive lesions. Others have used an SUVmax cutoff of 2.0 (30). However, direct evidence for either of these thresholds is lacking (10). In our study, the 1.5 threshold was exceeded by background 18F-FES uptake in various normal tissues. This could implicate the use of background-corrected SUVmax instead of absolute SUVmax. Others have suggested the use of a database-based correction, based on the average SUVmax of different organs (bone, lung, lymph nodes) in the setting of androgen receptor imaging with 16β-18F-fluoro-5α-dihydrotestosterone PET (31). Our results, however, indicate that a correction on an individual basis, and per organ, is likely preferable, because the background uptake can vary between patients and locations within the same patient. Moreover, background correction would provide a more realistic quantification of the response rate in serial 18F-FES PET scanning before and after intervention with antihormonal therapy as the SUV threshold is not included in the calculation. For this purpose, background subtraction has been used in a recent published study (32).
Finally, we were able to assess in a larger group the effects of recent ER antagonist use on 18F-FES uptake. Currently, the optimal time of withdrawal of ER antagonists before PET scanning that is necessary to diminish the influence of these drugs on 18F-FES uptake is unknown. For patients who stopped 3- to 12-wk use of ER antagonists before 18F-FES PET, we show 42.1% lower 18F-FES uptake than in patients not using these drugs before scanning. We were not able to show a relation between the time of withdrawal and 18F-FES uptake. On the basis of these data, we can conclude that ER antagonists, even after the currently used withdrawal time of 5 wk in study protocols, still can considerably influence 18F-FES uptake. This could be caused by competition for ER, downregulation of ER, or selection for ER-negative clones in patients treated with ER antagonists.
Our study has limitations. We retrospectively reanalyzed existing 18F-FES PET scans. Metastases were identified on low-dose CT scans if no contrast-enhanced CT scan was available, which could have led to an underestimation of the total number of metastases. We have applied a 10-mm threshold for lesions detected on CT scans to rule out that 18F-FES uptake in tumor lesions was only negative due to its lower resolution than the CT scan. This could have underestimated the number of 18F-FES–negative lesions. However, if lesions smaller than 10 mm would have been included, false-negative 18F-FES PET findings are more likely to occur and an unreliably high number of 18F-FES–negative lesions would have been found. CT and 18F-FES PET scans show high specificity for detection of (bone) metastases, and therefore the incidence of false-positive lesions is probably low (12,33).
CONCLUSION
18F-FES uptake is heterogeneous between tumor lesions in metastatic breast cancer patients with ER-positive tumors and is influenced by anatomic site. Moreover, differences in 18F-FES uptake are seen between healthy tissues. Additionally, we identified 3 subgroups of patients characterized by particular metastatic sites and 18F-FES PET/CT features. This study improves the insights in differences between and within patients with ER-positive tumors and can eventually support intervention strategies that can adequately address this heterogeneity.
Acknowledgments
This study was supported by Dutch Cancer Society grant RUG 2010-4739, ERC advanced grant 293445 (OnQview), and Alpe d'HuZes grant RUG 2012-5565 (IMPACT).
Footnotes
↵† Deceased.
Published online Mar. 30, 2018.
- © 2018 by the Society of Nuclear Medicine and Molecular Imaging.
REFERENCES
- Received for publication July 27, 2017.
- Accepted for publication March 21, 2018.


Jump to section
Related Articles
Cited By...
- No citing articles found.