


Abstract
3′-Deoxy-3′-18F-fluorothymidine (18F-FLT), a partially metabolized thymidine analog, has been used in preclinical and clinical settings for the diagnostic evaluation and therapeutic monitoring of tumor proliferation status. We investigated the use of 18F-FLT for detecting and characterizing genetically engineered mouse (GEM) high-grade gliomas and evaluating the pharmacokinetics in GEM gliomas and normal brain tissue. Our goal was to develop a robust and reproducible method of kinetic analysis for the quantitative evaluation of tumor proliferation. Methods: Dynamic 18F-FLT PET imaging was performed for 60 min in glioma-bearing mice (n = 10) and in non–tumor-bearing control mice (n = 4) by use of a dedicated small-animal PET scanner. A 3-compartment, 4-parameter model was used to characterize 18F-FLT kinetics in vivo. For compartmental analysis, the arterial input was measured by placing a region of interest over the left ventricular blood pool and was corrected for partial-volume averaging. The 18F-FLT “trapping” and tissue flux model parameters were correlated with measured uptake (percentage injected dose per gram [%ID/g]) values at 60 min. Results: 18F-FLT uptake values (%ID/g) at 1 h in brain tumors were significantly greater than those in control brains (mean ± SD: 4.33 ± 0.58 and 0.86 ± 0.22, respectively; P < 0.0004). Kinetic analyses of the measured time–activity curves yielded independent, robust estimates of tracer transport and metabolism, with compartmental model–derived time–activity data closely fitting the measured data. Except for tracer transport, statistically significant differences were found between the applicable model parameters for tumors and normal brains. The tracer retention rate constant strongly correlated with measured 18F-FLT uptake values (r = 0.85, P < 0.0025), whereas a more moderate correlation was found between net 18F-FLT flux and 18F-FLT uptake values (r = 0.61, P < 0.02). Conclusion: A clinically relevant mouse glioma model was characterized by both static and dynamic small-animal PET imaging of 18F-FLT uptake. Time–activity curves were kinetically modeled to distinguish early transport from a subsequent tracer retention phase. Estimated 18F-FLT rate constants correlated positively with %ID/g measurements. Dynamic evaluation of 18F-FLT uptake offers a promising approach for noninvasively assessing cellular proliferation in vivo and for quantitatively monitoring new antiproliferation therapies.
There is a growing need to develop suitable in vivo imaging strategies for sensitively detecting, characterizing, and monitoring therapeutic responses in malignant brain tumors and for complementing histologic analyses. Serial objective imaging readouts of key metabolic and physiologic processes may improve the diagnostic and therapeutic management of brain tumors by enabling the earlier identification of tumor progression, recurrence, and treatment failure. In patients with gliomas, tumor cell proliferation has been identified as an important surrogate marker of survival, as determined by staining of ex vivo biopsy specimens with proliferation markers, such as Ki67 (1–3). Such in vitro determinations, however, may fail to predict actual therapeutic responsiveness because of biopsy sampling errors, intratumoral variations in pertinent biologic properties, or nonuniform drug delivery (4).
Cell proliferation imaging by PET may address the foregoing limitations, providing a serial 3-dimensional quantitative assessment of tumor growth or regression in vivo. The radiolabeled thymidine analog 3′-deoxy-3′-18F-fluorothymidine (18F-FLT) is well suited for this purpose and has been used to monitor tumor uptake in models of untreated (5–7) and treated (8–13) preclinical tumors in conjunction with radiation or antiproliferation therapies and, more recently, to characterize both static and kinetic changes in malignant brain tumor uptake in patients (14–20). After its intravenous administration, 18F-FLT is distributed extracellularly and is subsequently transported into the cytosol, where it is phosphorylated by thymidine kinase 1, an enzyme overexpressed during the DNA synthesis phase of the cell cycle (21). In its phosphorylated form, 18F-FLT is metabolically “trapped” in the cell, with essentially no incorporation into DNA. Its limited transport across the intact blood–brain barrier and the absence of proliferating cells in the normal adult brain result in low levels of 18F-FLT within the cranium. In contrast, 18F-FDG exhibits high physiologic uptake in the normal brain. Thus, tumor-to-normal brain uptake ratios and tumor specificity are greater for 18F-FLT than for 18F-FDG (18,22).
Brain tumor 18F-FLT uptake measured at various times after injection has been shown to correlate with histopathologic proliferation markers, such as Ki67 or proliferative cell nuclear antigen, in preclinical models and patient studies (4,11,18). In addition, several clinical investigations have assessed uptake in brain tumors dynamically in conjunction with 2-tissue-compartment (4-rate-constant) models (14,15,19), with one such study correlating uptake ratios with rate constants in patients with gliomas (19). Kinetic modeling of dynamic data permits rate constants for the initial transport and subsequent metabolic (“trapping”) phases of 18F-FLT uptake to be independently evaluated, the latter rate constant being directly related to the number or rate of proliferating cells within the tumor volume. The ability to characterize these respective components of time–activity curves may be particularly important in distinguishing changes in tumor proliferation from alterations in 18F-FLT transport, because both factors contribute to overall radiotracer uptake.
In preclinical models, there is a need to implement dynamic imaging and kinetic analysis methods to derive more accurate and specific estimates of functional parameters characterizing tumor metabolism. Unlike recent clinical investigations, only a few preclinical studies have used dynamic imaging for the purpose of determining the time after injection at which maximum tracer uptake occurs. Improving measurements of key biologic parameters that can serve as surrogate markers of tumor responses in clinically relevant mouse models is critical for enabling the future optimization of diagnostic and treatment planning protocols in patients. Along with correlative histologic or serum markers, such methods might enable earlier changes to be made to protocols prescribing conventional therapies or new single or combination pathway-specific inhibitors. Moreover, the application of kinetic analyses to preclinical models may permit relevant tumor biology to be elucidated under conditions that may not be feasible in patients with brain tumors. Such kinetic methods may additionally be applied to the in vivo evaluation and optimization of new diagnostic probes for tumor detection and characterization.
In the present work, we investigated whether 18F-FLT can be used to detect and assess proliferative activity in genetically engineered mouse (GEM) high-grade glioma models that are thought to accurately recapitulate the human disease. We successfully developed and implemented a compartmental modeling approach that permits the discrimination of tracer transport and delivery from tumor proliferation. Compartmental model tracer rate constants were estimated by use of image-derived input and tissue time–activity data (i.e., left ventricular blood clearance and tumor uptake, respectively). To our knowledge, no studies reported to date have dynamically assessed uptake in preclinical brain tumor models with evaluation of the relevant rate constants. We sought to clarify the extent to which tracer transport and metabolism contribute to overall tumor uptake, and we correlated static uptake measurements (percentage injected dose per gram [%ID/g]) at 1 h (i.e., a 59- to 60-min time interval) with the metabolic rate constants.
MATERIALS AND METHODS
Radiopharmaceuticals
18F-Fluoride in 97%-enriched 18O-water was produced through the 18O(p,n)18F nuclear reaction by use of an EBCO cyclotron and target system. 18F-Fluoride ion (11.1 GBq) was trapped on a QMA cartridge and eluted with a mixture of Bu4NHCO3 and water into vessel 1, containing 1 mL of CH3CN. The solution was vacuum dried with 3.0 mL of CH3CN at 80°C. The precursor, butoxycarbonyl-dimethoxytrityl-nosyl-lyxothymidine (20 mg; ABX), was dissolved in 0.4 mL of CH3CN, and the reaction mixture was heated at 150°C for 10 min. The intermediate was passed through a silica Sep-Pak (Waters Associates) and transferred to vessel 2; this step was followed by the addition of ether (1.5 mL, 2 times) to wash vessel 1 and the silica Sep-Pak. The reaction mixture was dried under vacuum at 80°C until the volume was reduced to 0.1 mL. The dimethoxytrityl-protecting group was removed by treatment with 0.4 mL of 1N HCl for 5 min at 80°C. After neutralization with 1.3 mL of 2N sodium acetate, the reaction mixture was purified by use of a Luna C18 column (Phenomenex) and eluted with 8% ethanol in water. The 18F-FLT peak sample was collected and dried in a rotary evaporator. The final product was dissolved in 3% ethanol:saline to the desired volume and passed through a 0.22-μm sterile filter into a 5.0-mL sterile vial. The radiochemical yield of 18F-FLT at the end of synthesis was 20% decay corrected to the end of bombardment.
Generation of Mouse Brain Tumors
All animal experiments were done in accordance with protocols approved by the Institutional Animal Care and Use Committee of Memorial Sloan-Kettering Cancer Center and followed National Institutes of Health guidelines for animal welfare. Within 24 h of birth, Ntv-a/Ink4a−/−Arf−/− mice were injected intracranially with 104 DF-1 cells infected with and producing RCAS-PDGF retroviral vectors as previously described (23). Mice were monitored daily for symptoms of tumor development. All imaging experiments were performed on mice at 4–6 wk of age. Non–tumor-bearing mice (n = 4) served as controls.
Small-Animal PET Imaging
Imaging was performed by use of a dedicated small-animal PET scanner (Focus 120 microPET; Siemens Medical Solutions USA, Inc.). Mice were maintained under 2% isoflurane anesthesia in oxygen at 2 L/min during the entire scanning period. One-hour list-mode acquisitions were initiated at the time of injection of 25.9–55.5 MBq (700–1,500 μCi) of 18F-FLT via the lateral tail vein. An energy window of 350–700 keV and a coincidence timing window of 6 ns were used. The resulting list-mode data were sorted into twelve 5-s (0–1 min) and fifty-nine 60-s (2–60 min) time bins and into 2-dimensional histograms by Fourier rebinning, and transverse images were reconstructed in a 128 × 128 × 96 matrix by filtered backprojection. The image data were corrected for nonuniformity of the scanner response, dead time count losses, and physical decay to the time of injection. No correction was applied for attenuation, scatter, or partial-volume averaging. The measured reconstructed spatial resolution of the Focus 120 scanner is ∼1.6 mm full width at half maximum at the center of the field of view. The counting rates in the reconstructed images were converted to activity concentrations (percentage injected dose per gram of tissue [%ID/g]) by use of a system calibration factor (0.037 MBq/mL/cps/voxel) derived from the imaging of a mouse-size water-equivalent phantom containing 18F.
Small-Animal PET Image Analysis
Three-dimensional region-of-interest (ROI) analysis of the reconstructed images was performed by use of ASIPro software (Siemens Medical Solutions USA, Inc.) to determine the mean, maximum, and SD of 18F-FLT uptake (%ID/g) in the tumor, the normal brain, and the left ventricle (LV). In glioma-bearing mice, ROIs were manually placed over the tumor region. Non–tumor-bearing mice served as controls for the assessment of 18F-FLT uptake, because the small brain size of the mice and the diffuse, infiltrative nature of the tumors limited differentiation of the tumors from normal brain in the same animal. In control animals, volumetric ROI analysis was performed by placing an 8-mm-inner-diameter ellipsoidal ROI over the brain region and recording the mean, maximum, and SD of the activities (%ID/g).
Blood Sampling and Generation of Arterial Input Functions
Given the small size of the mice used for the study, it was not feasible to collect serial blood samples to derive an arterial input function. Blood-pool time–activity curves were obtained by placing an ROI over the LV in the transaxial slice with the largest cross-sectional area of the LV. Several venous samples, taken from the tails of several mice over the course of the study, were assayed for radioactivity to calibrate the image-derived LV input functions.
Compartmental Modeling
A 3-compartment, 4-rate-constant model, previously validated for somatic tissues (24) and more recently applied to several patient studies (14,15,19,25), was used to describe 18F-FLT kinetics in tumors (Fig. 1). In short, there was an initial transfer of 18F-FLT between the arterial blood (or plasma), the first compartment, and an exchangeable tissue space, the second compartment. The third compartment reflected 18F-FLT metabolism (retention or trapping) (Fig. 1). The SAAM II program (26–28) was used to implement the compartmental model in Figure 1.
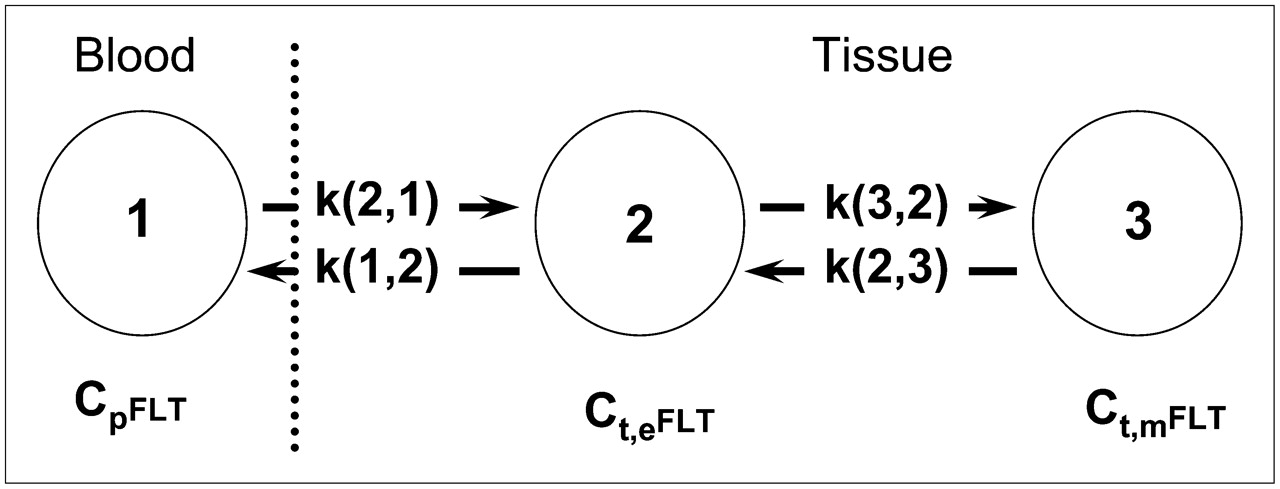
Three-compartment, 4-parameter model of 18F-FLT kinetics. 18F-FLT is transported from vascular space (1) into tissue, comprising exchangeable compartment (2) and metabolically trapped (i.e., phosphorylated) compartment (3). Four rate constants describe transfer among these compartments. CpFLT = concentration of 18F-FLT in arterial plasma; Ct,eFLT = concentration of 18F-FLT in exchangeable compartment; Ct,mFLT = concentration of phosphorylated (i.e., trapped) 18F-FLT.
According to this model, k(2,1) (or K1) and k(1,2) (or k2) are rate constants reflecting tracer influx and efflux between the vascular and tissue spaces, respectively, and k(3,2) (or k3) describes the metabolic retention (phosphorylation) of the tracer (Fig. 1). The potential for reversible tracer trapping is addressed by incorporating the rate constant k(2,3) (or k4), which represents tracer efflux out of the imaging region because of nucleoside transport or dephosphorylation (29,30). Metabolic flux (KFLT) was calculated as follows (24): KFLT = (K1 × k3)/(k2 + k3).
Because 18F-FLT has been found to be metabolically stable in both the plasma and the urine of tumor-bearing mice over the course of at least 1 h (11), no correction was made for the accumulation of metabolites in blood over the course of the acquisition. Correction was made for partial-volume averaging of tracer uptake. A fixed value of 5% was used for the cerebral blood volume (24). Whole-blood and plasma activity concentrations were considered to be equal (24).
Statistical Analysis
Statistical analyses were performed by use of Excel 2003 (Microsoft) and SigmaPlot (version 8.0; SPSS, Inc.). Differences between tumor-bearing and non–tumor-bearing mice with respect to mean 18F-FLT uptake (%ID/g) and kinetic parameters were tested for significance by use of unpaired t tests. Average tumor uptake values were correlated with mean k3, KFLT, and K1 values by linear regression analysis. Differences were considered statistically significant at P < 0.05.
RESULTS
18F-FLT Uptake in Mouse High-Grade Gliomas and Normal Brain Tissue
The tumor time–activity curves showed a rapid rise and no subsequent (40–60 min) decline in activity. Figure 2 shows representative transverse images of 18F-FLT in normal brain tissue (i.e., non–tumor-bearing animals) (Fig. 2A) and in mouse high-grade gliomas (Fig. 2B) at 1 h (i.e., a 59- to 60-min time interval) after 18F-FLT injection. Although no appreciable tracer uptake was seen in the brains of the control animals, the high-grade gliomas were clearly seen as an area exhibiting heterogeneous tracer uptake, with a more intense central region presumably reflecting greater proliferative activity. Not unexpectedly, a range of tumor uptake values was observed. Mean ± SD and maximum %ID/g values for each of the 10 tumor-bearing mice and 4 control mice are shown in Table 1. Mean tumor uptake (%ID/g) varied by a factor of 2.6, ranging from a minimum of 2.32 ± 0.27 to a maximum of 5.97 ± 0.67, with a group mean of 4.33 ± 0.58. Similar differences (nearly a factor of 3) were found for the corresponding range of maximum tumor uptake (%ID/g). In contrast, substantially lower mean %ID/g values were found in the brains of non–tumor-bearing mice, ranging from 0.46 ± 0.10 to 1.68 ± 0.38, with a group mean of 0.86 ± 0.22. Differences between control and tumor-bearing mice with respect to mean tumor uptake (%ID/g) were statistically significant at P < 0.0004 (Fig. 3A).
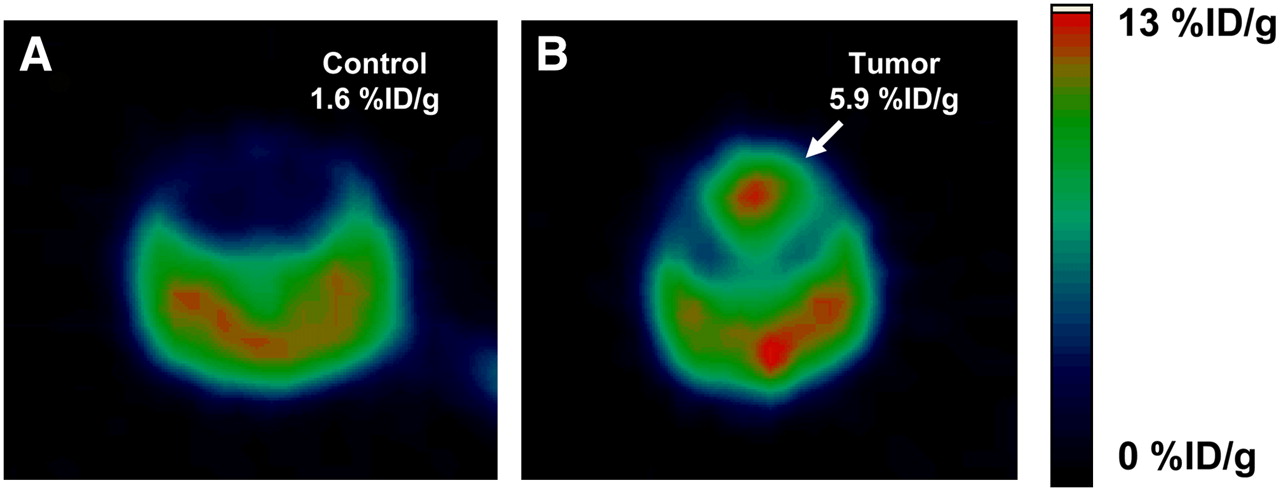
Transverse PET images of 18F-FLT uptake in non–tumor-bearing (control) (A) and tumor-bearing (B) mouse brains 60 min (i.e., 59–60 min) after intravenous injection. Intense accumulation of radiotracer was seen in GEM high-grade glioma model at level of maximum activity, with no appreciable intracranial uptake being seen in absence of tumor. Mean %ID/g values are indicated.

Static and dynamic measurements of 18F-FLT uptake in tumor and control mice in terms of %ID/g (mean ± SD) (A), kinetic parameters (B), and correlations between %ID/g and retention rate constant, k3 (C), and metabolic flux, KFLT (D). Double asterisks in A indicate statistically significant difference in comparison with results for control mice (P < 0.0004). Asterisks in B indicate mean parameter values of less than 10−5 and therefore essentially zero. Significantly higher values for %ID/g and all parameters, except for K1, were observed in tumors compared with control mouse brains, and good correlations were observed between k3 or KFLT and %ID/g. †Rate constants are expressed in mL/min/g; remaining rate constants are in units of min−1.
Mean and Maximum 18F-FLT Uptake in Spontaneous High-Grade Gliomas and Non–Tumor-Bearing Mice
Kinetic Analyses of 18F-FLT Uptake
To characterize 18F-FLT uptake kinetics in the spontaneous high-grade glioma model and in normal brain tissue, we generated time–activity curves for tumor-bearing (n = 10) and non–tumor-bearing (n = 4) cerebral hemispheres. Figure 4 shows differences in the magnitude and rate of 18F-FLT uptake over a 1-h period among representative mice without (Fig. 4A) and with (Figs. 4B and 4C) brain tumors. 18F-FLT uptake in the representative control brain (Fig. 4A) was 0.71 ± 0.21 %ID/g, corresponding to very low (i.e., nearly zero) values for k3 (5.0 × 10⁻⁷/min) and KFLT (3.65 × 10⁻⁷ mL/min/g) (Table 2, control mouse 1). Figure 4D shows the measured time–activity curves and superimposed model fits for the LV (upper curve) and control brain (lower curve). The value for the k3 model parameter in the normal brain was at least 5 orders of magnitude lower than that in the brain tumor, consistent with the suggestion that 18F-FLT does not cross the intact blood–brain barrier to any appreciable degree.
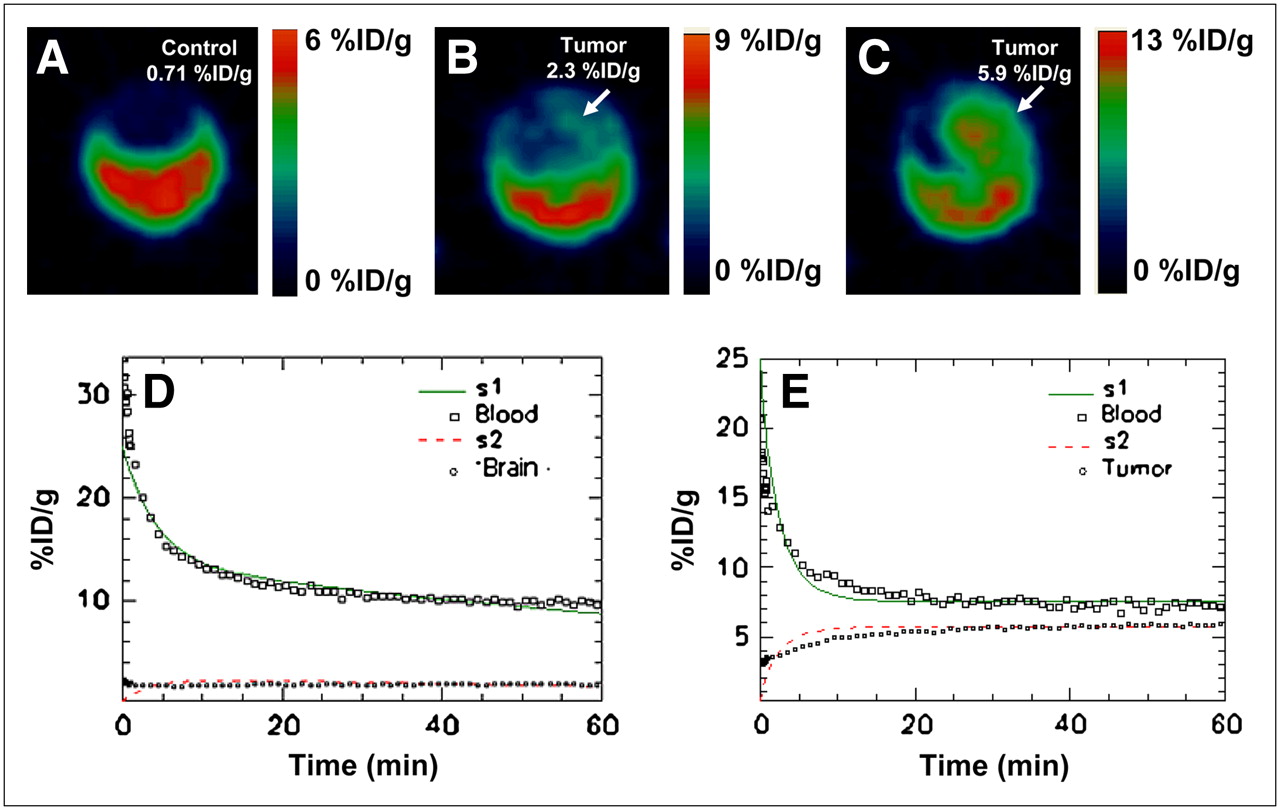
Transverse 18F-FLT PET images (A–C) and fitted time–activity curves (D and E) corresponding to representative control (A, mouse 1) and tumor-bearing (C, mouse 10) mice. Tumor-bearing mice (B and C) were selected on basis of minimum (B) and maximum (C) mean %ID/g values for groups of mice studied; latter values were compared with mean %ID/g for control mouse (A). Corresponding time–activity data were kinetically analyzed by compartmental modeling (D and E); fitted time–activity data are represented by solid or dashed curves, and measured time–activity data are represented by data points.
Kinetic Parameters for High-Grade Gliomas and Non–Tumor-Bearing Mice After 18F-FLT Injection, Derived for 3-Compartment Model
Tumor time–activity curves demonstrated an initial rapid rise in 18F-FLT uptake followed by more gradual uptake and subsequent stabilization of activity during the last 20 min of the study. Peak 18F-FLT uptake in tumors was observed at 30–60 min after injection and did not subsequently decline. Progressive increases in proliferative activity in representative brain tumor–bearing mice were reflected in successively higher levels of uptake at 1 h (Fig. 4B, 2.32 ± 0.27 %ID/g; Fig. 4C, 5.92 ± 0.59 %ID/g). The application of compartmental modeling to the LV and tissue time–activity curves of one of these tumor-bearing mice (Fig. 4C) generated good agreement between the measured and fitted values (Fig. 4E). The corresponding k3 value was found to be 0.502 ± 0.002/min (Table 2, tumor-bearing mouse 10), much higher than the corresponding value in normal brain tissue and reflecting increased tumor cell proliferation.
The mean and range of model parameter estimates for tumor-bearing and control mice are shown in Table 2 and are reasonably consistent with previously published model parameter averages and ranges (24). For all rate constants except K1, the differences between tumor-bearing and control mice were revealed to be statistically significant by unpaired t tests (Table 2 and Fig. 3B); for K1, the values for tumor-bearing and control mice were similar (0.431 ± 0.012 and 0.458 ± 0.014, respectively). This latter finding may be, in part, a reflection of the relatively low blood–tumor barrier permeability measured in these tumor models (Michelle S. Bradbury, unpublished results, August 2007). For all rate constants except K1, maximum and minimum values varied by approximately a factor of 5; for K1, larger variations were noted. A statistically significant correlation was found between k3 and 1-h 18F-FLT uptake in tumor tissue (correlation coefficient r = 0.85, P < 0.0025; Fig. 3C); a more moderate correlation was seen between KFLT and tumor uptake (correlation coefficient r = 0.61, P < 0.02; Fig. 3D). Although the early transport of 18F-FLT affects tumor uptake, a poorer correlation was found between K1 and 1-h uptake.
Compartmental modeling of non–tumor-bearing mice revealed that the average K1 value was significantly larger than all of the other computed rate constants, suggesting that the uptake of 18F-FLT in control mice was dominated by tracer transport. As expected, the k3 and KFLT values were equivalent and essentially equal to zero in non–tumor-bearing mice but were much larger in glioma-bearing mice, with means of 0.226 ± 0.013 min−1 and 0.146 ± 0.015 mL/min/g, respectively.
DISCUSSION
In the present study, we sought to characterize the kinetics of 18F-FLT uptake in a high-grade glioma model with defined genetic alterations that closely recapitulate human disease (31) to develop a practical noninvasive method for assessing cellular proliferation in vivo. Although several clinical studies have modeled the kinetics of 18F-FLT uptake in high-grade gliomas by applying compartmental analyses to estimate rate constants (14,15,19), to our knowledge such analyses have not been performed in preclinical brain tumor studies. Implementing such approaches would address the growing need to elucidate key metabolic and physiologic processes in a wide variety of tumor models. Such methods are receiving increasing attention in light of novel probe development, emerging pharmacologic therapies, and the growing use of spontaneous brain tumor models engineered to express genetic mutations characteristic of human malignancy.
18F-FDG has been widely used for imaging glucose transporter expression and hexokinase activity (32,33) and is commonly used for brain tumor diagnosis (34). However, limitations related to its nonspecific uptake in proliferating noncancerous cells or tissues (such as inflammatory cells or granulation tissue) and to the high glucose metabolism of normal brain tissue reduce its detection sensitivity and compromise its ability to monitor the therapeutic response of intracranial lesions (18,19,22). The proliferation marker 18F-FLT is known to be concentrated by a variety of tumors (25,35–37), including those in the central nervous system, and localizes only at very low levels in normal brain tissue. Moreover, because 18F-FLT metabolite levels in the blood and urine are known to be very low in mice (4,11), the modeling of 18F-FLT PET data can be simplified. This is not the case in humans, in whom the interstitial transport of the glucuronide conjugate of 18F-FLT, a blood metabolite, has necessitated the use of a correction factor in compartmental models (4,14).
A limitation in the use of these nucleoside tracers is the significantly higher (on the order of a factor of 10 (4,8)) endogenous blood thymidine levels in mice than in humans, with the possibility that thymidine may competitively inhibit thymidine kinase (38) and thereby suppress tissue 18F-FLT uptake (4). In one study (7), for example, serum thymidine levels measured at a single time point after the injection of 18F-FLT were found to be highly variable and were weakly correlated with uptake (%ID/g) (R2 = 0.40). On the other hand, other investigators reported that thymidine levels remained relatively constant in a given species (39). Although not done in the present study, measurement of serum thymidine levels may be warranted in future studies to correct measurements of tissue 18F-FLT uptake.
In the present study, 18F-FLT uptake values at 1 h after injection were found to be greater in brain tumors than in control mouse brains by a factor of 5, a highly statistically significant difference (P < 0.0004). However, in tumor models generally, a static image obtained at an arbitrary time point after injection may not coincide with the time of the maximum uptake or tumor-to-normal tissue contrast. Moreover, static uptake measurements cannot be used to distinguish increased tracer delivery (attributable to increased blood flow or extraction) from increased metabolic trapping and, therefore, may not reliably reflect cellular proliferation. The ability to distinguish between the delivery and retention components of radiotracer uptake may become particularly important in the evaluation of treatment responses. Without information on the relative contributions to overall uptake of the delivery and metabolic trapping of 18F-FLT, incorrect interpretations regarding tumor proliferation status can result, particularly under conditions in which delivery largely dictates overall tumor uptake; for example, reduced delivery of 18F-FLT to hypoperfused tumors may result in a spuriously low estimate of proliferation status. Because overall tracer uptake is critically affected by tissue perfusion, vascular permeability, and transport into the cell by nucleoside transporters (8), relevant physiologic information may contribute in future studies to further elucidation of the mechanistic basis of alterations in 18F-FLT uptake. Other factors affecting uptake include tumor heterogeneity and size, number of tumor cells in the proliferative phase of the cell cycle at the time of imaging, body temperature variations, the size and placement of ROIs (40), and the quality of the tracer injection.
Kinetic analysis with 3-compartment models has already been applied to 18F-FLT time–activity data clinically, with reversible transport of unphosphorylated 18F-FLT between the blood and brain tissue (i.e., an exchangeable tissue compartment) and then a phosphorylation step that leads to 18F-FLT retention (i.e., trapping). Irreversible trapping of phosphorylated 18F-FLT, which may lead to a “late” downward curvature of the time–activity curve, has been questioned by some investigators (15,24) and led to the introduction of an efflux rate constant to quantitatively account for this loss. Although the time–activity data in the present study did not exhibit such a loss of 18F-FLT activity over the 1-h imaging period, the activity did plateau, and an efflux rate constant (k4) was included in the model to optimize its fit to the data. Small and localized differences between the measured and fitted %ID/g values within the first 10 min after tracer injection were observed in several mice (Fig. 4C) and may be attributable to the increased contribution of noise to the measured time–activity curve during the early tracer equilibration phase, small variations in the blood plasma volume fraction among mice (treated as a fixed parameter in the model), or normal physiologic variations in tissue tracer perfusion, which dominates tracer kinetic behavior early after injection.
CONCLUSION
The present study demonstrates that dynamic 18F-FLT imaging can characterize tracer kinetics in a clinically relevant, GEM high-grade glioma model and yield estimates of kinetic parameters reflective of tumor cell proliferation. Our preliminary data established the feasibility of using a 3-compartment, 4-parameter model for elucidating critical aspects of tumor biology (such as metabolism or transport). Further studies will investigate whether dynamic measurements of 18F-FLT uptake can serve as surrogates of tumor cell proliferation responses after targeted treatment of GEM high-grade gliomas.
Acknowledgments
We thank Yiauchung Sheh for radiopharmaceutical support. Technical services provided by the MSKCC Small-Animal Imaging Core Facility, supported in part by NIH Small-Animal Imaging Research Program (SAIRP) grant R24 CA83084, NIH grant 096945, and NIH Center grant P30 CA08748, are also gratefully acknowledged. This work was supported in part by grants from the National Cancer Institute (CA096945 and CA099489) and the Kleberg Foundation.
Footnotes
-
COPYRIGHT © 2008 by the Society of Nuclear Medicine, Inc.
References
- Received for publication September 6, 2007.
- Accepted for publication November 20, 2007.


