


Abstract
The high rates of failure in the radiotherapy target volume suggest that patients with stage II or III non–small cell lung cancer (NSCLC) should receive an increased total dose of radiotherapy. Areas of high 18F-FDG uptake on preradiotherapy 18F-FDG PET/CT have been reported to identify intratumor subvolumes at high risk of relapse after radiotherapy. We wanted to confirm these observations on a cohort of patients included in 3 sequential prospective studies. Our aim was to assess an appropriate threshold (percentage of maximum standardized uptake value [SUVmax]) to delineate subvolumes on staging 18F-FDG PET/CT scans assuming that a smaller target volume would facilitate isotoxic radiotherapy dose escalation. Methods: Thirty-nine patients with inoperable stage II or III NSCLC, treated with chemoradiation or with radiotherapy alone, were extracted from 3 prospective studies (ClinicalTrials.gov identifiers NCT01261585, NCT01261598, and RECF0645). All patients underwent 18F-FDG PET/CT at initial staging, before radiotherapy, during radiotherapy, and during systematic follow-up in a single institution. All 18F-FDG PET/CT acquisitions were coregistered on the initial scan. Various subvolumes in the initial acquisition (30%, 40%, 50%, 60%, 70%, 80%, and 90% SUVmax thresholds) and in the 3 subsequent acquisitions (40% and 90% SUVmax thresholds) were pasted on the initial scan and compared. Results: Seventeen patients had a local relapse. The SUVmax measured during radiotherapy was significantly higher in locally relapsed tumors than in locally controlled tumors (mean, 6.8 vs. 4.6; P = 0.02). The subvolumes delineated on initial PET/CT scans with 70%–90% SUVmax thresholds were in good agreement with the recurrent volume at a 40% SUVmax threshold (common volume/baseline volume, 0.60–0.80). The subvolumes delineated on initial PET/CT scans with 30%–60% SUVmax thresholds were in good to excellent agreement with the core volume of the relapse (90% SUVmax threshold) (common volume/recurrent volume and overlap fraction indices, 0.60–0.93). The agreement was moderate (>0.51) when a 70% SUVmax threshold was used to delineate on initial PET/CT scans. Conclusion: High 18F-FDG uptake areas on pretreatment PET/CT scans identify tumor subvolumes at greater risk of relapse in patients with NSCLC treated by concomitant chemoradiation. We propose a 70% SUVmax threshold to delineate areas of high 18F-FDG uptake on initial PET/CT scans as the target volumes for potential radiotherapy dose escalation.
The survival probability of patients with stage II or III non–small cell lung cancer (NSCLC) remains low after curative-intent chemoradiotherapy (1,2). Many relapses occur within the radiotherapy target volume, thereby suggesting an insufficient total dose of radiotherapy (3–5). Therefore, reduction of the target volume is expected to allow isotoxic dose escalation (6). Such an approach would benefit from recent improvements in stereotactic body radiotherapy with imaging-guided radiotherapy and intensity-modulated radiotherapy to improve the precision of radiotherapy delivery (6,7). A possible way to achieve this goal would be to take advantage of intratumor heterogeneity by specific targeting of treatment-resistant tumor subvolumes. The tumor subvolumes with high 18F-FDG uptake (standardized uptake value [SUV] > 50% of the maximum SUV [SUVmax]) on preradiotherapy PET/CT have been reported to identify intratumor subvolumes that have a high risk of relapse after radiotherapy (8–11). The delivery of higher radiotherapy doses to these reduced target volumes was investigated in a randomized phase II study and seemed feasible (12). Our group has conducted 3 prospective studies (13–15) addressing the feasibility and role of 18F-FDG PET/CT during curative-intent chemoradiotherapy in 67 NSCLC patients. We selected 39 patients with a complete set of 18F-FDG PET/CT data who were analyzed in our institution (CHB, Rouen). Our aim was to investigate whether a higher (>50%) SUVmax threshold on initial 18F-FDG PET/CT scans would still define tumor subvolumes at high risk for relapse, assuming that a smaller volume would facilitate radiotherapy dose escalation.
MATERIALS AND METHODS
Patient Population
Data were extracted from 3 prospective studies (RTEP1, RTEP2, and RTEP4) registered on ClinicalTrials.gov (identifiers NCT01261585, NCT01261598, and RECF0645, respectively) and approved by the institutional review board for human studies (13–15). Sixty-seven patients with inoperable stage II or III NSCLC had been treated with chemoradiotherapy or with radiotherapy alone. The included patients were those who underwent 18F-FDG PET/CT at initial staging, before radiotherapy, during radiotherapy (42 Gy), and during systematic follow-up (3 mo and 1 y) in a single center (CHB, Rouen). Thirty-nine patients with complete clinical and imaging data available were selected for the present study. All patients gave written informed consent before inclusion.
18F-FDG PET/CT Imaging
The 18F-FDG PET/CT data were acquired on a Biograph Sensation 16 Hi-Rez device (Siemens Medical Solutions). The patients were required to fast for at least 6 h before imaging to ensure that the serum glucose and endogenous serum insulin levels were low at the time of 18F-FDG administration. A 5 MBq/kg dose of 18F-FDG was injected after 20 min of rest. Sixty minutes later (±10 min), the acquisition began with noninjected CT in the cephalocaudad direction. The images were acquired with the patients’ arms positioned over the head while they were breathing freely. The PET data were then acquired in the caudocephalad direction using a whole-body protocol (3 min per bed position). The acquisition time was adapted as a function of the injected activity (regarding the standard 5 MBq/kg) and the delay between the injection and acquisition (standardized to 60 min) to obtain a normalized counting rate for all patients. Six to 8 bed positions per patient were acquired, and the axial field of view for 1 bed position was 162 mm with a bed overlap of 25% (plane spacing, 2 mm). The PET images were reconstructed using Fourier rebinning and attenuation-weighted ordered-subset expectation maximization with clinical software. The images were corrected for random coincidences, scatter, and attenuation using the CT scan data. The 18F-FDG PET images were smoothed with a gaussian filter (full width at half maximum, 5 mm).
For each patient, the first 18F-FDG PET/CT scan (PETA) was obtained at initial staging, followed by a second 18F-FDG PET/CT scan before radiotherapy if induction chemotherapy was administered (PETB). A third 18F-FDG PET/CT scan (PETC) was obtained during the fifth week of radiotherapy, at an approximate dose of 40–45 Gy. A fourth 18F-FDG PET/CT scan was acquired during systematic follow-up (3 mo and 1 y) or if there was a suspected relapse (PETR).
18F-FDG PET/CT Analysis
The 156 PET/CT scans acquired for the 39 selected patients were analyzed in consensus by two senior physicians (a nuclear medicine specialist and a radiation oncology specialist) in a single center (Henri Becquerel Center, Rouen) on a Planet Onco workstation (Planet Onco, version 2.0; DOSISoft).
The SUVmax and metabolic tumor volume data were collected. The metabolic tumor volume was defined with a threshold at 40% of tumor SUVmax since this value is widely used to delineate volumes with significant 18F-FDG uptake (16,17). For each patient, all PET/CT acquisitions were coregistered on the initial CT scan, focusing on the tumor, with a rigid registration method (block-matching rigid registration method (18)). The physicians were allowed to manually adjust the registration to avoid obvious misregistration (pleural effusion, pulmonary retraction, radiation-induced pneumonitis, tumor volume decrease, respiration motion, or change in patient position). The PETA scan was systematically used as a reference. In total, 117 coregistrations were performed.
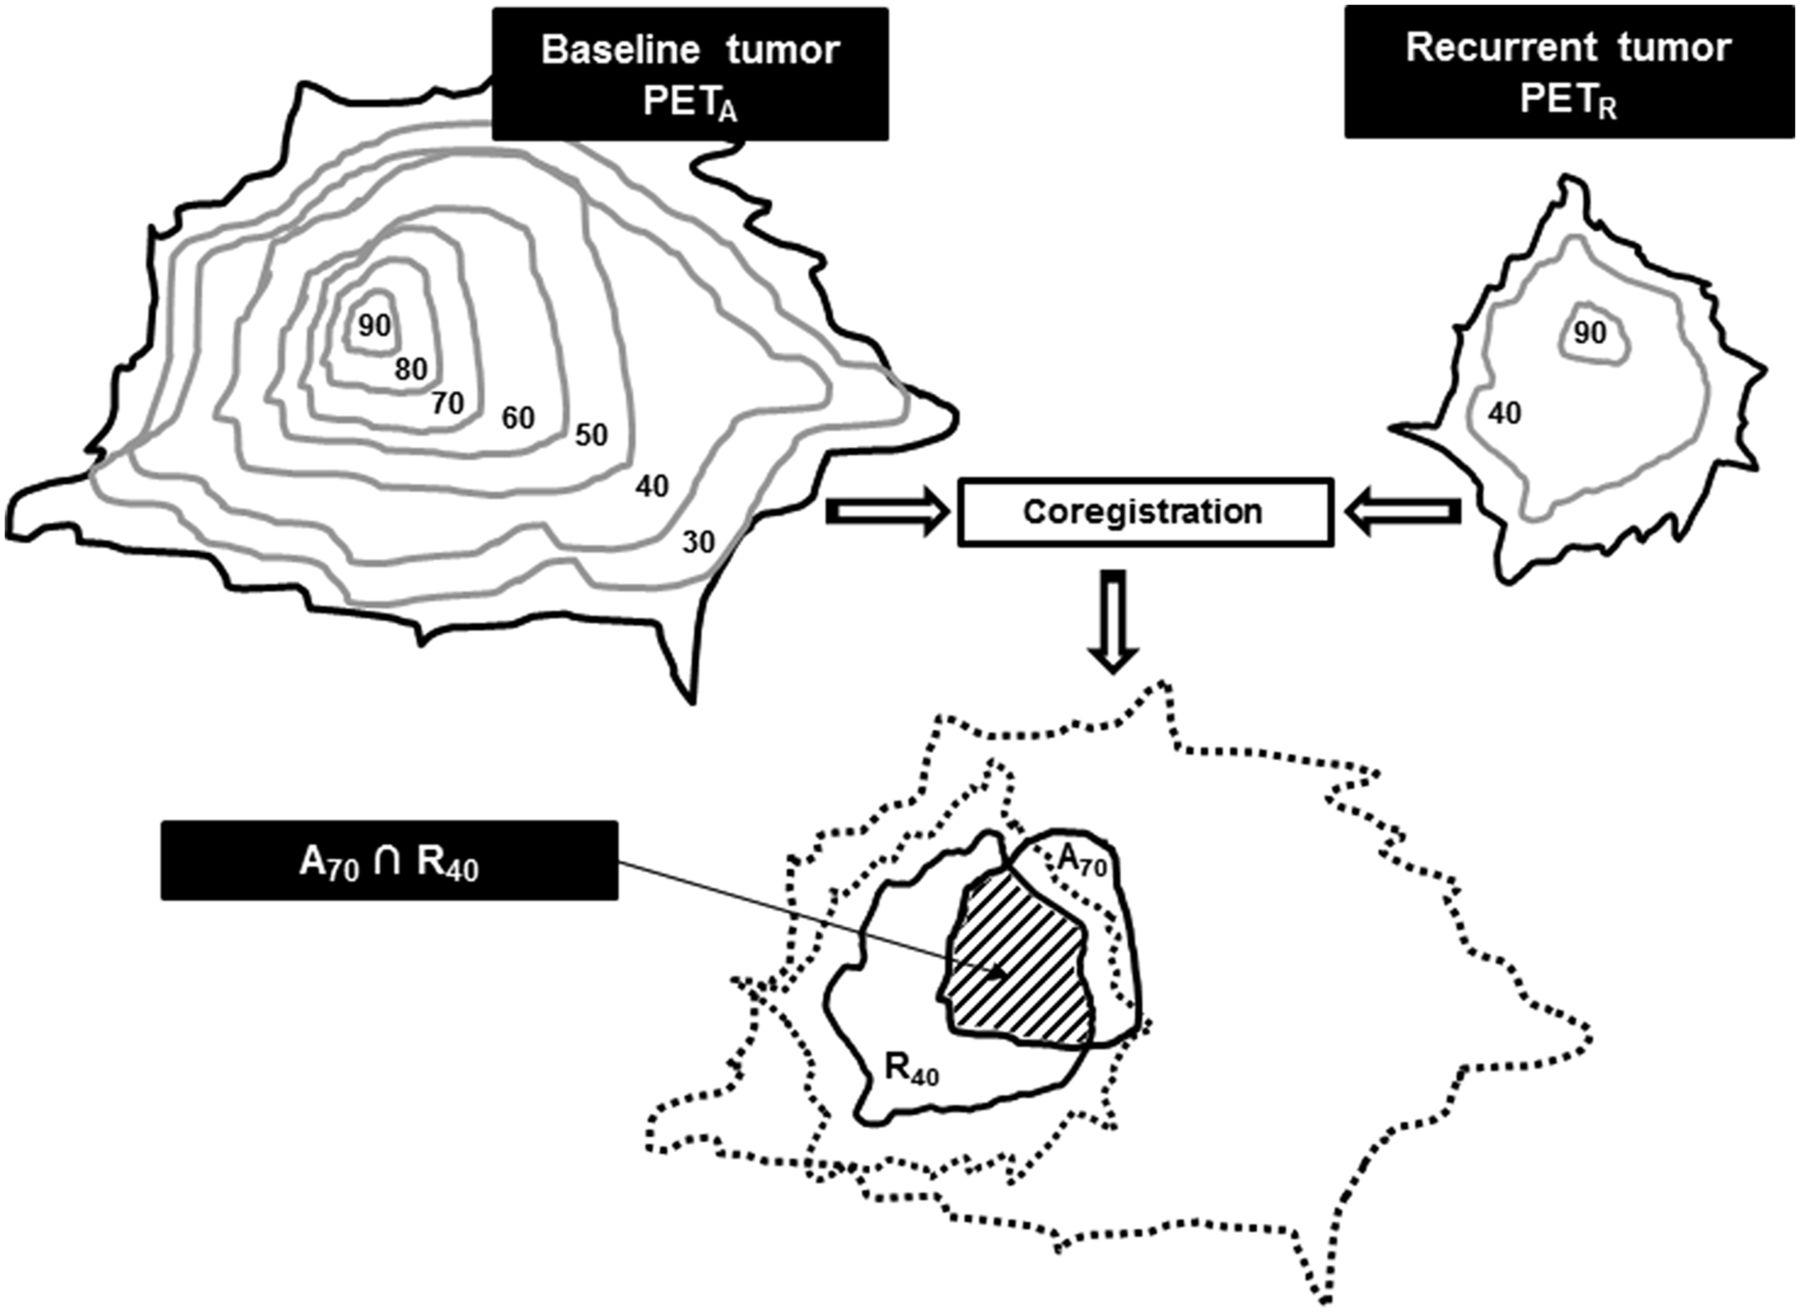
We defined 507 volumes of interest: 7 on PETA and 2 each on PETB, PETC, and PETR. On PETA, the baseline subvolumes were delineated using a relative threshold method (30%, 40%, 50%, 60%, 70%, 80%, and 90% of primary tumor SUVmax, with the corresponding volumes being referred to as A30, A40, A50, A60, A70, A80, and A90, respectively). On PETB, 40% and 90% of SUVmax were used as thresholds to delineate the B40 and B90 subvolumes, respectively. The same process was applied to PETC (C40 and C90) and PETR (R40 and R90). Each subvolume of PETA was then reported on PETB, PETC, and PETR, and each subvolume of PETB, PETC, and PETR was reported on PETA, to quantify their respective overlaps as shown in Figure 1.

Estimation of typical overlapping of A70 and R40 subvolumes after coregistration and reports. Numbers indicate SUVmax thresholds as percentages.
Overlap Quantification
Our objective was to find the highest threshold (as a percentage of SUVmax) delineating the smallest subvolume on baseline PET yielding the highest overlap index compared with the relapse volume (PETR) and compared with the metabolically active residual-disease volumes during the therapeutic sequence (PETB and PETC).We investigated all potential overlaps between the above-defined volumes of interest: baseline tumor (A30–A90) versus postinduction chemotherapy tumor subvolumes (B40 and B90), per-radiotherapy subvolumes (C40 and C90), and relapse subvolumes (R40 and R90). The following 5 indices were used: the Dice index ( ), the Jaccard index (
 ), the overlap fraction (
 ), the common volume divided by the initial volume (
 ), and the common volume divided by the compared volume (
 ).
).
The Dice, Jaccard, and overlap fraction indices are widely used to compare delineated volumes obtained with different methods or by multiple investigators (19). Their values vary between 0 (if the volumes are completely disjointed) and 1 (if the volumes match perfectly in size, shape, and location). They can be misleading when the sizes of the delineated volumes differ. The Ax∩R40/Ax was used to estimate the larger subvolume with high chances of containing the recurrent tumor volume (R40), aiming to limit the irradiation of areas with a low risk of recurrence.
The Ax∩R90/R90 index was used to estimate the smaller subvolume on PETA containing the highest uptake area in the recurrent tumor (R90), to avoid omitting areas at high risk of recurrence from the target volume.
A schematic example of the interpretation of overlap indices is shown in Figure 2.
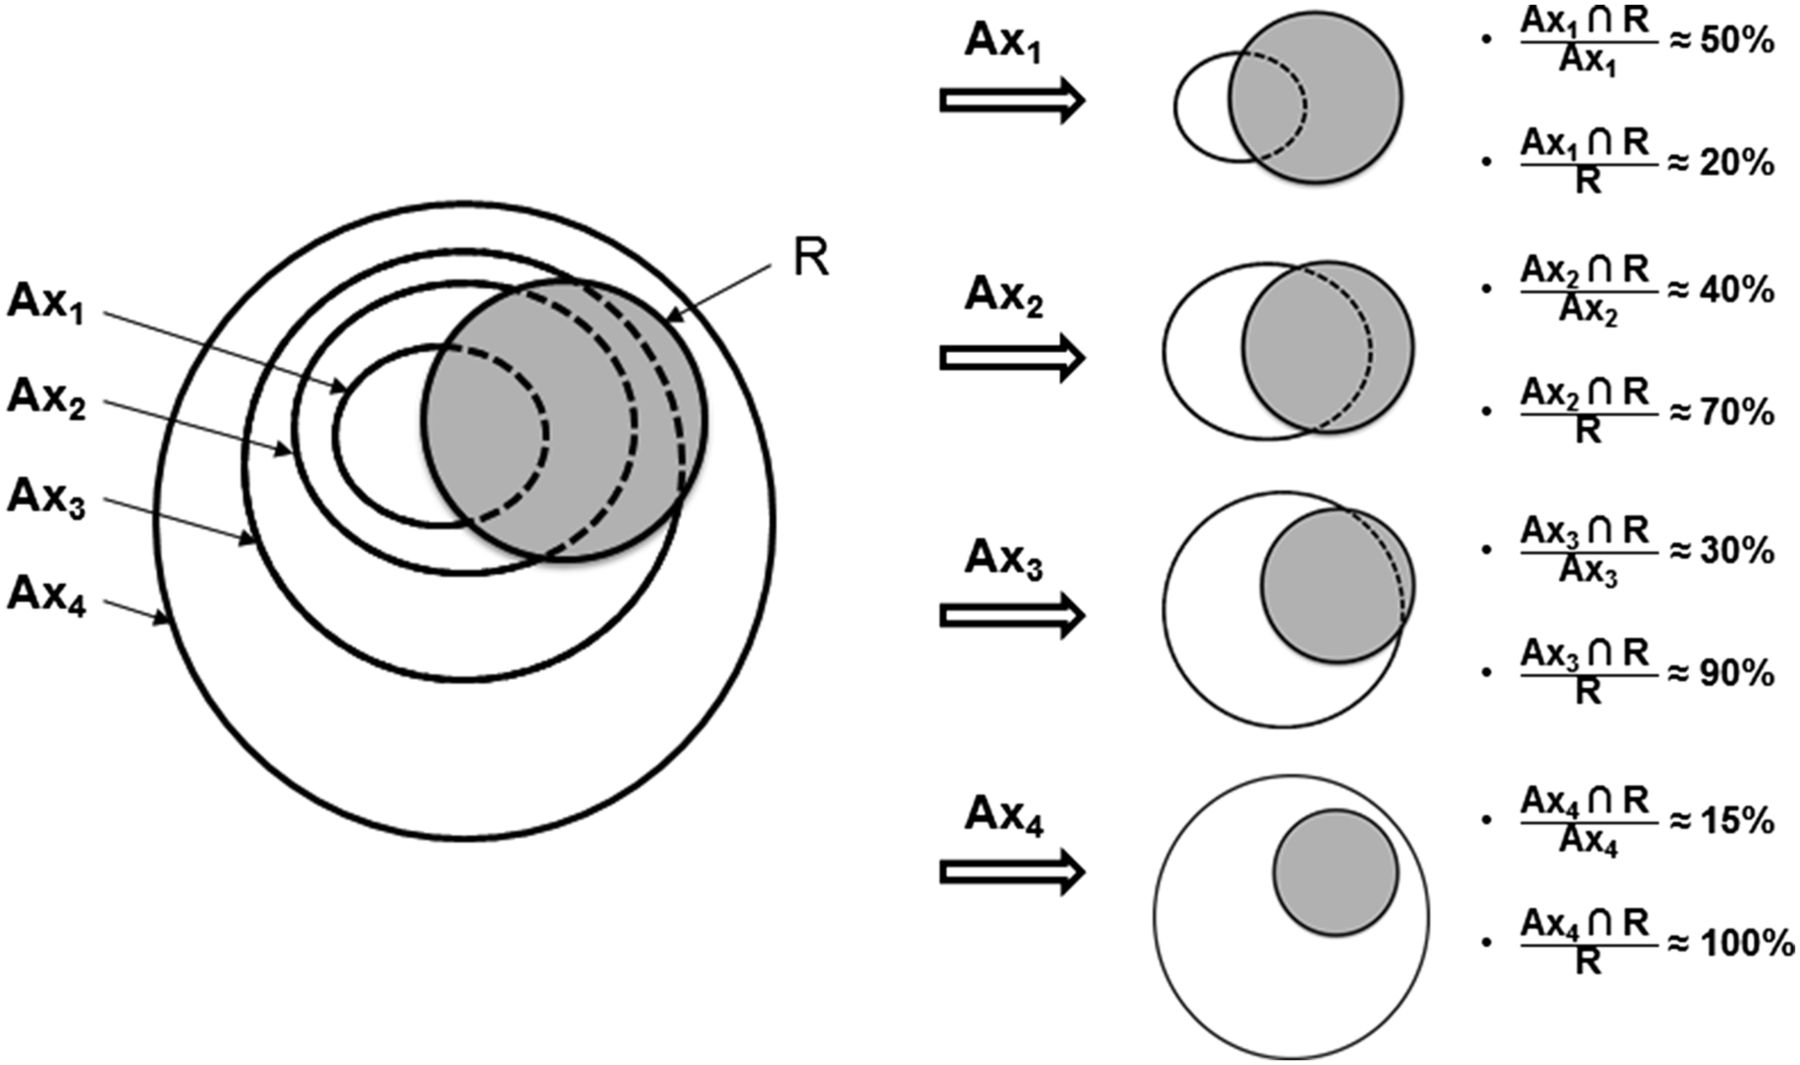
Study flow for scenario of PETA and PETR subvolume comparisons. Shown are indices of common volume (A R), with A referring to staging 18F-FDG PET/CT and R to 18F-FDG PET/CT at recurrence.
Statistics
To classify the quality of overlap, we chose the criteria used for the Cohen κ test when assessing the agreement between investigators: 0–0.2, poor agreement; 0.21–0.40, fair agreement; 0.41–0.60, moderate agreement; 0.61–0.80, good agreement; and 0.81–1.00, very good agreement (15).
The mean and SD were used for descriptive statistics. The association between 18F-FDG PET/CT and clinical parameters was tested using repeated-measures ANOVA and the χ2 test. A P value of less than 0.05 was considered statistically significant (bilateral test). All analyses were performed using MedCalc Statistical Software, version 12.7.2 (MedCalc Software bvba).
RESULTS
Patient Characteristics
Of the 67 patients included in the RTEP studies, 39 (RTEP1, 9/10; RTEP2, 23/52; RTEP4, 4/5) were eligible for the present study (Table 1). The noneligible patients were those for whom the full set of sequential 18F-FDG PET/CT scans was not available (patients who were treated in another center or scans with technical problems).
Patient Demographics and Characteristics
The mean follow-up of the total studied population was 30 ± 19 mo. Eleven patients remained in complete metabolic response (CR). Seventeen patients had a local relapse (LR) with or without nodal or metastatic disease. We considered metabolically persistent residual disease and local recurrence to be equal. Eleven patients had a distant dissemination (nodal or metastatic) without local residual disease (DR). Ipsilateral (outside the initial radiotherapy target volume) or contralateral lung recurrence was considered metastasis. Metastasis occurred in 16 patients.
A manual adjustment of the coregistered images was required in 10 patients. No significant differences were observed when the overlap indices were compared with those obtained in 7 patients without manual adjustment. All patients were pooled for further analyses. The volume measurements in LR patients are summarized in Table 2. The mean initial tumor metabolic volume (A40) was 54 cm3 (range, 2.4–176 cm3; SD, 46 cm3), and the mean A70 subvolume was 12 cm3 (range, 0.6–51 cm3; SD, 12 cm3).
Subvolumes Delineated with Various SUVmax Thresholds
Univariate Analysis
When LR (n = 17), DR (n = 11), and CR (n = 11) patients were compared, there were no significant differences in age; sex; TNM stage; tumor location; induction chemotherapy; radiotherapy dose and duration; tumor metabolic volume at PETA, at PETB, and PETC (threshold = 40% SUVmax); or SUVmax at PETA and PETB. None of these parameters was significantly different in the 16 metastatic patients.
The frequency of LR was higher for squamous cell carcinoma (14/21, 66%) than for adenocarcinoma (1/10, 10%) or undifferentiated carcinoma (2/8, 25%) (P = 0.03).
The SUVmax measured on PETC was significantly higher in relapsing tumors than in locally controlled tumors (mean, 6.8 vs. 4.6; P = 0.02). The area under the receiver-operating-characteristic curve was 0.78 (95% confidence interval, 0.62–0.90) (Fig. 3). An SUVmax of more than 5.6 (i.e., the mean of SUVmax observed in the locally relapsed and controlled groups) yielded a sensitivity of 82% (95% confidence interval, 57%–96%) and a specificity of 76% (95% confidence interval, 53%–92%) to predict LR.
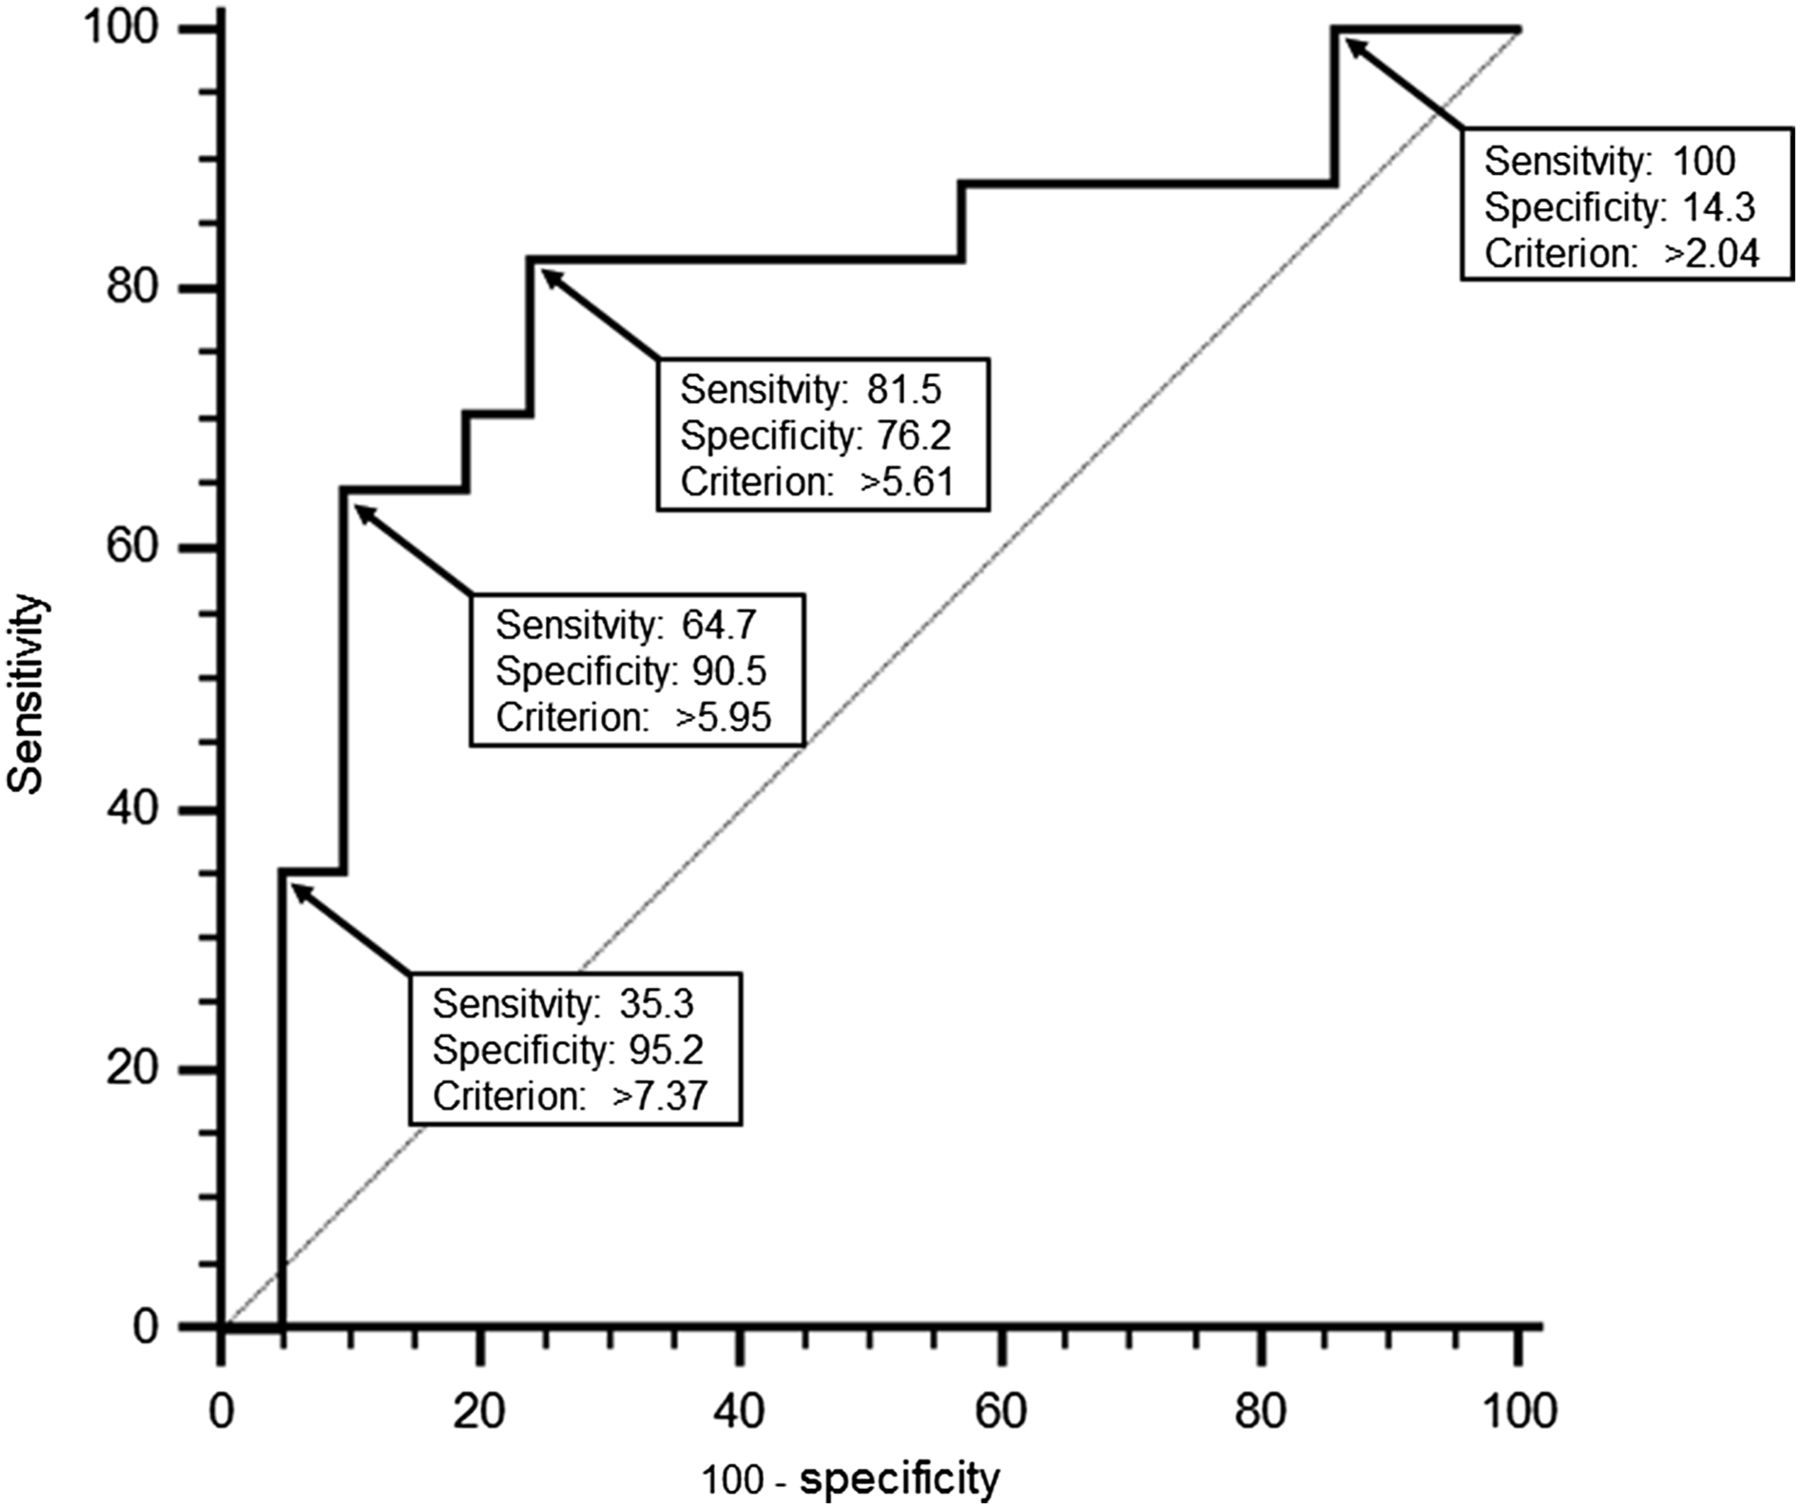
Receiver-operating-characteristic curve analysis of SUVmax as predictor of LR.
Overlap Comparisons
We obtained 6,650 indices corresponding to 1,330 potential overlaps of 507 volumes of interest on the 156 PET/CT scans. Overlap comparisons of PETA subvolumes with PETB and PETC subvolumes were performed for all 39 included patients. Overlap comparisons between PETA and PETR subvolumes were performed only for the 17 LR patients. An example is shown in Figure 4. The mean overlap indices are reported in Figure 5 (Details are provided in Supplemental Fig. 1; supplemental materials are available at http://jnm.snmjournals.org).
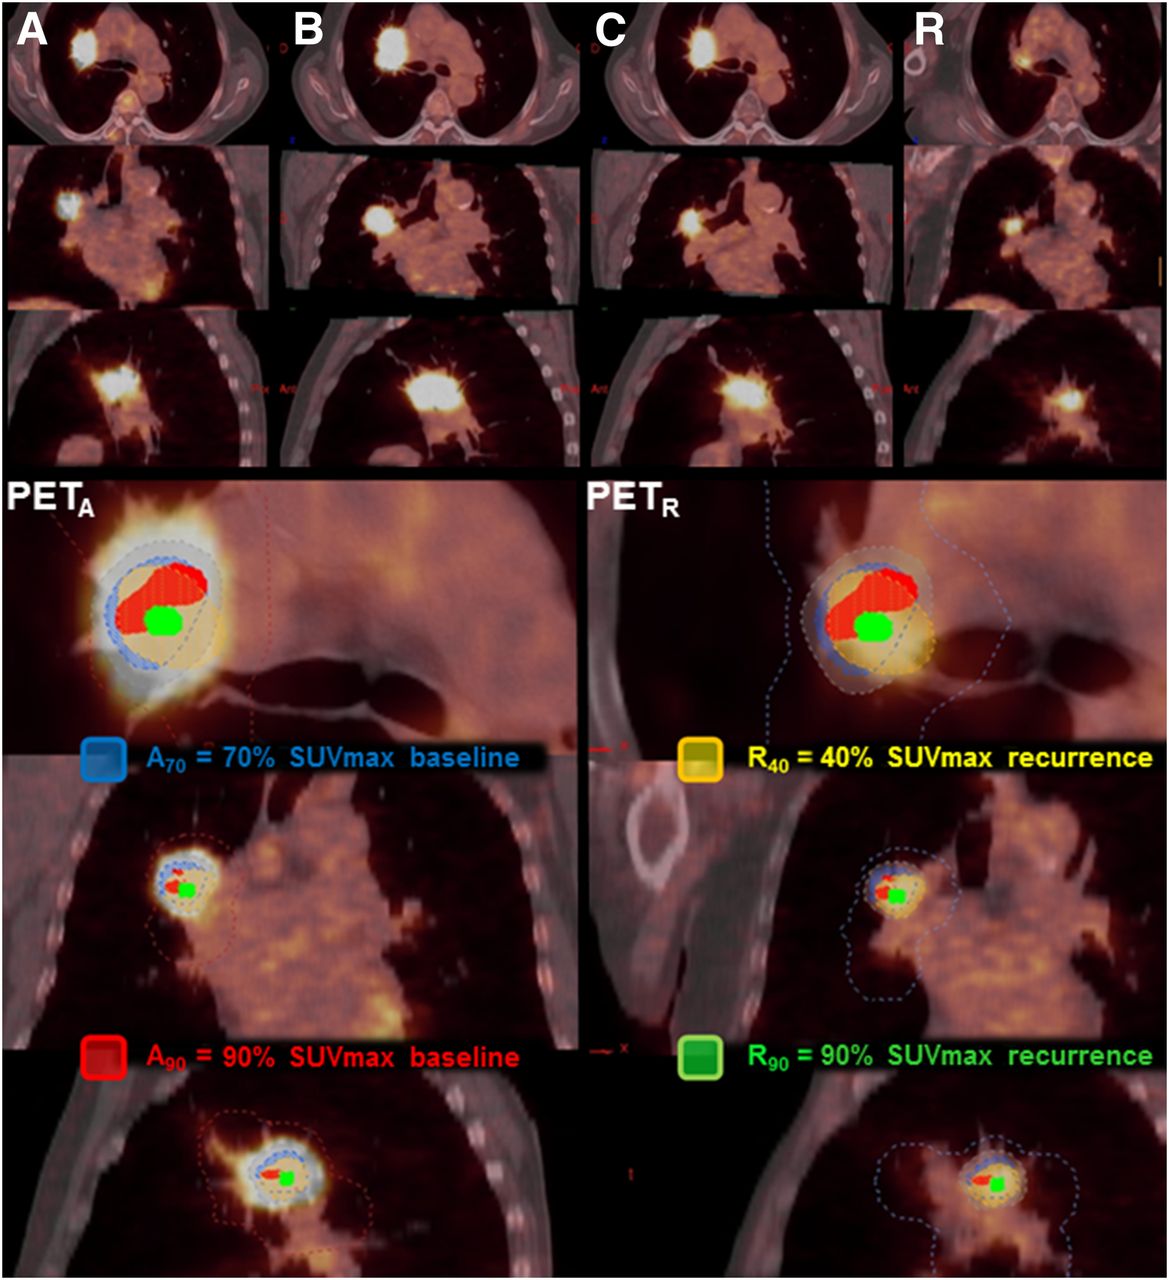
Example of 74-y-old man with right superior lobe squamous cell carcinoma T3N0M0. Shown are staging PETA (A), PETB (B), PETC (C), and PETR (R). Numeric indices refer to threshold for delineation. A70 and A90 subvolumes were reported on PETR, and R40 and R90 subvolumes on PETA. A70∩R90/R90 index was calculated at 0.69, meaning that two thirds of R40 was included in A70. A70∩R90/R90 index was calculated at 1.00, meaning that R90 was totally included in A70.
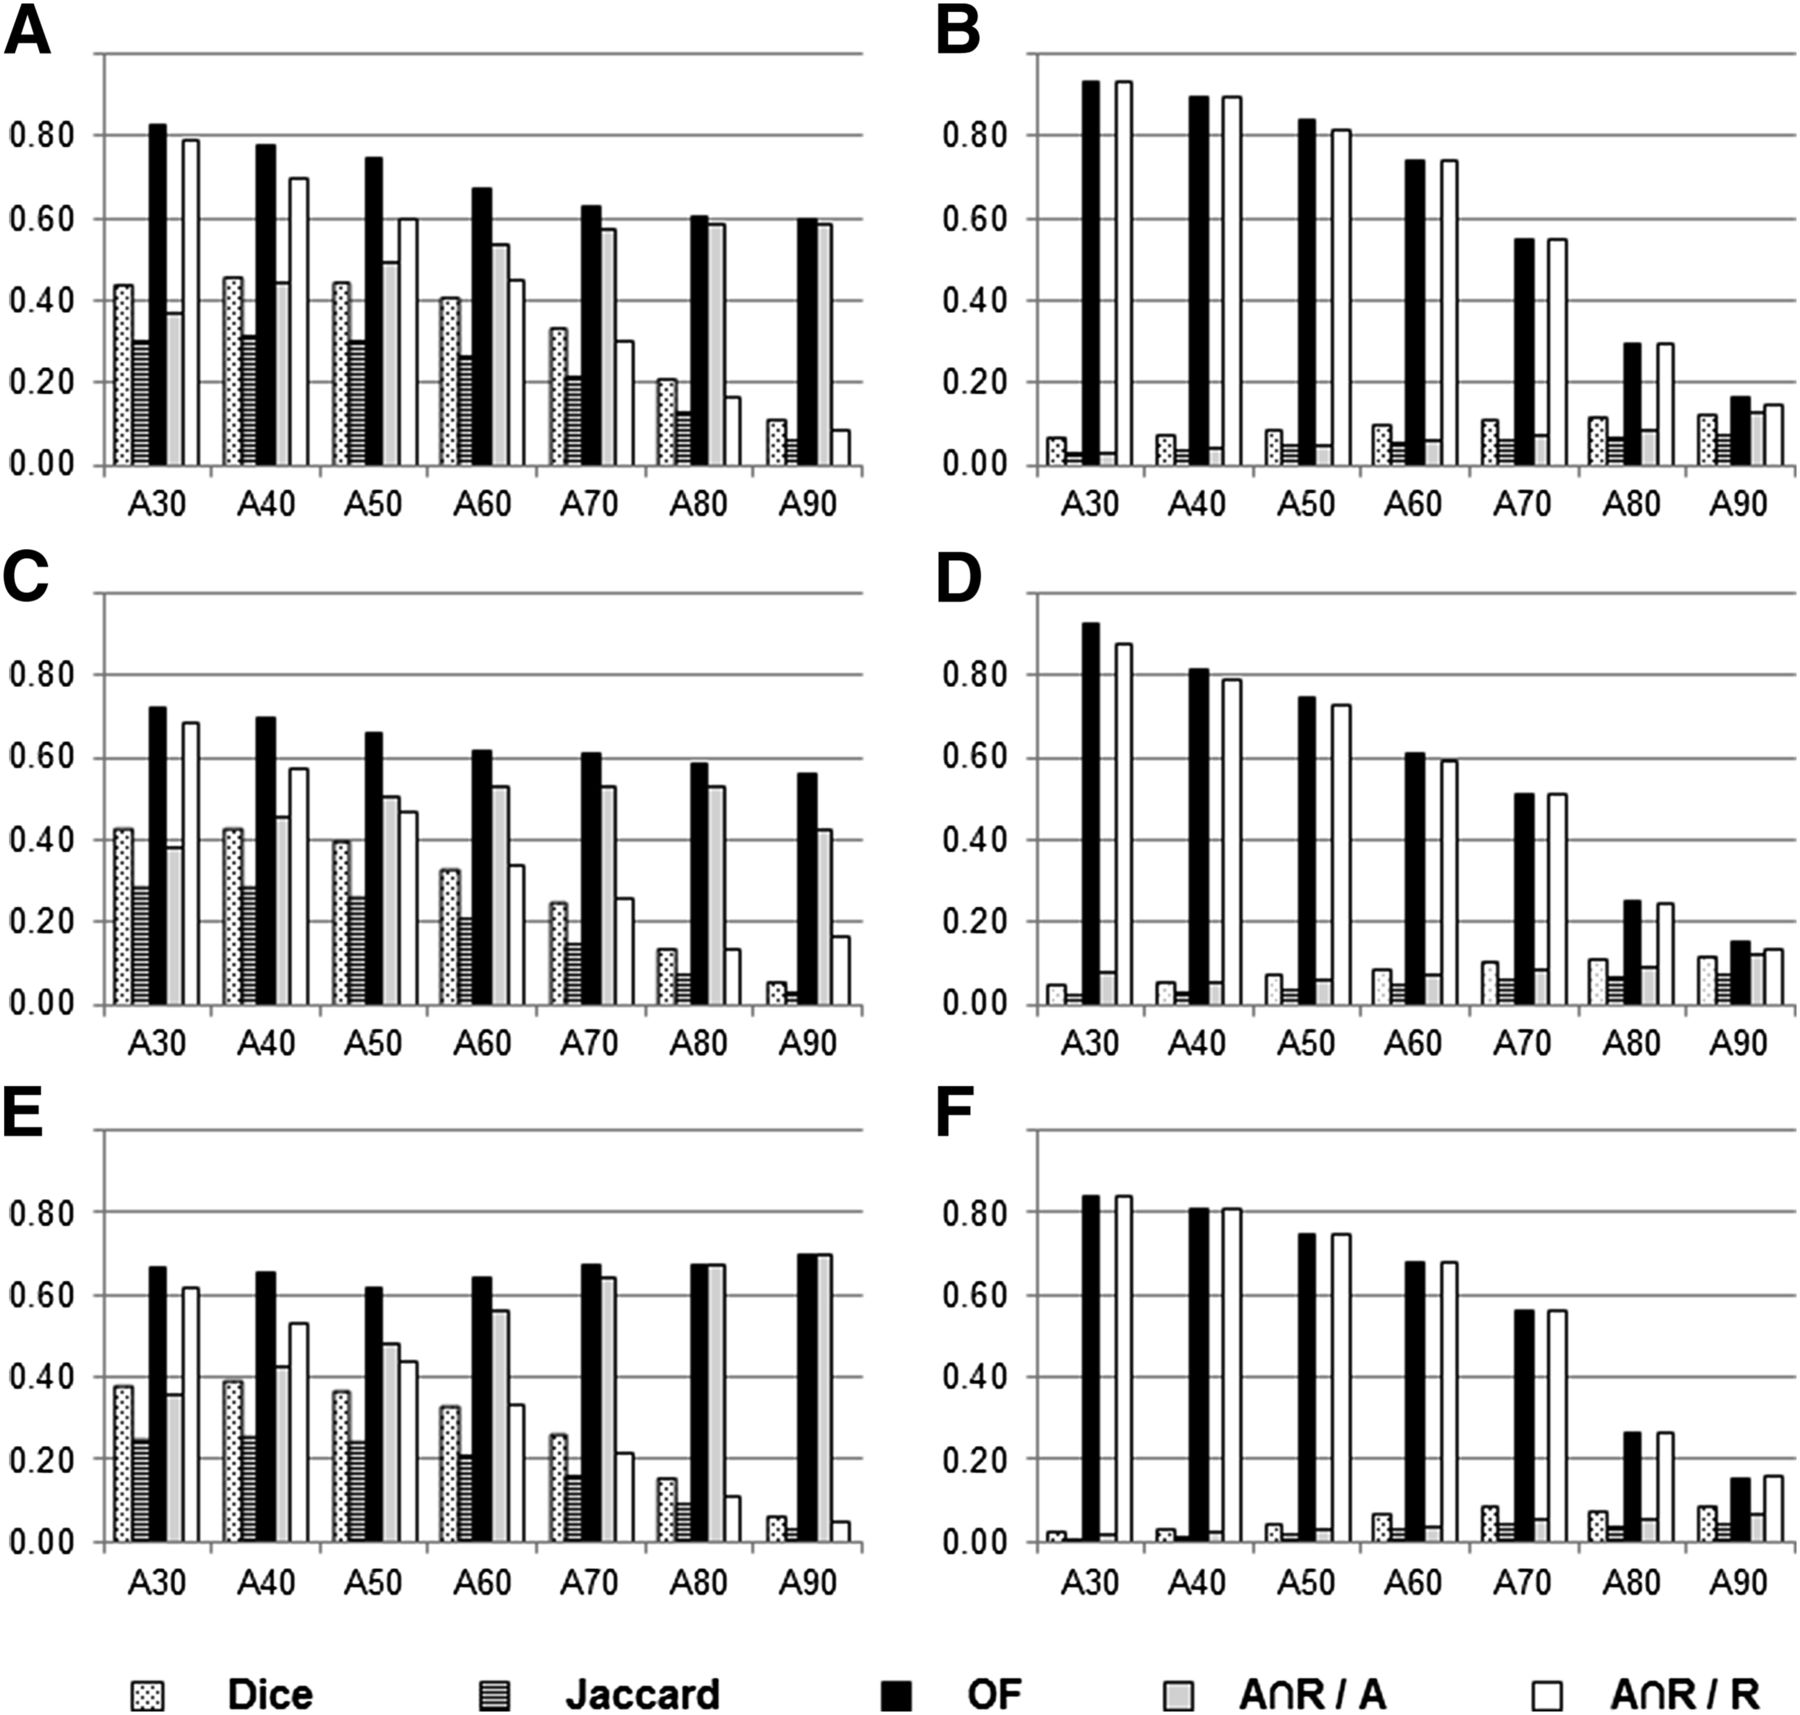
Histogram of mean values of overlap indices for various SUVmax thresholds (numeric indices refer to threshold for delineation) to delineate subvolumes on PETA (AX), PETB (after induction chemotherapy, B40 and B90, panels A and B), PETC (C40 and C90, panels C and D), and PETR (R40 and R90, panels E and F). Detailed data are presented in Supplemental Figure 1. OF = overlap fraction.
Ax Versus B40, C40, and R40 Comparisons
We first tried to identify an SUVmax threshold on PETA scans that would consistently delineate a volume that included the areas with significant 18F-FDG uptake (40% SUVmax) on subsequent PET scans (panels A, C, and E in Fig. 5).
The overlap fractions between the PETA scans and the PETB, PETC, and PETR scans showed good agreement (between 0.60 and 0.80) for all initial SUVmax thresholds (except A80∩C40 and A90∩C40, which were slightly below 0.60). The Ax∩R40/Ax indices between PETA scans and PETR scans at the time of recurrence showed good agreement (values between 0.60 and 0.80) for Ax SUVmax thresholds between 70% and 90%. The Ax∩R40/R40 index was good only for the 30% SUVmax threshold. The Dice and Jaccard indices showed poor to moderate agreement. The low variations between panels A, C, and E indicate that the position of the subvolumes was similar during the therapeutic sequence.
Ax Versus B90, C90, and R90 Comparisons
We then investigated whether the areas with high 18F-FDG uptake (with a 90% SUVmax threshold) on subsequent PET scans could be identified on the PETA scans (panels B, D, and F in Fig. 5).
Good to excellent overlap fractions (0.60–0.93) were obtained for the volumes delineated on PETA with SUVmax thresholds between 30% and 60%. Similarly, high values for the Ax∩R90/R90 index were obtained with the same thresholds on PETA. The 70% baseline SUVmax threshold showed moderate agreement (overlap fractions and Ax∩R90/R90 > 0.51) when compared with PETB, PETC, and PETR. The Dice, Jaccard, and Ax∩R90/Ax indices were very low (mostly <0.10) irrespective of the thresholds used on PETA. The low variations between panels B, D, and F indicate that the position of the subvolumes was similar during the therapeutic sequence.
DISCUSSION
NSCLC is known to have high and heterogeneous 18F-FDG uptake. A selective increase in radiotherapy dose to the most radioresistant areas within the tumor is tempting, as a way to improve local control rates without excessive toxicity. Along with others (8–11), we have shown in 39 patients (17 relapses) included in 3 prospective trials that intratumor subvolumes with high 18F-FDG uptake (SUV > 70% SUVmax) can easily be delineated on staging PET scans to indicate areas at increased risk of relapse. This is of interest because the RTOG 0617 randomized trial (20) reported no benefit from an increased radiotherapy dose targeted on initial tumor volume on PET scans (SUV > 40% SUVmax). An alternative approach could be to delineate smaller target volumes, based on 18F-FDG uptake (e.g., >70% SUVmax), that could receive total doses much higher than the conventional range (60–74 Gy). Very high precision in radiotherapy delivery is therefore required to avoid excessive irradiation of the normal tissues surrounding the target volume (6,7,21). In addition, doses larger than 2 Gy per fraction can be delivered to shorten the overall radiotherapy duration, counterbalancing tumor cell proliferation and increasing the probability of cure. A prospective feasibility study of stereotaxic body radiotherapy after conventional therapy, increasing the total dose to residual disease above 100 Gy, showed no increase in acute toxicity compared with what was expected after conventional chemoradiotherapy (21).
Table 3 is a comparison with previous works. Abramyuk et al. (8) reported that the relapse volume defined with an automatic delineation method (ROVER; ABX Advanced Biochemical Compounds) was visually included in the initial volume defined with a 35% SUVmax threshold. Aerts et al. (9,10) compared retrospectively and prospectively the overlap fractions of initial subvolumes defined with 34%, 40%, 50%, 60%, 70%, and 80% SUVmax with relapse volumes defined with a fixed SUV threshold higher than 2.5% and 5%, aorta SUV, and relative threshold at 70%, 80%, and 90% SUVmax. Aerts proposed the 50% SUVmax threshold on initial PET scans as more suitable for the radiation-boosting target. More recently, Shusharina et al. (11), using a nonrigid coregistration method, prospectively compared the overlap fractions of an initial subvolume defined with the 50% SUVmax and a relapse subvolume defined with the 80% SUVmax threshold and confirmed Aerts’ results.
Literature Review
After Aerts’ first study (22) comparing overlap fractions of subvolumes defined with 34%, 40%, 50%, 60%, 70%, and 80% SUVmax at baseline (PETA), at the seventh day of radiotherapy (PETB), and at the 14th day of radiotherapy (PETC), our results confirmed that the topography of the high 18F-FDG uptake subvolumes within the tumor remains stable during the course of radiotherapy, despite large variations in absolute volumes. On the basis of these results, we conclude that residual metabolically active and relapse areas within the tumor can be identified using initial 18F-FDG PET/CT scans.
Our present work, by relying on 5 different overlap indices, constitutes an extensive investigation. The disappointing values of the Dice and Jaccard indices can be attributed to very different absolute volumes (a ratio of more than 10 between A70 and R90): two volumes with a good superimposition but a large difference in size will yield low Dice and Jaccard indices. Given the low resolution of 18F-FDG PET/CT images and the uncertainties in registration, A90 and R90 (same range of absolute volumes) were not likely to perfectly match.
We have investigated the ability of the Ax∩R40/Ax and Ax∩R90/R90 indices to better estimate the overlapping of potential target volumes for radiotherapy dose escalation with relapse volumes. We found that the baseline PET subvolume defined with the 70% SUVmax threshold is an acceptable choice for dose escalation to avoid missing the hot spot of recurrence (as shown by the Ax∩R90/R90 index) and limit the irradiation of areas at a low risk of relapse (as shown by the Ax∩R40/Ax index).
In our hands, these potential target volumes are 2–3 times smaller than those delineated by Aerts and Shusharina (mean, 12 cm3; range, 0.6–51 cm3; SD, 12 cm3) and would allow higher dose escalation with stereotactic body radiotherapy. In agreement with others (14,23), the SUVmax at baseline or on planning 18F-FDG PET was not significantly different in CR, DR, and LR patients.
In accordance with Aerts and our previous study (9,14), we have confirmed the association between persistent 18F-FDG uptake during radiotherapy and poor outcome. The SUVmax on PETC was significantly higher in locally relapsing patients than in patients with distant metastases or remission. We found that patients with an SUVmax of more than 5.6 or 5.9 during the fifth week of radiotherapy were at high risk of LR. As an attempt to reverse this poor prognosis, one could consider replanning stereotactic body radiotherapy with a higher total dose on PET/CT performed during the fifth week of radiotherapy, since most uptake and functional volume reduction has already occurred (13) and sufficient time is left to adapt the radiotherapy plan.
The present approach relies on careful coregistration of the sequential 18F-FDG PET/CT images (117 coregistrations performed). We restricted our study to patients who were seen in a single institution, with images acquired under similar conditions and analyzed by two experienced physicians. Most of the difficulties occurred with follow-up 18F-FDG PET/CT because of posttreatment alterations in morphology. Manual adjustment was allowed in cases of obvious misregistration until a consensus was obtained. The differences in overlap indices did not reach statistical significance between LR patients for whom coregistration did not need manual adjustment (n = 7) and LR patients who required manual adjustment (n = 10). This difference could be improved by using deformable registration techniques. However, these are difficult to validate and the reproducibility is limited. Respiratory gating was not required in our prospective trials. Strictly speaking, respiratory gating could have improved the precision of our results. Despite potential blurring due to respiratory movement, the clarity of our present results is nevertheless reassuring.
Our results apply to only the primary tumor site. Lymph node 18F-FDG uptake was not investigated since local recurrence is usually at the site of the primary tumor. In addition, it would be difficult to increase the radiotherapy dose in 2 or more intrathoracic target volumes.
The subvolumes delineated on PETA were followed on PETB, PETC, and PETR subvolumes. We did not extensively investigate whether a similar approach could be applied to PETB or PETC. Our goal was to investigate the ability of a routine practice widely available—staging PET—to identify the intratumor site at high risk of relapse, whereas postchemotherapy preradiotherapy PET and per-radiotherapy PET are not accepted as part of clinical routine. As PET is increasingly used for radiotherapy planning, a recent prospective study showed that it is associated with higher overall survival rates in NSCLC patients (24); the ability of 18F-FDG PET/CT performed after induction chemotherapy or during radiotherapy to identify the intratumor site at high of relapse has to be determined in future studies.
The small number of included patients is another limitation of our study. Our priority was to include carefully selected patients with complete clinical and imaging data available. Further confirmation requires prospective trials. Multivariate analysis was not performed since the population size was too small (lack of statistical power).
We did not use a specific tracer—such as 18F-fluoromisonidazole—of hypoxia, a well-known factor of radioresistance. However, it has been reported that tumor hypoxia and 18F-FDG uptake are related through the upregulation of glucose transporter 1 by hypoxia-inducible factor 1 (25,26). 18F-FDG and 18F-fluoromisonidazole certainly give different but complementary information, and they can display similar intratumor distribution patterns (27). Although 18F-FDG is not a specific hypoxia tracer, it is widely used and widely available, and its accumulation reflects overall metabolic activity and tumor load. Accordingly, targeting tumor subvolumes with an increased metabolic burden might be beneficial in tumor eradication (28).
CONCLUSION
Areas of high 18F-FDG uptake on pretreatment PET/CT scans identify tumor subvolumes at greater risk of relapse in patients with NSCLC treated by concomitant chemoradiation. This result was obtained in 39 patients (17 relapses) included in a series of 3 prospective trials in a single institution. We provide further justification for clinical investigation of radiotherapy dose escalation in small target subvolumes delineated on initial 18F-FDG PET/CT scans with a 70% SUVmax threshold.
DISCLOSURE
The costs of publication of this article were defrayed in part by the payment of page charges. Therefore, and solely to indicate this fact, this article is hereby marked “advertisement” in accordance with 18 USC section 1734. This study was supported by a grant from the Ligue Contre le Cancer de Haute Normandie and the North Ouest Canceropole (Institut National du Cancer; INCa). No other potential conflict of interest relevant to this article was reported.
Acknowledgments
We thank Sebastien Vauclin (DOSISoft) for his excellent collaboration.
Footnotes
Published online Jan. 8, 2015.
- © 2015 by the Society of Nuclear Medicine and Molecular Imaging, Inc.
REFERENCES
- Received for publication June 10, 2014.
- Accepted for publication December 8, 2014.


