


Abstract
Integrated PET/MR systems are becoming increasingly popular in clinical and research applications. Quantitative PET reconstruction requires correction for γ-photon attenuations using an attenuation coefficient map (μ map) that is a measure of the electron density. One challenge of PET/MR, in contrast to PET/CT, lies in the accurate computation of μ maps. Unlike CT, MR imaging measures physical properties not directly related to electron density. Previous approaches have computed the attenuation coefficients using a segmentation of MR images or using deformable registration of atlas CT images to the space of the subject MR images. Methods: In this work, we propose a patch-based method to generate whole-head μ maps from ultrashort echo-time (UTE) MR imaging sequences. UTE images are preferred to other MR sequences because of the increased signal from bone. To generate a synthetic CT image, we use patches from a reference dataset, which consists of dual-echo UTE images and a coregistered CT scan from the same subject. Matching of patches between the reference and target images allows corresponding patches from the reference CT scan to be combined via a Bayesian framework. No registration or segmentation is required. Results: For evaluation, UTE, CT, and PET data acquired from 5 patients under an institutional review board–approved protocol were used. Another patient (with UTE and CT data only) was selected to be the reference to generate synthetic CT images for these 5 patients. PET reconstructions were attenuation-corrected using the original CT, our synthetic CT, Siemens Dixon-based μ maps, Siemens UTE-based μ maps, and deformable registration-based CT. Our synthetic CT–based PET reconstruction showed higher correlation (average ρ = 0.996, R2 = 0.991) to the original CT-based PET, as compared with the segmentation- and registration-based methods. Synthetic CT–based reconstruction had minimal bias (regression slope, 0.990), as compared with the segmentation-based methods (regression slope, 0.905). A peak signal-to-noise ratio of 35.98 dB in the reconstructed PET activity was observed, compared with 29.767, 29.34, and 27.43 dB for the Siemens Dixon-, UTE-, and registration-based μ maps. Conclusion: A patch-matching approach to synthesize CT images from dual-echo UTE images leads to significantly improved accuracy of PET reconstruction as compared with actual CT scans. The PET reconstruction is improved over segmentation- (Dixon and Siemens UTE) and registration-based methods, even in subjects with pathologic findings.
Hybrid medical imaging systems, such as PET/CT and PET/MR, are routinely used as diagnostic tools for brain imaging in clinical and research environments. In PET/CT systems, x-ray attenuation coefficients from CT images are used for attenuation correction of PET images. Recently, PET/MR systems have been introduced (1) in diagnostic applications. A significant challenge for PET/MR systems is that the intensity of a brain MR image is based on magnetic properties (e.g., proton density, the longitudinal and transverse relaxation times) that, unlike in CT, have no straightforward relation to electron density, which determines γ-photon attenuation.
Different segmentation-based and atlas-based methods have been reported to synthesize attenuation coefficient maps (μ maps) from MR images. Segmentation-based methods rely on 3- or 4-class segmentations (2–4) of the MR image (e.g., soft tissue, fat, air, and bone) either using a Dixon-based approach (5) or using intensity-based segmentation of the MR image. Then, typical CT intensities are assigned to the corresponding tissue labels to create a CT-like image. However, Dixon-based and intensity-based approaches often ignore bone or perform poorly with respect to reconstructing bone. This is because standard clinical MR scans do not show any signal for bone. Because bone has the highest attenuation of these tissue classes, it is an important structure to accurately represent for attenuation correction purposes (6). Ultrashort echo-time (UTE) imaging (7) is a relatively new MR imaging technique that enables imaging of structures with short T2 relaxation times such as bone. Combined with an image with a longer echo time, when bone produces extremely low signal, a better bone segmentation can be obtained from dual-echo UTE (8).
Most atlas-based methods (9–13) rely on learning a regression from MR intensities to CT Hounsfield units (HU). Instead of just using voxel intensities, patches or subimages are preferred to estimate CT numbers, because a patch encodes neighborhood information around a voxel (14). We define one atlas as consisting of one MR image and its corresponding CT image. Multiple atlas MR images are first deformably registered to a subject’s MR image. For a patch in the subject MR image, multiple relevant patches from the atlas MR images are found. Then, corresponding CT patches are combined to estimate the CT numbers for the subject patch. Atlas-based methods usually require that the atlas MR image be well aligned to the subject. The deformable registration algorithms (15) that are used for this purpose can be computationally expensive, and the final quality of the PET reconstruction invariably depends on the accuracy of the registration. This can be problematic when the geometry of the anatomy between the atlas and the subject substantially differs or the subject images exhibit pathologic findings.
In this paper, we propose an algorithm called GENErative Sub-Image Synthesis (GENESIS) to synthesize a CT image (or μ map) from dual-echo UTE images using reference or training data. Our reference data are distinguished from the atlases in atlas-based methods in that although an atlas is needed to be registered to the subject (12,13), we do not require any registration between a reference and the subject.
Our approach matches patches between the reference images and subject images based on a statistical model, similar to the idea of coherent point drift (16). The novelty of the method is 3-fold. First, it does not require any segmentation of the MR images. Second, it does not require the reference images to be registered to the subject images. Third, unlike most algorithms that use the MR images only to determine the optimal matching patches in the reference data, our algorithm uses the reference CT image as well.
MATERIALS AND METHODS
Data Description
Data were acquired under an institutional review board–approved protocol. All subjects gave written informed consent. Five patients were scheduled for 18F-FDG PET/CT and were recruited to have PET/MR immediately after the PET/CT. In addition to the MR imaging, for the purposes of this study, the PET data acquired on the PET/MR imaging and the CT data acquired on the PET/CT were used. The PET data were corrected for attenuation using 4 different methods of generating the attenuation map (μ map). Images from an additional 30 subjects who had undergone MR imaging with UTE sequences, 29 subjects with Dixon MR imaging, and 31 subjects with CT were also used for comparison later.
MR and PET images were acquired on a 3-T Siemens Biograph mMR. The dimensions of the MR UTE images were 192 × 192 × 192, and the resolution was 1.56 mm3 (repetition time [TR], 11.94 s; echo time [TE], 70 μs/2.46 ms; flip angle, 10°). PET was acquired for 5 min approximately 90 min after injection of approximately 370 MBq of 18F-FDG. For comparison, MR Dixon images were acquired with dimensions of 192 × 126 × 128 and resolution of 2.08 × 2.08 × 2.34 mm (TR, 3.6 ms; TE, 1.23/2.46 ms; flip angle, 10°). Attenuation maps were inserted in the original MR–attenuation-corrected DICOM files and imported into a specialized computer workstation for PET retrospective image reconstruction. The image reconstruction was performed using a 3-dimensional ordered-subset expectation-maximization algorithm (17) with 3 iterations and 21 subsets on a 344 × 344 × 127 matrix with a 4-mm gaussian filter.
CT images were acquired on a Biograph 128 PET/CT scanner (Siemens) with a tube voltage of 120 kVp, dimensions of 512 × 512 × 149, and resolution of 0.58 × 0.58 × 1.5 mm. CT images were rigidly registered to the corresponding MR images from the same subject. Real and synthetic CT images were transformed to μ maps (unit, cm−1) using the following criteria (11), Eq. 1where h denotes CT intensities in HU.
Inputs for CT Synthesis
Our reference data are defined as a triplet of coregistered images {a1, a2, a3} having the same resolution, where a1 and a2 denote dual-echo UTE images, where typically the first echo shows signal in bone and the second echo does not. The variable a3 denotes the corresponding CT images. The top row of Figure 1 shows a set of reference images. The subject dual-echo UTE images are denoted by b1 and b2. All the MR scans, a1, a2, b1, b2, are intensity-normalized such that the mode of their white matter intensities is at unity. This intensity normalization step is performed automatically on the basis of image histograms and is required to allow the intensity scales to be of comparable magnitude. At each voxel of the reference images, 3-dimensional overlapping patches (of size p × q × r) are considered and stacked into 1-dimensional vectors of size d × 1, where d = pqr. The MR feature vector at the jth voxel of the reference images is the concatenation of corresponding UTE patches, denoted by yj ∈ ℝ2d. The CT feature vector is the CT patch, vj ∈ ℝ2d, j = 1, … , M. Similarly, subject images b1 and b2 yield MR features denoted by xi, i = 1, … , N, xi ∈ ℝ2d, with N and M representing the number of voxels in the subject and the reference head, respectively. The unobserved CT subject patches are denoted by ui ∈ ℝd. We combine the patch triplets as 3d × 1 vectors  and
and  . The subject and the reference patch clouds are defined as the collection of patch triplets P = {pi} and Q = {qj}. For simplicity, we will use the word patch in place of feature vectors throughout the paper.

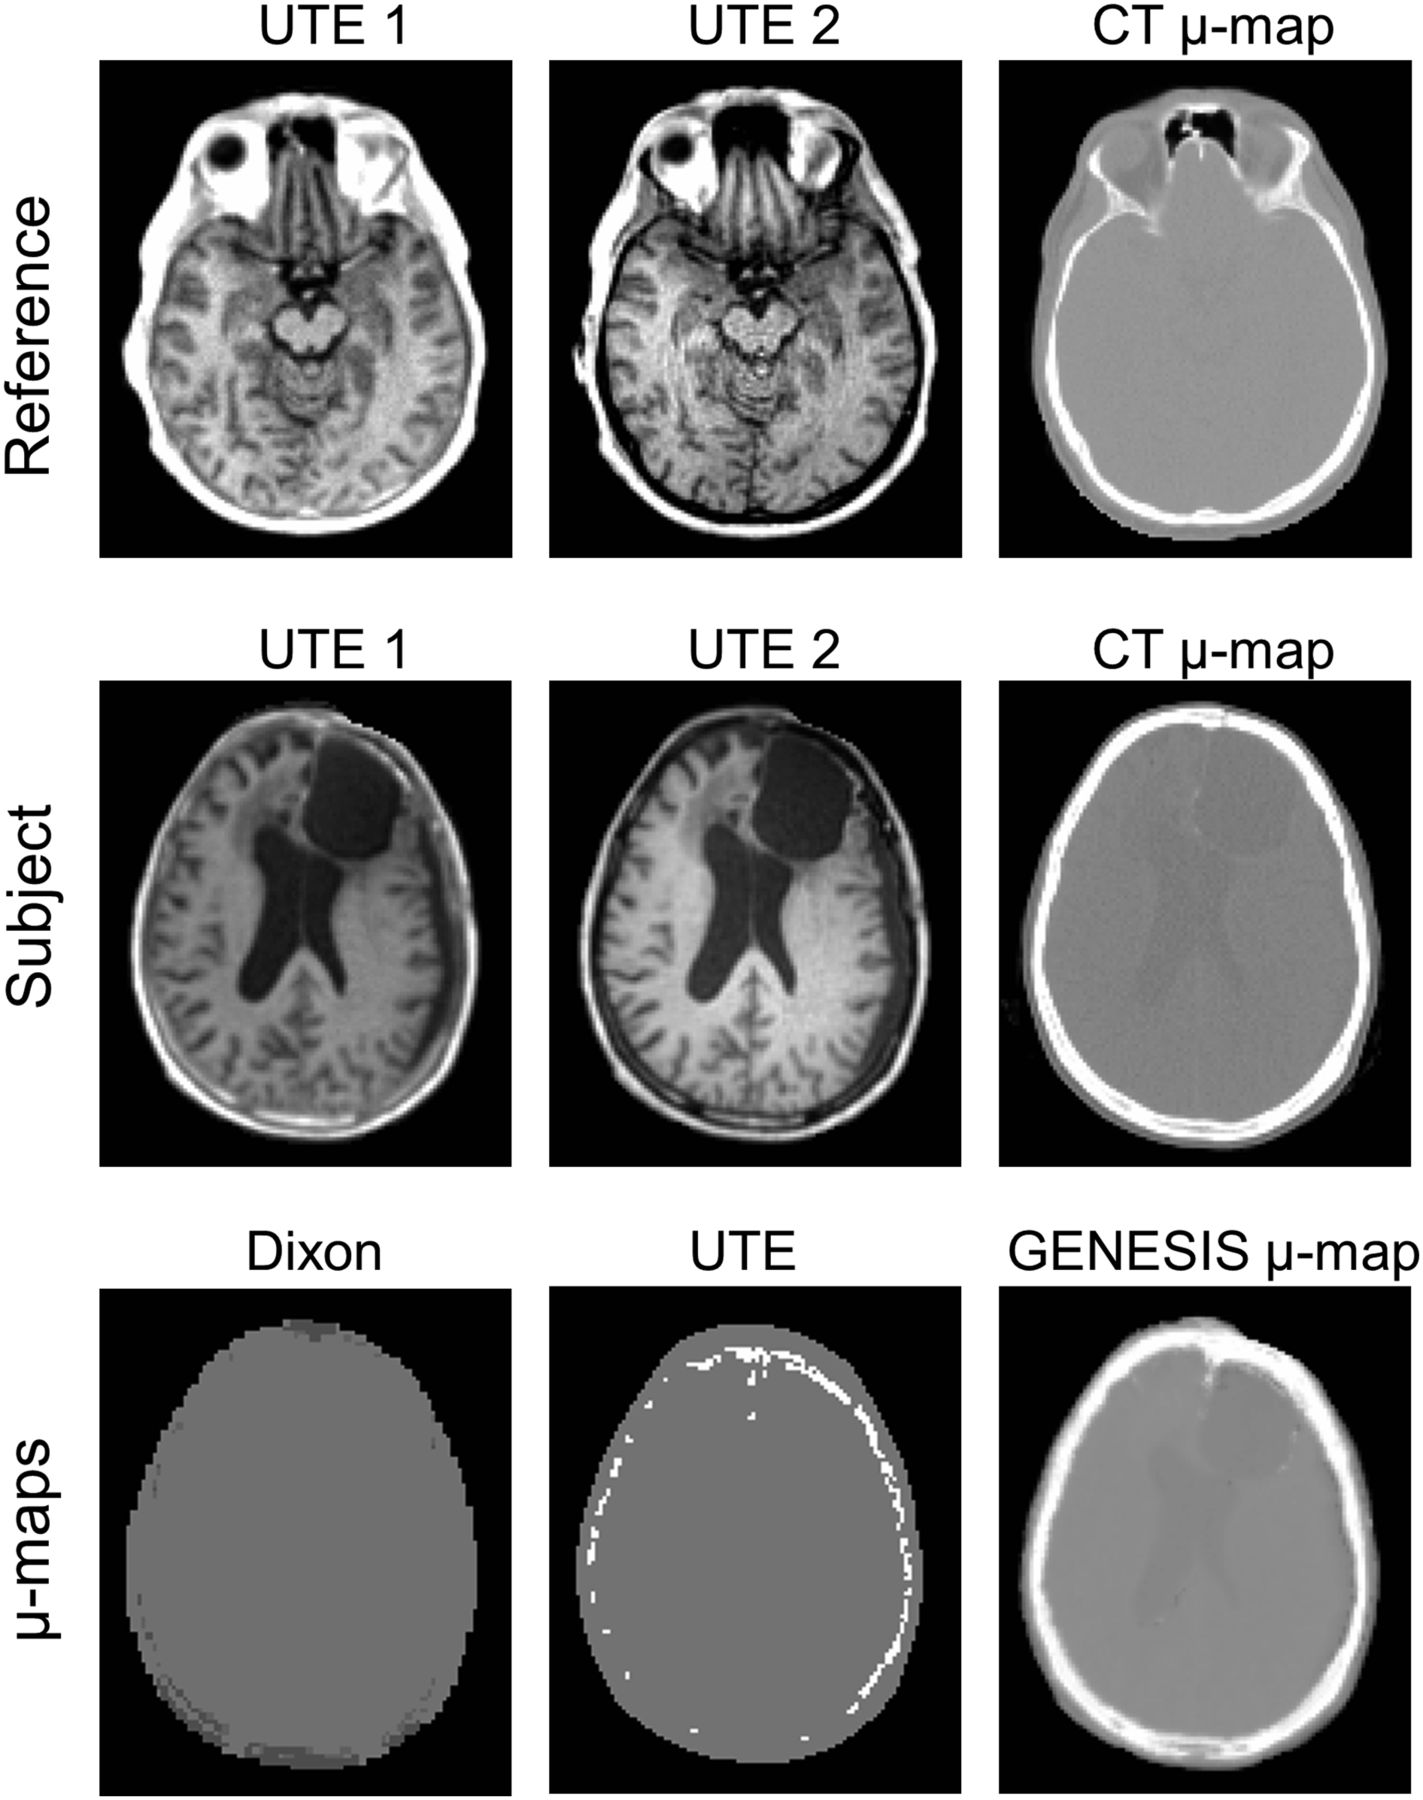
Top 2 rows show dual-echo UTE images (echo time, 70 μs and 2.46 ms) and corresponding original CT-based μ maps of reference and subject with lesion. Bottom row shows Siemens Dixon, Siemens UTE-based μ map, and our GENESIS result for subject.
Synthesis Algorithm
The subject and reference patches represent a local pattern of intensities that have been scaled to a similar intensity range. Therefore, a reference patch yj that has a pattern of intensities that is similar to a given subject patch xi likely arises from the same distribution of tissues. In that case, the corresponding CT patch in the reference vj can be expected to represent an approximate CT contrast of the subject patch. One could naively find a single patch-pair within the reference UTE images that is close (or closest) to the subject UTE patch-pair and then use the corresponding CT reference patch directly in synthesis. However, the nearest patch may not be a close representation because the patches are relatively sparse in their high-dimensional space (e.g., a 3 × 3 × 3 patch exists in a 27-dimensional space). We use 2 techniques to address the sparsity. First, since the reference patches may not be plentiful enough to closely resemble all possible subject patches, we consider all convex combinations (or “linear interpolation”) of pairs of reference patches to obtain a better representation of a subject patch. Second, on the basis of these interpolated reference patches, we construct a probability distribution with each interpolated pair acting as the mean of a component of a gaussian mixture model.
To tie the MR and CT modalities together, we further assume that the subject’s unknown CT patch is a random vector whose mean is also a convex combination of reference CT patches with the same weighting coefficients as those that generate the MR patches (18,19). However, the CT patch has a covariance matrix that is unknown and different from the unknown MR patch covariance matrix.
To formalize these ideas mathematically, consider a subject patch pi and 2 associated reference patches qj and qk. Then, pi is assumed to arise from a gaussian distribution, given by Eq. 2where Σt is a covariance matrix associated with the jth and kth reference patches. The weighting coefficient αit ∈ (0, 1) is larger when the ith subject patch is more similar to qj. Here, we assumed that pi is a gaussian mixture of all possible pairs of reference patches (qj and qk). We define ψ to be the set of all pairs of reference patch indices. From Equation 2, t is an element of ψ, and
  . Then, each subject patch is assumed to follow an
  -class gaussian mixture model, where each of the mixtures contains 2 reference patches.
We maximize the probability of observing the subject patches pi using expectation maximization (20). The details of the estimation algorithm are provided in the supplemental material (available at http://jnm.snmjournals.org). On the basis of this model, synthetic CT patches ui are estimated as Eq. 3where wit is the posterior probability that the ith subject patch belongs to the tth reference patch pair {qj, qk}. Both wit and αit are estimated using expectation maximization. Once the expectation-maximization iterations converge, the final values of wit and αit are used in Equation 3. Intuitively, it is observed that an estimated subject CT patch is a weighted average (weighted by wit) of convex combinations (associated with αit) of all reference CT patch-pairs (vj and vk ,∀ j, k). This is in accordance with our initial assumption that a subject UTE patch (xi) is a gaussian perturbation of a convex combination of a reference UTE patch-pair (yj and yk). However, the weight depends on the similarity between the subject UTE patch (xi) and relevant reference UTE patches (yj, yk), as well as the similarity between the estimated subject CT patch (ui) and reference CT patches (vj, vk).
Evaluation Approach
The synthesis took about 1.5 h on a 2.92-GHz Xeon 12-core processor (Intel). To compare the synthetic CT (or μ map) images with the 5 real CT (or μ map) images, we used Pearson linear correlation coefficient ρ and PSNR (peak signal-to-noise ratio) as error metrics. The correlation was calculated between two 1-dimensional vectors, each being a collection of nonzero voxels of the 3-dimensional image or μ-map volume. To compare reconstructed PET images, we used correlation, PSNR, coefficient of determination R2, and least-square linear regression slopes of volumes. Comparisons were made against 3 competing methods: the Dixon sequence (Siemens), the UTE sequence (version V18P; a Siemens work-in-progress sequence), and an in-house implementation of an atlas registration–based method (11). For the atlas registration method, each of the 5 patients with CT and dual-echo UTE MR scans was used as an atlas. Atlas UTE images were first deformably registered to the subject UTE (15). The transformations were then applied to the corresponding atlas CT images, and the transformed CT images were finally combined to generate a subject CT image.
To evaluate the performance of CT synthesis on a larger number of subjects, we examined the distribution of bone fraction and air fraction in 30 subjects that had dual-echo UTE images but did not have corresponding CT images. In addition to the Siemens UTE μ map, synthetic CT images were generated on these data using both GENESIS and the atlas-based registration approaches. Dixon-based results from another set of 28 subjects and CT images from another 31 subjects were used for cross-sectional comparison. Images of these subjects were acquired with the same scanners stated earlier, but these subjects did not have UTE MR scans or Siemens UTE μ maps. To remove differences in the field of view, which includes varying amounts of the neck, each μ map or CT image (synthetic and real) was affine-registered to a template CT image. The neck region was manually defined on the template by identifying an axial slice that corresponds to the neck and head boundary on the template. The neck regions were removed from each of the images using the corresponding axial slice. Bone and air volumes were computed using a threshold on the CT images (bone threshold, 300 HU; air threshold, −1,000 HU), or directly from the μ maps for the Siemens-generated results.
RESULTS
Visual Comparisons
An advantage of GENESIS is that the reference need not be registered to the subject. Because we match a subject patch to relevant patches in the reference irrespective of their spatial location, the synthetic CT quality does not suffer if the anatomy of the subject differs widely from that of the reference. An example is shown in Figure 1: synthetic μ maps generated for a patient with a large abnormality. The reference is chosen to be a patient with no similar lesion in the MR images. In Figure 1, the top 2 rows show dual-echo UTE images and the corresponding μ maps for the reference and the subject. The bottom row shows the results from the Siemens Dixon μ map (5), the Siemens UTE μ map (21), and our synthesis (GENESIS). The lesion is preserved in the GENESIS synthetic CT; furthermore, a more realistic recognition of bone is observed than with the Dixon and UTE μ maps. Comparison with the registration-based method (11) is shown in Figure 2. The white arrow in Figure 2B shows the lesion synthesized by GENESIS, which cannot be seen in the registration-based approach because none of the atlases used in registration have any lesions. Also, because deformable registration is never perfect, major misregistration error is observed for the registration result near the cerebellum (Fig. 2C, orange arrow) and minor error is observed near the ventricles (Fig. 2C, green arrow).
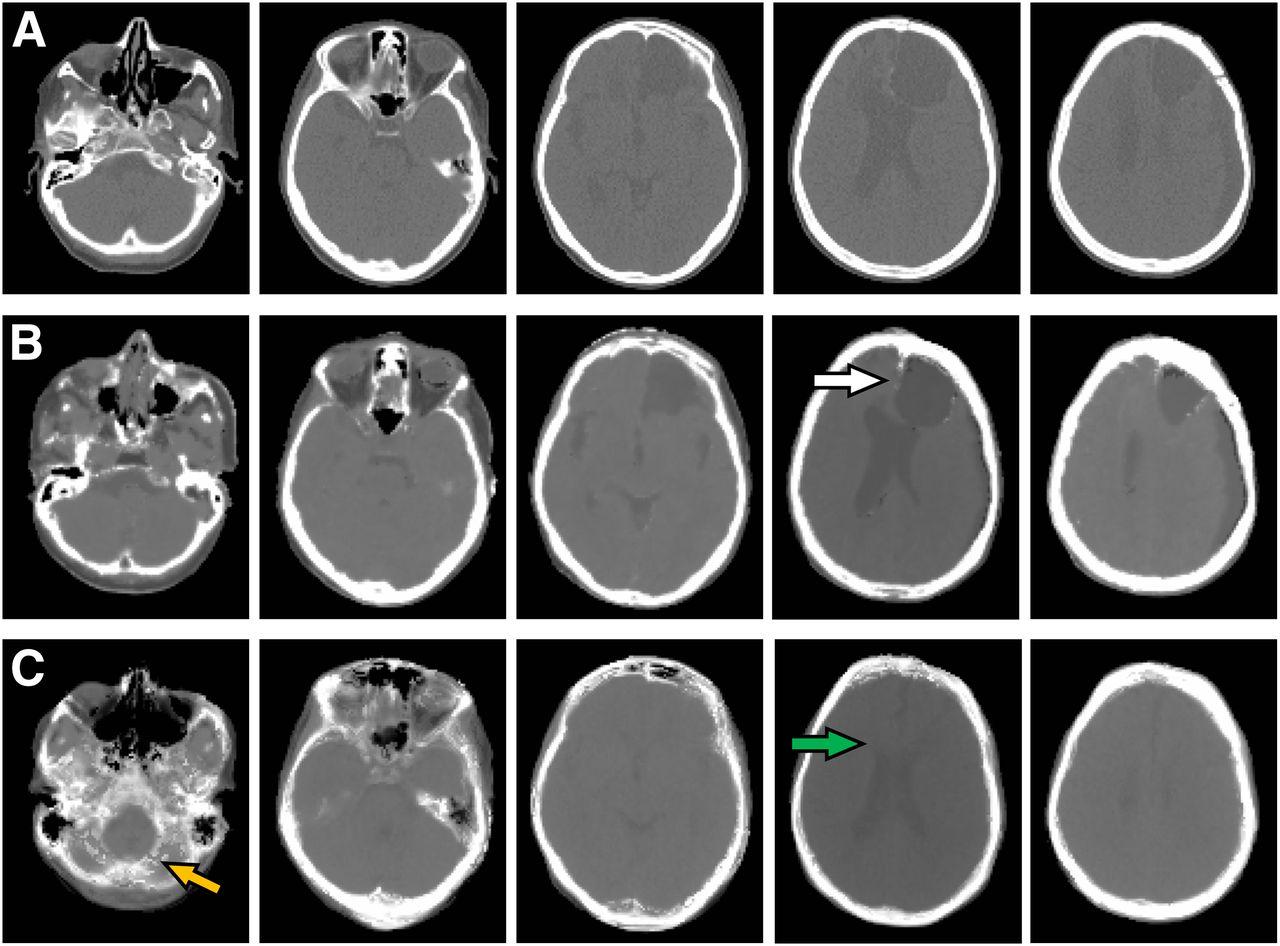
Corresponding axial sections of μ maps of subject from original CT (A), GENESIS (B), and deformable registration (C) demonstrate that, visually, GENESIS μ map is closer to original CT-based μ map than is that obtained by deformable registration. Cystic lesion in left frontal lobe (white arrow) is well represented by GENESIS but not by deformable registration. Similarly, dilation of right lateral ventricle (green arrow) is not represented in deformable registration. Misregistration in posterior fossa mislabels much of cerebellum as bone (orange arrow).
Comparison of Original and Synthetic CT Images
A quantitative comparison of correlation and PSNR between the 4 MR-based μ maps and the CT μ map is shown in Table 1 for the 5 patients with PET scans. All numbers for these and subsequent comparisons were computed on the whole head, ignoring background voxels. GENESIS consistently produced the highest correlation and the largest PSNR for all subjects, indicating that it is closest to the assumed ground truth. Because the subject with a lesion (Fig. 1) (subject 3 in Table 1) has a pathologic finding that the reference does not contain, that subject has the lowest correlation and PSNR in the GENESIS result.
Comparison of Correlation and PSNR Between the 4 MR-Based μ Maps and the CT μ Map
Figure 3 shows the percentage of air and bone fractions with respect to the relevant subject pool. Siemens UTE μ maps, GENESIS, and registration contain 30 subjects; Siemens Dixon contains 28 subjects; and true CT contains 31 subjects. Because Dixon images do not provide bone segmentation, they are used only for air fraction comparison. GENESIS provides a percentage of bone fractions (median, 16%) similar to that of the original CT images (median, 17%). Siemens UTE μ maps underestimate (median, 5%) and the registration method overestimates (median, 23%) the bone in the head (P < 0.001 using Wilcoxon rank-sum test). During registration to atlases, a little misalignment between the MR images of the subject and the atlas causes the bones in the corresponding registered CT images to become misaligned. Their combination produces blurred edges for the bones, as shown in Figure 4B (white arrow). Thus, a simple thresholding of CT images gives a higher bone fraction. The bone edges are comparatively sharper in GENESIS. Similarly, Siemens UTE and Dixon μ maps generally overestimate the air fraction (P < 0.001), whereas the registration method underestimates the air fraction (P < 0.001). GENESIS is comparable to the original CT (P = 0.75 from the Wilcoxon rank-sum test).
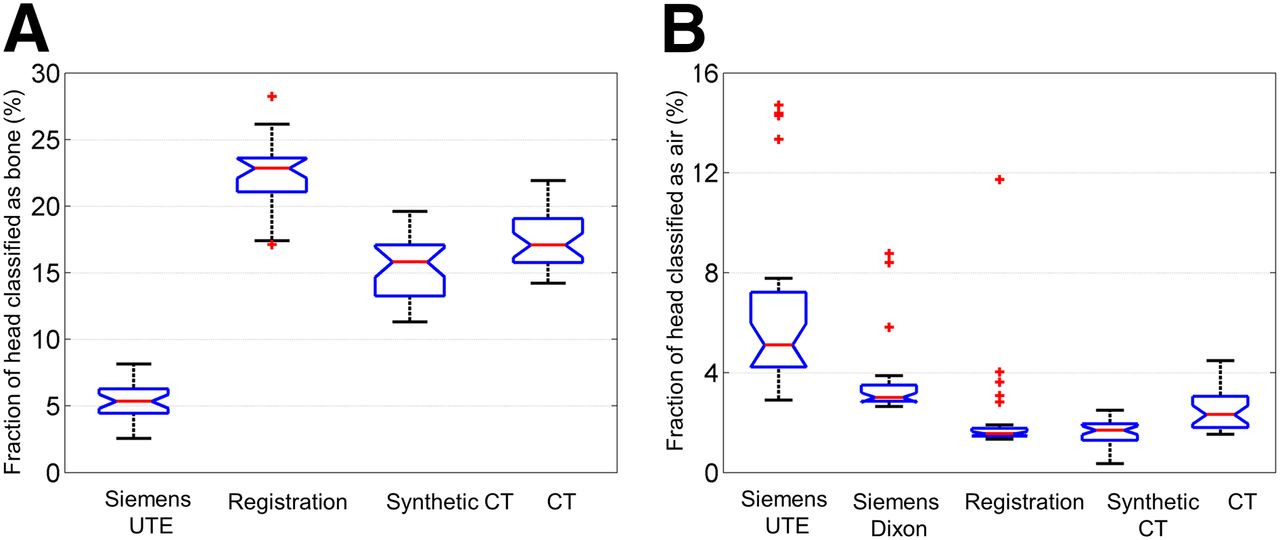
Comparison of tissue classification results for bone (A) and air (B) across different methods as compared with gold standard original CT. GENESIS most closely corresponds to gold standard. Siemens Dixon method does not allow for bone classification and hence is not represented in A.
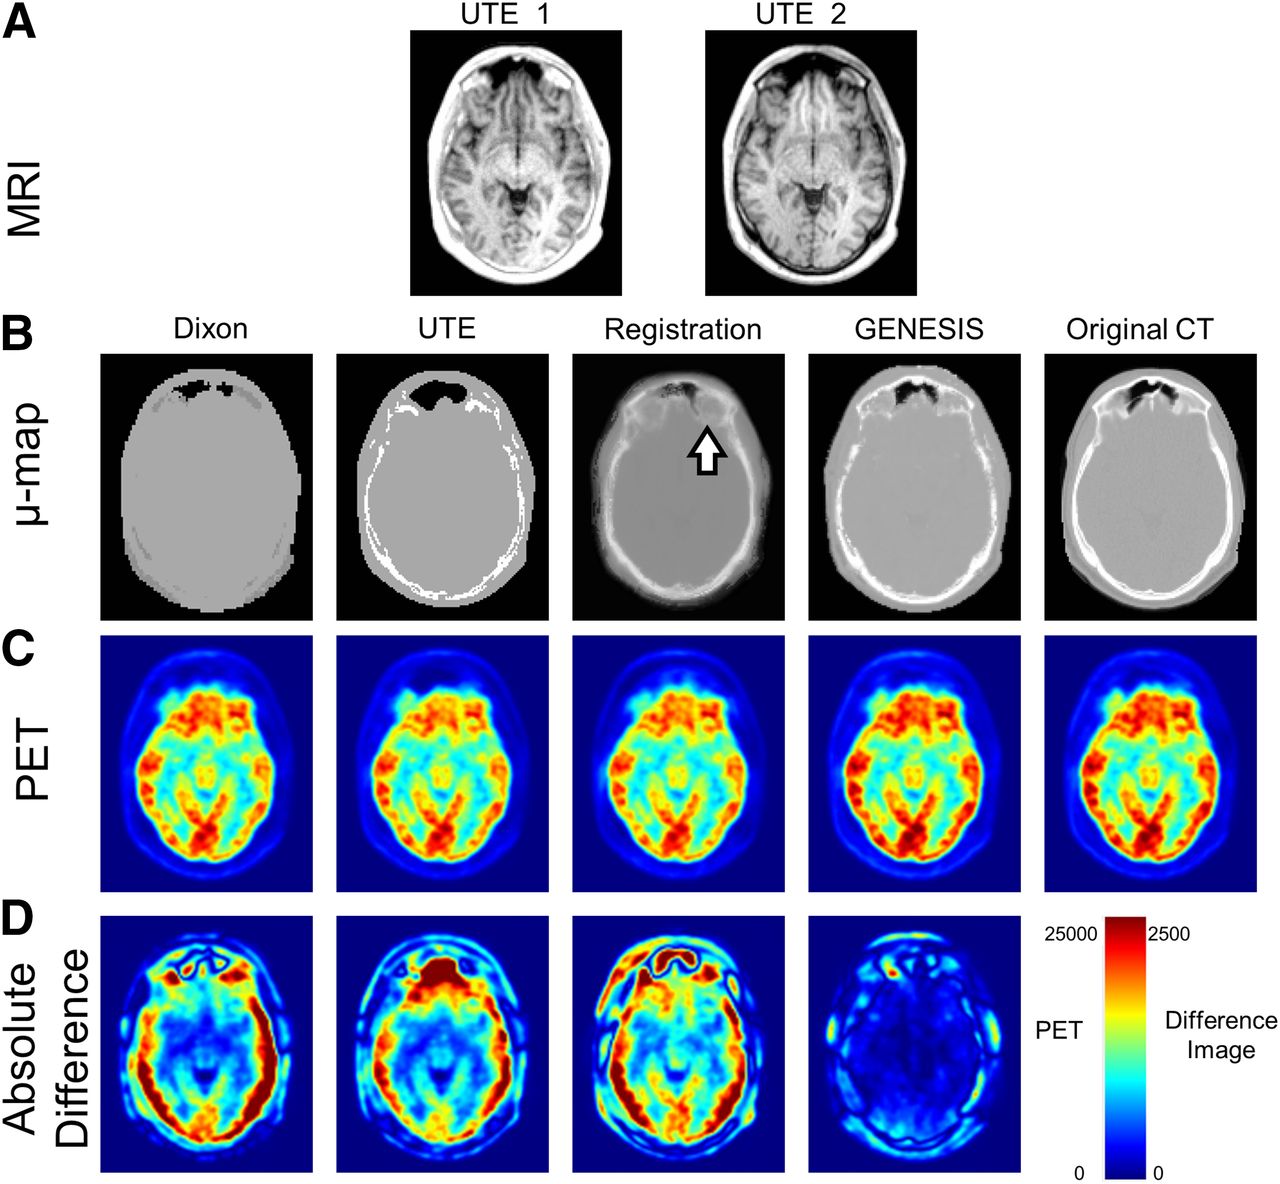
Comparison of final attenuation correction process for single subject using different methods. Initial MR UTE images (A) were converted into μ maps (B) generated using Siemens Dixon and UTE. Deformable registration and GENESIS are compared with gold standard CT. Blurring of bone is introduced by deformable registration method (white arrow in B). Although attenuation-corrected PET images (C) appear grossly similar, images representing absolute difference between each of 4 methods and original CT-based attenuation-corrected PET (D) demonstrate marked differences. Color bar for difference images represents 10-fold increase in scale relative to that for original images.
Comparison of PET Reconstruction
Figure 4B shows the synthetic CT results for a subject comparing 4 methods. Because deformable registration is inaccurate, errors are seen near the eyes and nasal cavity (white arrow in Fig. 4B), whereas the GENESIS μ map is visually closer to the truth. It also has better bone–to–soft-tissue discrimination than the Siemens UTE-based μ maps. Reconstructed PET images from the 5 μ maps are shown in Figure 4C. Assuming that the true CT–reconstructed PET is the ground truth, GENESIS provided the closest reconstructed images to the truth compared with the other 3 PET-reconstructed images, as is also seen from the difference images in Figure 4D. Visually, GENESIS produces similar reconstructed images of inside the brain.
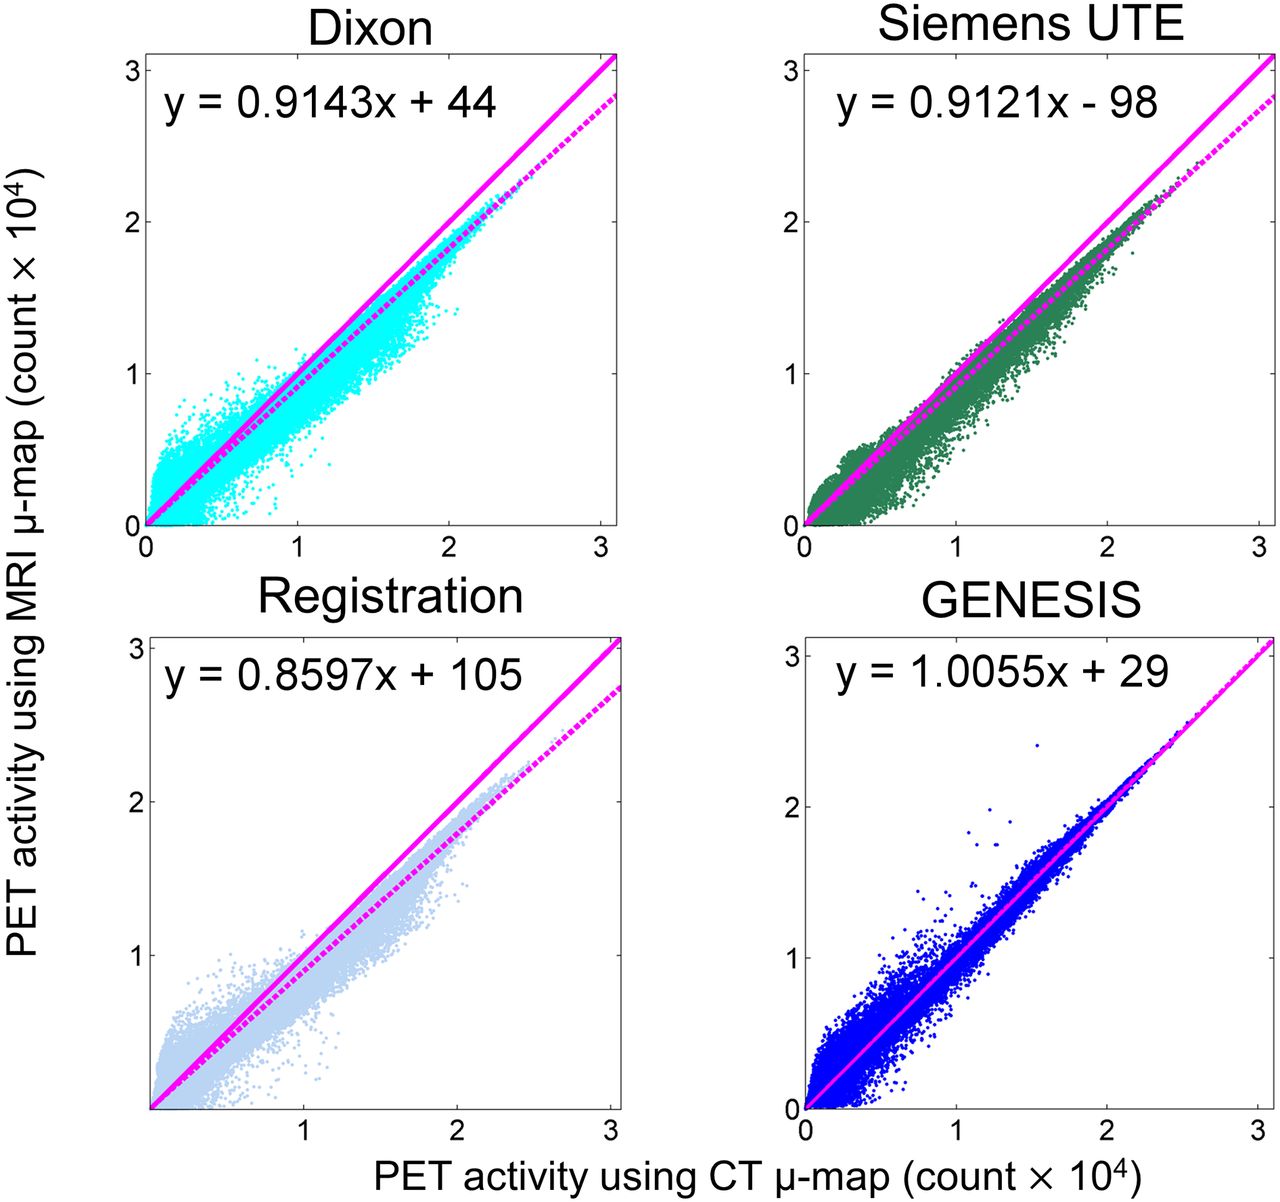
Scatterplots showing CT-based PET intensities versus MR-based PET intensities at each voxel of the PET images (Fig. 5, subject 3) show that GENESIS is less biased. The solid magenta lines indicate unit slope and the dashed magenta lines indicate a robust linear fit of the points. Evidently, for UTE, Dixon, and registration, most of the points lie below the unit slope line, indicating that the PET intensities are clearly lower than the truth. This is also indicated by the slopes of the linear regression as 0.914, 0.912, 0.860, and 1.006 for Siemens Dixon, UTE, registration, and GENESIS, respectively.

Scatterplots of CT-based PET intensities vs. MR-based PET intensities (×104) at each voxel of PET images are shown for Siemens Dixon, UTE, registration, and GENESIS. Solid magenta lines indicate unit slope, and dotted magenta lines are robust linear fit of data.
Table 2 compares 4 methods with CT-reconstructed PET images, with respect to correlation, PSNR, regression slope, and R2. Slopes of the linear regression (as in Fig. 5) should ideally be unity. With GENESIS, slopes across the 4 subjects are closer to unity than those with the other 3 methods. R2 for all 5 subjects is closer to unity than with the other 3 methods. For subject 3, with a lesion, the PSNR for GENESIS was smallest among the 5 subjects, as can be attributed to the fact that subtle lesions near the left ventricles were not synthesized in GENESIS, although the large lesion was synthesized well (white arrow in Fig. 2B).
Comparison Between 4 Methods with CT-Reconstructed PET Images, with Respect to Correlation, PSNR, Regression Slopes, and R2
Does Choice of Reference Affect GENESIS Synthesis?
In this section, we investigate whether the choice of reference images influences the quality of our CT synthesis (or PET reconstruction). For a single subject, we synthesized 5 synthetic CT images using 5 other subjects as references, as shown in Figure 6. Visually, there is little difference between them. The reconstructed PET images using the 5 different atlases were also compared with the one generated using the CT μ map. The correlations of μ maps from the 5 synthetic CT images were consistently around 0.9 as shown in Table 3. The correlations and PSNRs between each of the synthetic μ maps and original CT μ maps vary by only 0.49% and 1.24%, respectively. Similarly, the correlations and PSNRs of the PET images vary by only 0.01% and 0.64%, respectively. The percentage values are coefficients of variation, computed from the 5 numbers in each row of Table 3. Therefore, the GENESIS results are insensitive to the choice of reference.
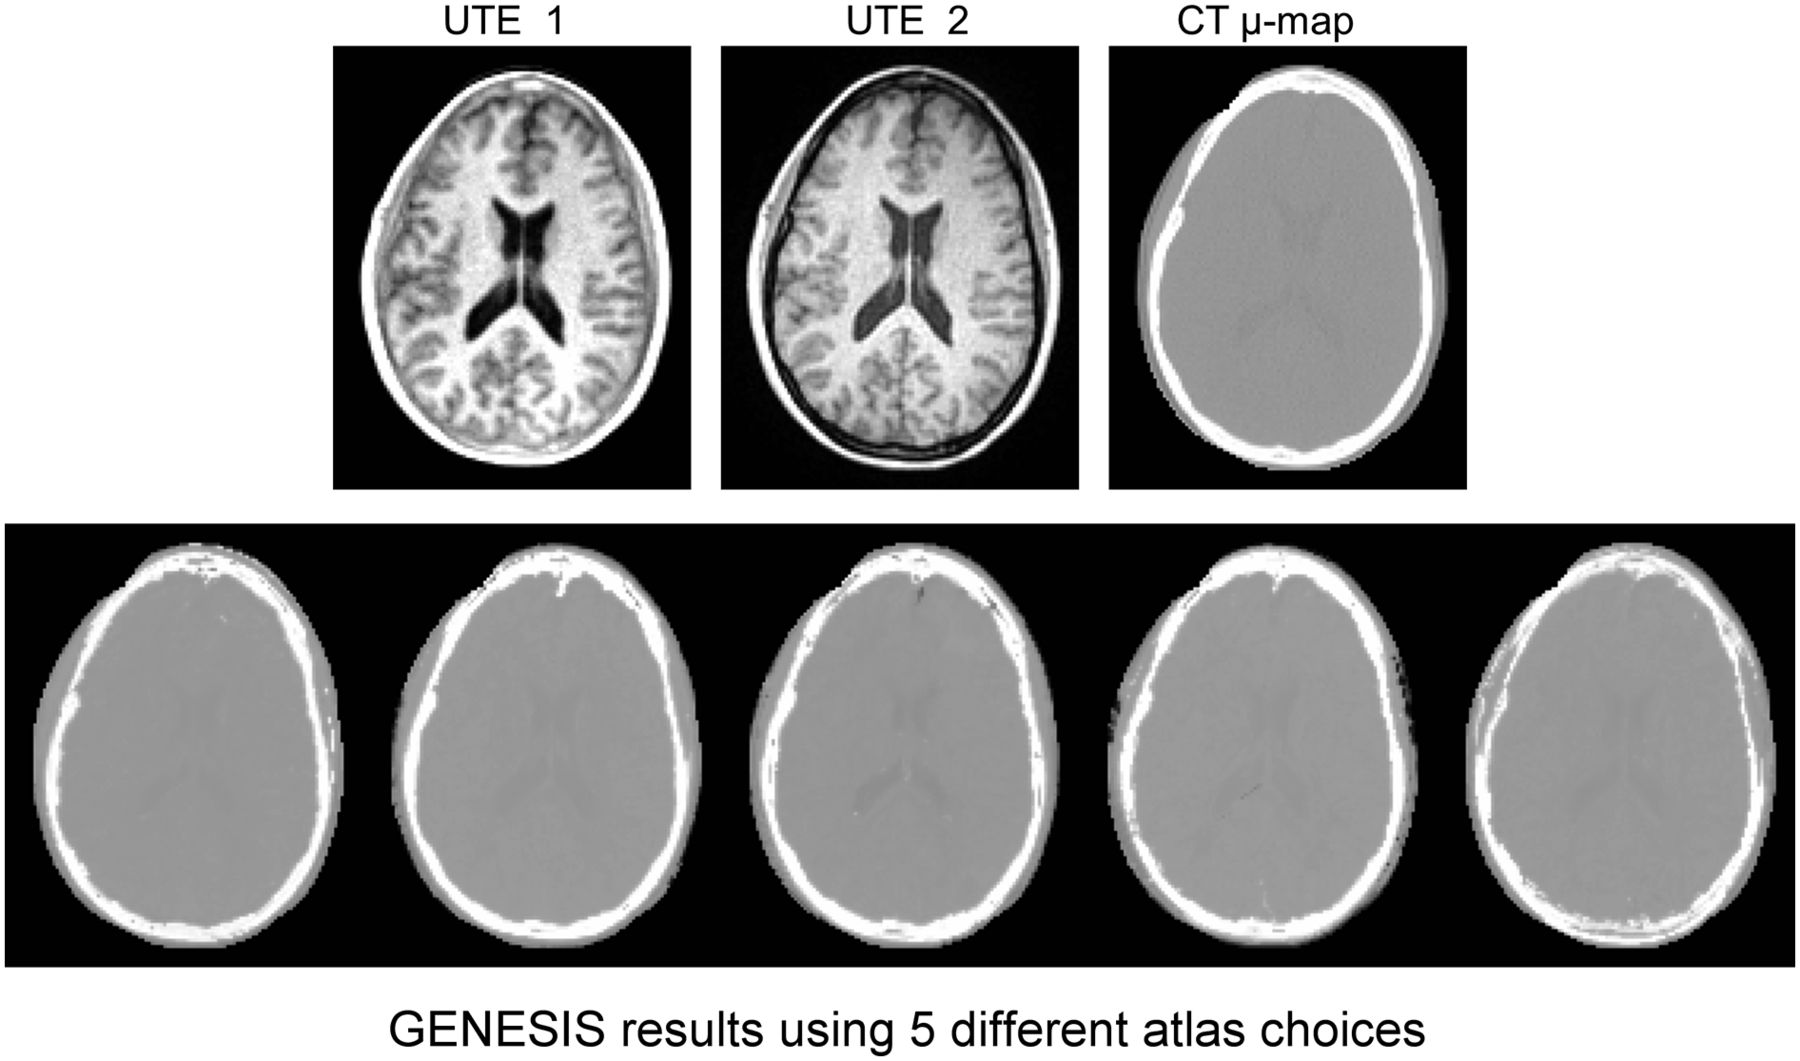
Comparison of GENESIS results using different reference data. Top row shows UTE and CT μ map of subject 3. Similarity of all 5 images in bottom row, each generated using different atlas, indicates robustness of GENESIS method and its relative independence of choice of reference atlas.
For 1 Subject, Comparison of 5 Synthetic μ Maps, Generated Using 5 Different References, with CT-Based μ Map and PET Reconstructions
DISCUSSION
We have described a framework to synthesize CT images using dual-echo UTE images from a reference. GENESIS does not use deformable registration, which can sometimes suffer from poor performance when the atlas and subject images are geometrically dissimilar. Patch matching can also be susceptible to suboptimal performance if the reference data are not sufficiently rich. However, our approach compensates for this potential liability by not being limited to only patches within the reference data. GENESIS enriches the reference data by considering convex combinations of patches sampled from gaussian mixture distributions.
The original registration-based method (11) uses 27 atlases, whereas our implementation used only 5. The accuracy of the synthetic CT images increases with the number of atlases. The smaller number of atlases potentially decreases the accuracy of our implementation of the method. Nevertheless, GENESIS outperforms the registration-based method even with a single reference image. Furthermore, deformable registrations usually take significant time as a preprocessing step (∼1 h with advanced normalization tools (15)). Nevertheless, a more detailed analysis comparing the performance of these 2 algorithms based on the number of atlases or reference images is warranted in future work.
Currently, the algorithm is implemented as research software executed in postprocessing. Integration within a clinical workflow requires data to be pulled from a PACS or scanner, processed, and sent back to the PACS within the original study. A more seamless integration could be accomplished by optimizing the code for speed and implementing the algorithm within the Siemens Image Calculation Environment.
We have previously presented a CT synthesis method from a single T1-weighted image for the sole purpose of image registration (18,19). However, standard T1-weighted MR images do not have sufficient contrast to distinguish bone from air. Therefore, the synthetic CT images were not as accurate as those synthesized using dual-echo UTE. Because the synthesis application was aimed to improve registration of MR and CT brain images, the imperfections in bone regions did not substantially affect the results. However, for brain PET attenuation correction, bone is critically important and this previous method would not be well suited. On the other hand, the current approach should perform quite well to improve MR–CT registration.
CONCLUSION
We have shown that by synthesizing a CT-like image from dual-echo UTE images, better attenuation correction can be obtained for PET/MR systems. Our method produces synthetic μ maps, which are closer to the CT μ maps than either Siemens Dixon- or UTE-based μ maps. We also performed a comparison with a recent registration-based approach and demonstrated the limitations of registration-based methods for MR to CT synthesis, particularly when the anatomy between atlas and subject significantly differs.
DISCLOSURE
The costs of publication of this article were defrayed in part by the payment of page charges. Therefore, and solely to indicate this fact, this article is hereby marked “advertisement” in accordance with 18 USC section 1734. Support for this work included funding from the Department of Defense in the Center for Neuroscience and Regenerative Medicine and the Intramural Research Program of the Clinical Center at the National Institutes of Health. This work was also supported in part by the grants NIH/NIBIB R21EB012765, 1R01EB017743, and NIH/NINDS R01NS070906. No other potential conflict of interest relevant to this article was reported.
Footnotes
Published online Nov. 20, 2014.
- © 2014 by the Society of Nuclear Medicine and Molecular Imaging, Inc.
REFERENCES
- Received for publication June 4, 2014.
- Accepted for publication October 20, 2014.


