


Abstract
PET has been used for the presurgical localization of epileptic foci for more than 20 y; still, its clinical role in children with intractable epilepsy remains unclear, largely because of variable analytic approaches and different outcome measures. The purpose of the present study was to evaluate and optimize the performance (lateralization and lobar localization value of epileptic foci) of objective voxel-based analysis of 18F-FDG PET scans in a pediatric epilepsy population. Methods: Twenty children with intractable focal epilepsy (mean age ± SD, 11 ± 4 y; age range, 6–18 y) who underwent interictal 18F-FDG PET, followed by 2-stage epilepsy surgery with chronic subdural electrocorticographic monitoring, and were seizure-free after surgery were included in this study. PET images were analyzed using both a visual-analysis and a statistical parametric mapping (SPM) method. Lateralization value and performance of lobar localization (in lateral and medial surfaces of all lobes, total of 8 regions in each epileptic hemisphere), calculated for 3 different statistical thresholds, were determined against intracranial electrocorticography-determined seizure-onset region and surgical resection site. Results: SPM using a statistical threshold of P less than 0.001 provided 100% correct lateralization, which was better than visual assessment (90%). Although visual and SPM analyses (with both P < 0.001 and P < 0.0001 thresholds) performed similarly well (with a sensitivity and specificity of 74% or above) in the localization of seizure-onset regions, SPM detected 7 of 9 seizure-onset regions, mostly in medial cortices, that were missed by visual assessment. Also, SPM performed equally well in both hemispheres, compared with visual analysis, which performed better in the left hemisphere. No statistical difference in performance was observed between visual and SPM analyses of children with abnormal versus normal MRI findings or of children with gliosis versus developmental pathology. Clinical variables, such as age, duration of epilepsy, age of seizure onset, and time between PET and last seizure, showed no correlation with sensitivity or specificity of either visual analysis or SPM analysis. Conclusion: SPM analysis, using a young adult control group, can be used as a complementary objective analytic method in identifying epileptogenic lobar regions by 18F-FDG PET in children older than 6 y.
Children with intractable epilepsy pose a diagnostic and therapeutic challenge and should be considered for early epilepsy surgery, because successful resection of epileptic foci may lead to better social, psychologic, and cognitive development. The most important aspect of presurgical evaluation is to identify a discrete epileptogenic region, which can be resected without causing an unacceptable loss of neurologic function and will lead to complete seizure control. Functional neuroimaging, combined with ictal electroencephalography, can play an important role in these patients by providing noninvasive presurgical localization of epileptogenic foci, particularly because many epileptic children do not have any visible brain lesion on MR images (i.e., nonlesional patients), whereas others may show multifocal structural abnormalities (1). Although 18F-FDG PET has been used for the presurgical evaluation of epileptic foci in children with intractable seizure (2–17), its clinical value in the presurgical identification of epileptic foci is still debated. Also, because PET analysis in the clinical setting is mostly based on visual assessment, comparison across the centers is difficult and may be a reason for the variable performance of 18F-FDG PET reported in the literature.
Statistical parametric mapping (SPM) is an objective voxel-based analysis technique that has been used in adult epilepsy patients to detect focal abnormalities corresponding to seizure foci (18–20). However, SPM is not widely used in pediatric epilepsy populations, because of the lack of an age-matched healthy control group (which is difficult to acquire because of ethical considerations). We had previously shown the technical feasibility of SPM in epileptic children older than 6 y when using healthy young adults as controls (21). Still, so far there has been only 1 study that has applied SPM analysis of 18F-FDG PET in pediatric epilepsy patients (12); however, that study included only children with temporal lobe epilepsy and MRI-positive hippocampal sclerosis. Few other PET studies with SPM included some children, but most subjects were adults (8,10,13–15,22). Therefore, it is hard to generalize the findings of these studies and extrapolate them to a pediatric epilepsy population. Moreover, previous studies did not compare the performance of objective versus visual (which is used clinically) PET analytic approaches.
The purpose of the present study was to test and optimize the performance (lateralization and lobar localization value of epileptic foci) of SPM analysis of 18F-FDG PET scans for pediatric epilepsy studies. We used SPM with various statistical thresholds in children with intractable epilepsy who underwent 2-stage surgery with extensive subdural electrode coverage. We also analyzed whether SPM provided any benefit over visual assessment in this patient population. We used a selected group of epilepsy patients who underwent detailed presurgical evaluation, followed by epilepsy surgery, and were seizure-free after at least 1 y of postsurgical follow-up. The advantage of such selectivity was to ensure the identification of epileptogenic regions (lobes) with high certainty.
MATERIALS AND METHODS
Patients
Twenty children (mean age ± SD, 11 ± 3.8 y; 10 girls) with intractable focal epilepsy of both temporal and extratemporal origin (9 with left- and 11 with right-hemispheric seizure foci) who underwent epilepsy surgery were included in this study. The inclusion criteria included age between 6 and 18 y; detailed presurgical evaluation, including MRI, scalp video electroencephalographic monitoring, neuropsychologic evaluation, and interictal 18F-FDG PET; 2-stage epilepsy surgery with chronic subdural electrocorticographic monitoring; at least 1 y of postsurgical follow-up; and seizure-free outcome. The exclusion criteria were diagnosis of tuberous sclerosis, tumors, or major hemispheric deformity (such as hemimegalencephaly, perisylvian polymicrogyria, and porencephaly); hemispherectomy; and history of prior epilepsy surgery.
On the basis of chronic subdural electrocorticography data, ictal seizure onset was localized in 1 lobe (n = 13: temporal, 6; frontal, 3; parietal, 3; and occipital, 1) or in 2 adjacent lobes (n = 7: frontoparietal, 4; temporoparietal, 1; frontotemporal, 1; and parietooccipital, 1). MRI results were abnormal in 12 children, including 4 with bilateral abnormalities. MRI abnormalities included cortical dysplasia (n = 5), heterotopias (n = 2), focal cortical atrophy (n = 1), polymicrogyria (n = 1), hippocampal atrophy (n = 1), and nonspecific signal changes in the cortex (n = 2). Fifteen children, although seizure-free after surgery, were still taking some antiepileptic medication. The summary of clinical and demographic profiles of these children is given in Table 1 The control group for SPM analysis of PET scans included 13 young healthy subjects (mean age ± SD, 26 ± 3 y; age range, 22–30 y) with normal MRI results and no prior history of any medical, developmental, or psychiatric disorders. All participants were studied according to the guidelines of the Human Investigations Committee of Wayne State University. Written informed consent was obtained from the controls and from the parents or legal guardians of the children with epilepsy. The Human Investigations Committee at Wayne State University granted permission for the retrieval and analysis of the data that had been obtained clinically for these children.
Demographic and Clinical Profile of Patients
18F-FDG PET
The tracer 18F-FDG was produced in-house using a Siemens RDS-11 cyclotron. 18F-FDG PET studies were performed using a CTI/Siemens EXACT/HR whole-body PET scanner, as described previously (23,24). The scanner has a 15-cm field of view and generates 47 image planes with a slice thickness of 3.1 mm. The reconstructed image in-plane resolution is 5.5 ± 0.35 mm in full width at half maximum (FWHM) and 6.0 ± 0.49 mm in the axial direction. A 20-min static emission scan was acquired after a 30-min 18F-FDG uptake period. Computed attenuation correction was used to correct the brain images for attenuation of 511-keV photons. All patients fasted for 4 h before the 18F-FDG injection (5.291 MBq/kg [0.143 mCi/kg]). During the 18F-FDG uptake period, children with epilepsy underwent continuous scalp electroencephalographic monitoring. During the scanning phase (but not during the uptake period), sedation was used, as necessary, in children. All children were continually monitored by pediatric nurses with special training in the sedation of children for radiologic procedures. Heart rate, blood pressure, and pulse oximetry were also measured during the PET procedure.
Chronic Subdural Electrocorticographic Monitoring and Cortical Resection
Chronic subdural electrocorticography was performed for 2–7 d after the surgical implantation of platinum grid electrodes (10-mm intercontact distance, 4-mm diameter; Ad-Tech Medical) during stage 1 of the 2-stage surgery, as described previously (25). In all patients, the extensive electrode coverage (88 electrodes per patient, on average) included parts of the frontal, temporal, and parietal cortices (both lateral and medial). In addition, the occipital cortex, for which noninvasive electroencephalography, imaging, or seizure semiology data suggested potential occipital lobe seizure onset, was covered. Board-certified clinical neurophysiologists visually reviewed ictal subdural electrocorticographic recordings and determined seizure-onset zones, as described previously (25). Although cortical resection was guided by ictal and interictal intracranial electrocorticography and clinical and neuroimaging data (including visual 18F-FDG PET assessment, but not SPM findings), as described previously (25), resection margins were ultimately decided by electrocorticographic findings, including ictal and interictal epileptiform activity and the results of cortical stimulation data.
18F-FDG PET Analysis
Visual Evaluation.
18F-FDG PET images were visually evaluated by 2 of the investigators with expertise in reading pediatric brain PET images. Cortical areas with hypometabolism were visually determined before the surgery, and the evaluators were unaware of the findings of scalp video electroencephalographic monitoring and MRI. The glucose metabolic pattern (hypometabolic or normal) of 16 major brain regions (8 in each hemisphere, corresponding to lateral and medial surfaces of the 4 lobes [frontal, temporal, parietal, occipital]) was evaluated and separately reported after the 2 readers reached a consensus.
SPM Analysis.
Static 18F-FDG PET image volumes were analyzed using the SPM2 software package developed at the Wellcome Department of Cognitive Neurology, Institute of Neurology (26,27). 18F-FDG PET image volumes were spatially normalized into standard stereotactic space using a PET image template provided by the SPM2 software package. We used 12 affine (linear) parameters, followed by a linear combination of (nonlinear) 3-dimensional basis images to minimize the sum of squares between the individual image volume and image template. We selected the default number of basis functions (7 × 8 × 7), applied medium regularization, chose 12 nonlinear iterations, and used a smoothing kernel of 16 mm, with a resulting FWHM of 18.6 mm and about 240 resolution elements. The choice was based on our previous experience with the evaluation of various kernel sizes (12–22 mm) in pediatric and adult populations, for which we had found essentially similar unique artifacts associated with both high and low kernel size and a 17-mm kernel size appeared to be reasonable in that study (21). Our choice of a relatively large FWHM smoothing kernel was further motivated by our focus on specificity, and we thus sacrificed some of the sensitivity.
To analyze regionally specific effects, a general linear model was used to assess differences among parameter estimates (specified by contrasts). This assessment was performed using a t statistic (SPM[t]). For each voxel, a t test was performed to determine the significance of the overall model as specified by the design matrix. The significance of individual contrasts was tested using the SPM(t) for each voxel. The confounding effect of global activity was removed using proportional scaling. Subsequently, a 2-sample t test, based on the specified contrasts, was applied, and the resulting SPM(t) (or equivalent SPM[z]) statistic was thresholded at 3 levels: P < 0.001 (uncorrected) (SPMP < 0.001 [uncorrected]), P < 0.0001 (uncorrected) (SPMP < 0.0001 [uncorrected]), and P < 0.05 (corrected) (SPMP < 0.05 [corrected]). Although only detected regions of more than 100 contiguous voxels (voxel size, 1.8 × 1.8 × 3.1 mm) were considered to be of significant size (12,28), the results did not change with a threshold of either 50 or 200 voxels, because all but 1 cluster was larger than 200 voxels. The resulting foci were then characterized in terms of spatial extent (k) and peak height (u). The significance of each focus was estimated using distributional approximations from the theory of gaussian fields, based on the number of resolution elements in the image volume. Similar to visual assessment, SPM abnormalities were also determined to be present or absent in the 8 major brain regions in each hemisphere, corresponding to lateral and medial cortical surfaces of the 4 lobes.
Study Design and Statistical Analysis
Initially, the performance of both visual and SPM analyses in lateralizing the seizure focus was assessed. Focus lateralization was based on the consensus reporting of 2 independent investigators for visual PET analysis and on the severity of hypometabolism (side showing the highest z value) for SPM analysis. In cases of bilateral abnormalities, the magnitude and extent of hypometabolism were also considered during visual analysis before a final decision about focus lateralization was made.
Subsequently, the performance of both visual and SPM analyses in localizing epileptogenic regions was assessed separately against 2 different reference measures: seizure-onset area, defined by intracranial electrocorticography, and cortical regions included in the resection (resection sites were defined by surgical notes, intraoperative photographs, and postsurgical MRI). Both seizure-onset area and resection site were determined as present or absent in 8 brain regions (corresponding to lateral and medial surfaces of all 4 lobes) in the epileptic hemisphere. Subsequently, hypometabolism or normal glucose metabolism in each region, as shown by visual or SPM analysis, was categorized as true- or false-positive or true- or false-negative against the 2 reference measures. Performance parameters such as sensitivity, specificity, and positive predictive value (PPV) and negative predictive value (NPV) of visual or SPM analyses were calculated against the 2 reference measures in each patient individually and then averaged for the whole group.
18F-FDG PET performance parameters were also compared between patients with (n = 12) and without lesions (n = 8) visible on MR images and between patients with left- (n = 9) and right-hemispheric seizure foci (n = 11). In addition, individual performance parameters (derived against seizure-onset area defined by intracranial electrocorticography, as the reference, only) were correlated with clinical variables such as age at surgery, duration of epilepsy, age at seizure onset, and time between PET and last seizure.
Values are reported as mean ± SD. The χ2 test was used to evaluate the difference between the proportions of various categoric variables for 2 or more groups, and paired or unpaired t tests or ANOVA was performed to evaluate the difference in various continuous variables. Wherever appropriate, corresponding nonparametric tests were used and P values reported. SPSS (version 17.0; SPSS Inc.) was used for the data analyses.
RESULTS
Detection of Focal Hypometabolism and Lateralization of Epileptic Foci
All 20 PET scans showed at least 1 region of focal cortical hypometabolism on both visual assessment and SPM analysis with the lowest threshold (SPMP < 0.001 [uncorrected]). No hypometabolism was detected in 1 patient using SPMP < 0.0001 (uncorrected) and in 5 patients using SPMP < 0.05 (corrected). Bilateral abnormalities were detected in 4 patients by visual analysis and in 3–12 patients by SPM, depending on the threshold (Table 2). Correct lateralization, based on the site with the highest z value, was achieved in all 20 patients by SPM, including 2 patients in whom lateralization was not certain on visual examination because of bilateral abnormalities (Fig. 1).

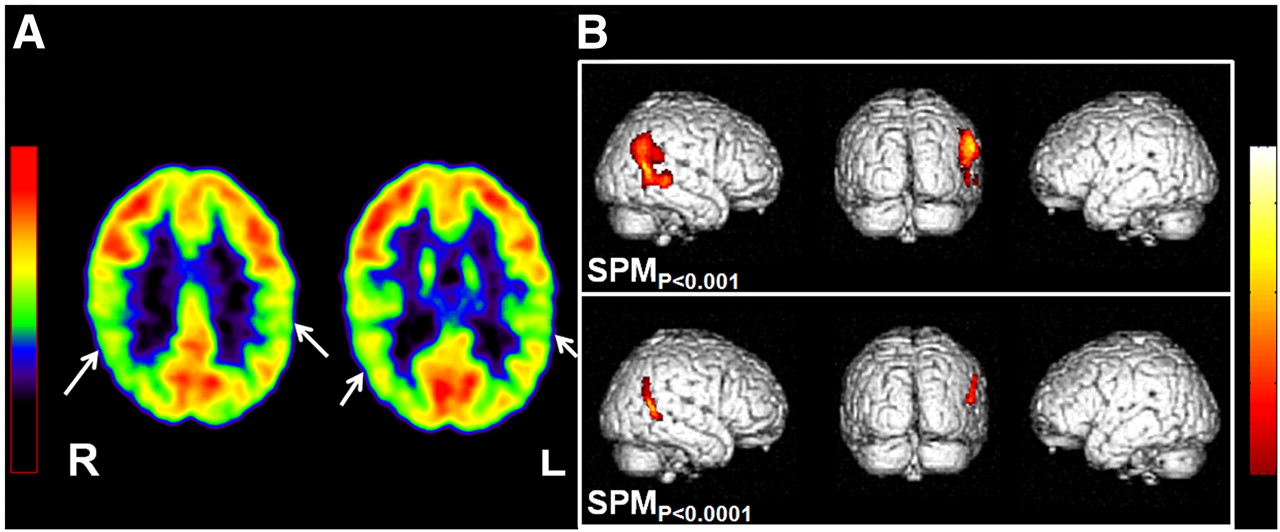
Role of SPM in lateralizing epileptic focus in case of bilateral visual abnormality on 18F-FDG PET scan for 14.5-y-old boy with intractable seizures and normal MRI results. (A) Visual analysis showed bilateral parietal hypometabolism (arrows), with no clear lateralization. (B) SPM analysis, both with threshold of P < 0.001 (upper panel) and with threshold of P < 0.0001 (lower panel), however, could lateralize epileptic focus to right hemisphere by showing single area of hypometabolism in right parietal region. Area of hypometabolism was much smaller with higher threshold (P < 0.0001). Subsequent subdural electroencephalographic monitoring also showed seizure onset from same region. Patient underwent right parietal lobe resection and has been seizure-free for 2 y.
Detection of Focal Hypometabolism and Lateralization of Epileptic Foci
Performance of Visual and SPM Analyses
Against Electrocorticography-Defined Seizure-Onset Areas.
The sensitivity and specificity for detecting electrocorticography-defined seizure-onset areas was at least 75% for both visual and SPM analyses using uncorrected thresholds, whereas the sensitivity for SPM using a stricter (P < 0.05, corrected for multiple comparisons) threshold was unacceptably low (60%; Table 3). Nine seizure-onset areas (of a total of 35 seizure-onset regions) were missed by visual analysis, and these were most commonly located in the medial cortex (n = 7). Of these 9 areas, 7 (77.8%) were detected by SPMP < 0.001 (uncorrected) (Fig. 2). In contrast, SPMP < 0.001 (uncorrected) missed 5 areas of seizure onset, mostly in the lateral cortex (n = 4), of which visual analysis detected 2 areas.
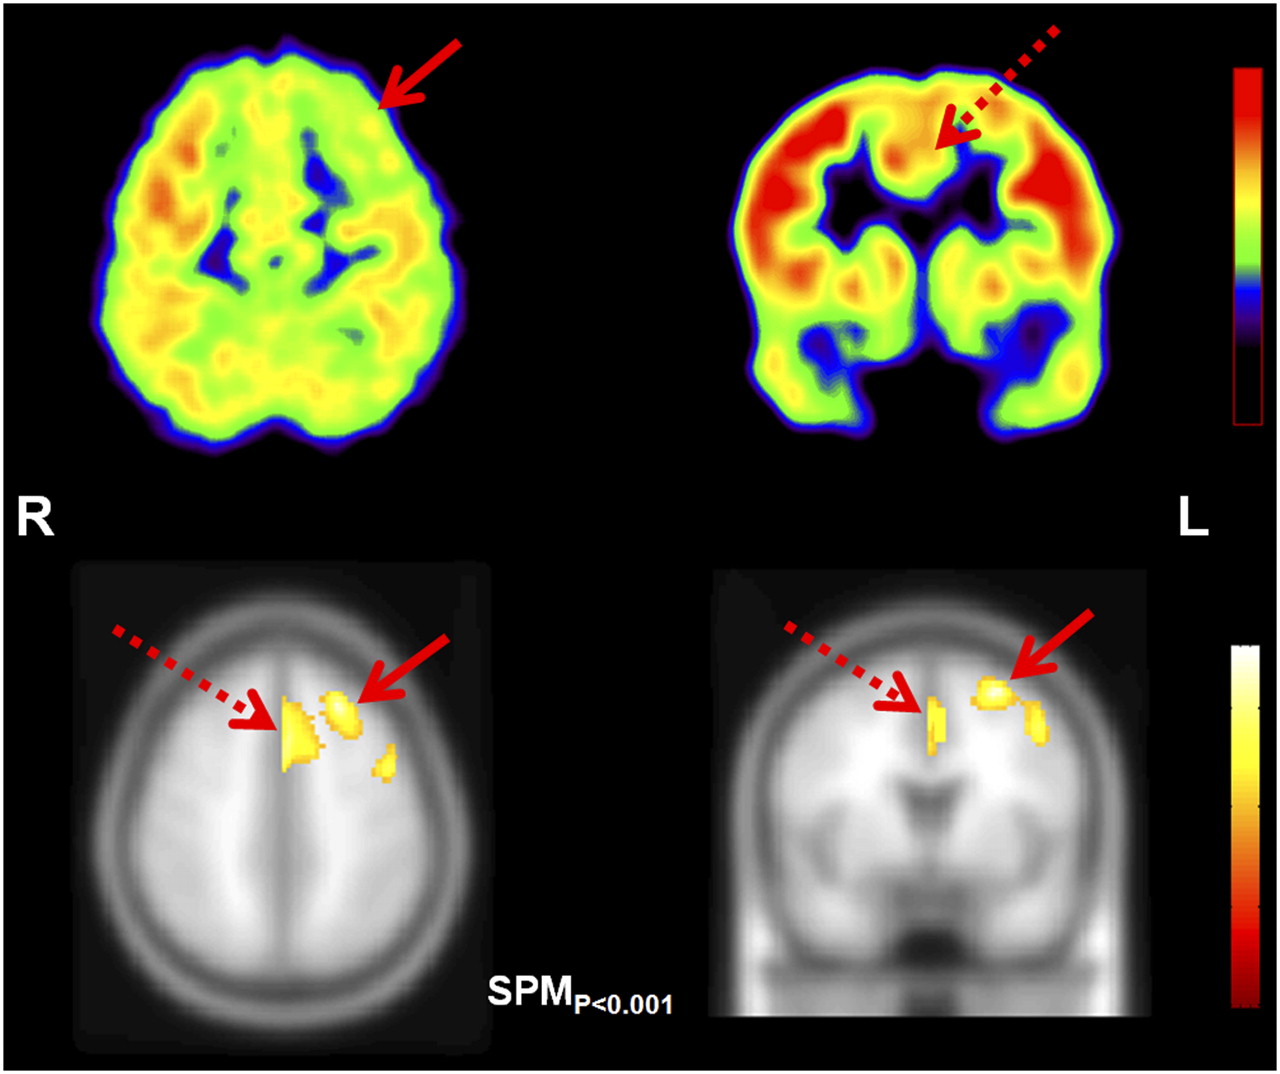
Role of SPM in identifying medially located epileptic foci. (Upper) Axial and coronal slices of 18F-FDG PET scan. (Lower) Results of SPM analysis, with threshold of P < 0.001, on axial and coronal slices of T1-weighted template MR image. On visual assessment, 18F-FDG PET scan showed area of hypometabolism in left frontal cortex (solid arrow) in 9-y-old boy with intractable epilepsy and normal MRI results. SPM analysis detected hypometabolism in same area (solid arrow) but also revealed additional area of hypometabolism in left medial frontal cortex including cingulum (broken arrow), missed by initial visual analysis and only suspected later on reanalysis (broken arrow). Subdural electroencephalographic monitoring showed independent seizure onset from both lateral and medial frontal cortices (captured by interhemispheric electrodes). Patient underwent left frontal lobe resection, including medial frontal lobe, and has been seizure-free for 6 y.
Performance of Visual and SPM Analyses of 18F-FDG PET Scan
No statistical difference in performance was observed between visual and SPM analyses of children with abnormal (n = 12) versus normal MRI (n = 8) results or of children with gliosis (n = 8) versus developmental pathology (n = 12). Clinical variables, such as age, duration of epilepsy, age at seizure onset, and time between PET and last seizure showed no correlation with sensitivity or specificity for either visual or SPM analyses. Although the sensitivity of visual analysis was higher (89% vs. 60%; P = 0.004) and specificity was lower (67% vs. 89%; P = 0.007) in the left- than in the right-epileptic hemisphere, no statistical difference in the performance of SPM was observed in either of the hemispheres (P > 0.05 for all comparisons) (Table 3). Also, no statistically significant difference between the performances of visual and SPM analyses was found when patients with left- or right-hemispheric epileptic foci were analyzed separately, using the Wilcoxon signed rank test (P > 0.05 for all comparisons).
Against Surgical Resection Areas.
The sensitivity and NPVs of both visual and SPM analyses of 18F-FDG PET were lower, but specificity and PPVs were higher, when calculated against the resection site, compared with the corresponding values calculated against the electrocorticography-defined seizure-onset area (Table 3). The difference was significant for the sensitivity of SPM analyses (with all 3 thresholds; P < 0.01), for the specificity of visual analysis (P = 0.004), and for the PPVs and NPVs of both visual and SPM analyses with uncorrected thresholds (P < 0.01).
DISCUSSION
18F-FDG PET abnormalities detected by objective SPM analysis show an excellent lobar concordance with epileptogenic regions, whether defined by intracranial electrocorticography or by resection site in children older than 6 y who underwent epilepsy surgery. SPM with uncorrected thresholds performed equally well, with greater than 75% sensitivity and specificity in both lesional and nonlesional cases. Both uncorrected statistical thresholds that were used in SPM analysis performed well in obtaining clinically useful results for lobar localization; however, the stricter corrected threshold, though highly specific, yielded unacceptably low sensitivity (60%). Even though the general localization value of visual assessment and SPM analysis is comparable, SPM is particularly useful in identifying medially located epileptic foci, which may be missed on visual assessment. Also, SPM, compared with visual analysis (which tends to overestimate left-sided foci), performs equally well in both hemispheres. Higher specificity and predictive value of visual and SPM findings, with the surgical resection site as a reference, indicates that some hypometabolic regions outside the lobes of seizure onset can be surgically relevant, because they are included in surgical resection (e.g., when they are sites of frequent interictal spiking) in some patients.
Our study revealed that the use of SPM analysis had several added advantages over visual analysis. First, SPM with the lowest applied threshold (SPMP < 0.001 [uncorrected]) could correctly lateralize the side of the epileptic focus in all patients using the location of the highest z value (i.e., the voxel with most severe hypometabolism), even in patients with bilateral MRI or PET abnormalities. In addition, SPM performed equally well in both left and right hemispheres, whereas visual analysis was more sensitive in detecting left-hemispheric hypometabolism. The reason for this side-specific sensitivity of visual analysis might be that visual assessment, unlike voxel-based analysis, is highly dependent on the detection of left or right asymmetries. However, some degree of normal glucose metabolic asymmetry, particularly lower metabolism in the left cortex, is present in the normal human brain (29–32). Normal (physiologic) metabolic asymmetry may accentuate minor left-sided hypometabolism or mask subtle right-sided hypometabolism, leading to a worse sensitivity (but higher specificity) for detecting right-sided, as compared with left-sided, cortical hypometabolism in visual analysis.
Another important feature of SPM analysis is the detection of medially located epileptic cortical areas, occasionally missed by visual assessment. Seizures arising from medial (parasagittal) cortical regions can give rise to secondary bilateral synchrony on the ictal scalp electroencephalography (33,34), and it may be challenging to identify such foci for surgical resection. SPM analysis appears to be a particularly useful approach for assessing medially located seizure foci and can contribute to optimal subdural grid coverage. Conversely, the visual detection of lateral hypometabolism, particularly in the left hemisphere (which could be missed by SPM analysis), may be due to mild hypometabolism in these areas that remains below the SPM statistical threshold. These mild hypometabolic regions are accentuated by normal physiologic asymmetry (left < right) in 18F-FDG uptake and are therefore easily detectable by visual assessment. Therefore, visual and SPM analyses appear to be complementary, and together these methods can increase the overall diagnostic performance of 18F-FDG PET for seizure-focus detection.
We found that 18F-FDG PET performed similarly in patients with or without abnormal results on MR images. This finding lends support to the notion that hypometabolic areas are not mere reflections of an underlying lesion. Rather, most hypometabolic regions are located in the lobes of ictal onset, regardless of whether MRI shows a lesion in that area.
The sensitivity of SPM analysis, when calculated against the surgical site, was lower than the sensitivity calculated against the intracranial electrocorticography-defined seizure-onset zone. This result can be expected, because the surgical resection site can include areas beyond the seizure-onset zone to involve areas with frequent interictal spiking and structural lesions, even if they do not show ictal or interictal discharges. These areas are often hypometabolic on 18F-FDG PET images; this may explain the higher PPVs of PET with respect to the resection site.
A limitation in determining the performance of PET against seizure-onset zone based on intracranial electrocorticography is that not all brain regions may have been covered by electrodes in all patients. Similarly, surgical resection might have excluded portions of epileptogenic cortex. However, by calculating the performance parameters of both visual and SPM analyses in children with seizure-free surgical outcome only, we minimized the theoretic possibility of missing seizure onset in uncovered or unresected brain regions, because these areas could be treated as nonepileptogenic with high certainty in these children. The sensitivity and specificity data obtained in the present study cannot be directly interpolated to larger, nonselected pediatric epilepsy populations. However, because of the biased nature of our sample, our results demonstrate that the objective detection of epileptic regions is achievable in children older than 6 y, with a lobar localization value similar to (or sometimes better than) what has been reported in adult epilepsy populations (which, for the most part, were also surgical series (8,10,13–15,22)). Therefore, the results of this study may pave the way for larger prospective PET studies involving less selective pediatric epilepsy populations. This would also allow further analysis of PET performance in different brain regions (lobes), which could not be done in the present study because of the limited sample size.
One of the problems in using any objective, voxel-based comparative analysis in a pediatric population is the lack of an age-matched (i.e., pediatric) control group, as in this study. However, we had previously shown that SPM can reliably detect hypometabolic areas in epileptic children older than 6 y using healthy young adults as a control (21). Subsequently, several other studies successfully used adult controls to perform SPM analysis in a pediatric population with various disorders (30,35–38). Further, the results of the SPM analysis in the present study were generally consistent with the results of visual analysis. Most of the additional findings were corroborated by more careful and closer visual reanalysis of the hypometabolic regions, and most of these regions had ictal electrocorticography correlates on the side of the epileptic focus. Therefore, our results are valid, despite the use of a healthy adult group as a control. Because most other centers also have only adult controls, the findings are indeed highly relevant for the imaging and epilepsy community by demonstrating the usefulness of a young adult control population for such studies.
CONCLUSION
SPM analysis, using a young adult control group, can be applied as a complementary objective analytic method in identifying epileptogenic lobar regions by 18F-FDG PET in children older than 6 y. This approach should be further applied in larger cohorts to determine whether 18F-FDG PET can facilitate surgical treatment in intractable pediatric cases by guiding intracranial electrode placement or surgical resection, particularly in nonlesional cases.
- © 2010 by Society of Nuclear Medicine
REFERENCES
- Received for publication January 22, 2010.
- Accepted for publication September 7, 2010.


Jump to section
Related Articles
Cited By...
- Age-Specific 18F-FDG Image Processing Pipelines and Analysis Are Essential for Individual Mapping of Seizure Foci in Pediatric Patients with Intractable Epilepsy
- Glucose Metabolic Profile by Visual Assessment Combined with Statistical Parametric Mapping Analysis in Pediatric Patients with Epilepsy
- The Role of Radionuclide Imaging in Epilepsy, Part 1: Sporadic Temporal and Extratemporal Lobe Epilepsy
- Clinical Role of Subtraction Ictal SPECT Coregistered to MR Imaging and 18F-FDG PET in Pediatric Epilepsy
- The Role of Radionuclide Imaging in Epilepsy, Part 1: Sporadic Temporal and Extratemporal Lobe Epilepsy