


Abstract
PET with 18F-FDG has been used for presurgical localization of epileptogenic foci; however, in nonsurgical patients, the correlation between cerebral glucose metabolism and clinical severity has not been fully understood. The aim of this study was to evaluate the glucose metabolic profile using 18F-FDG PET/CT imaging in patients with epilepsy. Methods: One hundred pediatric epilepsy patients who underwent 18F-FDG PET/CT, MRI, and electroencephalography examinations were included. Fifteen age-matched controls were also included. 18F-FDG PET images were analyzed by visual assessment combined with statistical parametric mapping (SPM) analysis. The absolute asymmetry index (|AI|) was calculated in patients with regional abnormal glucose metabolism. Results: Visual assessment combined with SPM analysis of 18F-FDG PET images detected more patients with abnormal glucose metabolism than visual assessment only. The |AI| significantly positively correlated with seizure frequency (P < 0.01) but negatively correlated with the time since last seizure (P < 0.01) in patients with abnormal glucose metabolism. The only significant contributing variable to the |AI| was the time since last seizure, in patients both with hypometabolism (P = 0.001) and with hypermetabolism (P = 0.005). For patients with either hypometabolism (P < 0.01) or hypermetabolism (P = 0.209), higher |AI| values were found in those with drug resistance than with seizure remission. In the post-1-y follow-up PET studies, a significant change of |AI| (%) was found in patients with clinical improvement compared with those with persistence or progression (P < 0.01). Conclusion: 18F-FDG PET imaging with visual assessment combined with SPM analysis could provide cerebral glucose metabolic profiles in nonsurgical epilepsy patients. |AI| might be used for evaluation of clinical severity and progress in these patients. Patients with a prolonged period of seizure freedom may have more subtle (or no) metabolic abnormalities on PET. The clinical value of PET might be enhanced by timing the scan closer to clinical seizures.
Epilepsy is considered one of the most common serious neurologic conditions, affecting 65 million people of all ages worldwide (1). Most patients with epilepsy fall into the pediatric group, and approximately 20% of these patients have medically intractable epilepsy (2). So far, electroencephalogram (EEG) evaluation remains the most widely used method in clinical practice to classify the type of seizure in patients with epilepsy; however, the frequency of epileptiform EEG discharges is weakly related to severity of epilepsy (3). For the localization of seizure onset and the identification of the pathologic findings underlying the epileptic brain tissue in drug-resistant epilepsy patients, a structural neuroimaging technology, MRI, has obvious clinical advantages. MRI is effective for identifying intracranial abnormalities commonly associated with chronic focal epilepsy (4). However, not all MRI abnormalities, including hippocampal sclerosis, cavernomas, gliomas, and malformations, cause seizures and not all seizures originate from identified structural cerebral abnormalities. MRI fails to reveal epileptic foci in 20%–30% of temporal lobe epilepsy (TLE) and 20%–40% of extra-TLE patients, despite advancement of functional MRI and MR spectroscopy (5,6).
Recently, interictal PET with 18F-FDG has been used as a powerful neuroimaging technology for presurgical evaluation of epileptogenic foci (7–9) and has demonstrated a sensitivity of 70%–90% in TLE and 33%–67% in extra-TLE patients, depending on the localization of the focus (10–12). The highest clinical benefit of 18F-FDG PET can be achieved in patients with MRI-negative TLE, for whom 18F-FDG PET correctly lateralized the lesion in 80% of the cases (13). However, for the nonsurgical patients, especially for the nonsurgical pediatric children, the clinical diagnostic and prognostic values of 18F-FDG PET remain unclear.
Therefore, we hypothesized that visual assessment combined with statistical parametric mapping (SPM) analysis (or SPM-based visual analysis) of 18F-FDG PET images could be useful for evaluating the correlation between cerebral metabolism and clinical severity or progress in epilepsy patients. The aim of this study was to evaluate the glucose metabolic profile using 18F-FDG PET/CT imaging in patients with nonsurgical epilepsy.
MATERIALS AND METHODS
Subjects
We retrospectively reviewed 142 pediatric epilepsy patients who had undergone 18F-FDG PET, EEG, and MRI examinations to detect epileptogenic areas. The inclusion criteria were as follows: clinical diagnosis of epilepsy (14); age between 7 and 14 y; detailed information of EEG and MRI; the last seizure occurring more than 24 h before 18F-FDG PET study (15); and completion of 12-mo clinical follow-up after 18F-FDG PET imaging. Patients were excluded if they had no data from one of the modalities (EEG, MRI, or PET). Other exclusion criteria consisted of medical illness with central nervous system impact other than epilepsy, for example, head trauma, encephalitis, tumor, infarct, or porencephaly, because these obvious lesions preclude the normalization of 18F-FDG PET images into standard template in SPM analysis. According to the type and number of seizures experienced in the 12 mo, epilepsy patients were divided into the severe, moderate, or mild groups (16). Patients who had more than 20 seizures per year were classified as “severe,” and those without seizures in the past 12 mo were considered as “mild.” At the end of the clinical follow-up, patients were considered to be in remission if they had no seizures during the past 12 mo or considered drug-resistant if they failed to achieve sustained seizure freedom despite adequate antiepileptic drugs (AEDs) (17,18). One hundred epilepsy patients (46 girls and 54 boys; mean age ± SD, 10.4 ± 2.0 y) were included in this study. At the time of the PET scan, 49 patients received 1 type of AED, 29 patients received 2 AEDs, and 8 patients required treatment with 3 or more AEDs. The most frequently used AED was oxcarbazepine (n = 55), followed by levetiracetam (n = 22), topiramate (n = 21), valproate (n = 19), lamotrigine (n = 10), clonazepam (n = 4), and carbamazepine (n = 1). All patients underwent at least 1 prolonged (24 h) EEG monitoring to confirm the localization of the epileptic foci. Long-term video EEG was performed in the evaluation of 23 patients who presented difficulties in localization after clinical assessment, prolonged EEG, and MRI. Fifteen nonepilepsy patients (9 girls and 6 boys; mean age, 11.1 ± 3.1 y) who had no history of neurologic disorders, psychiatric illnesses, chemotherapy, or radiotherapy were included as the age-matched control subjects for SPM analysis. This age-matched control group consisted of 6 patients with extracranial lymphoma and 9 with bone neoplasm. The institutional review board approved this retrospective study, and the requirement to obtain informed consent was waived (ChiCTR-ORC-16009167).
PET Image Analysis
PET/CT brain images were acquired on a PET/CT scanner (Biograph mCT; Siemens Medical Solutions) at 40 min after intravenous injection of 18F-FDG (3.7 MBq/kg) (19,20). PET and MR images were coregistered using the vender-provided Fusion Registration Software implemented in the syngo MultiModality Workplace (Siemens Medical Solutions).
Visual Assessment
18F-FDG PET images were visually evaluated by 2 nuclear medicine specialists who were unaware of the findings of EEG and MRI. The glucose metabolic patterns (hypometabolism, hypermetabolism, or normal metabolism) of 16 major brain regions (8 in each hemisphere, corresponding to lateral and medial surfaces of the 4 lobes [frontal, temporal, parietal, occipital]) were evaluated and reported separately. Discordant results were reviewed by both experts to reach a consensus.
SPM Analysis
Static 18F-FDG PET image volumes were analyzed using the SPM8 software package developed at the Wellcome Department of Cognitive Neurology, Institute of Neurology (21). 18F-FDG PET image volumes were spatially normalized into standard stereotactic space using an in-house pediatric PET template. A gaussian kernel of 16 mm in full width at half maximum was used to smooth the data for statistical analysis. Individual SPM analysis was performed using an age-matched control group. Increased or decreased metabolism was regarded as statistically significant if the uncorrected P value was under 0.001, with a cluster level above 100 voxels.
Visual Assessment Combined with SPM Analysis
Visual assessment combined with SPM analysis was performed for reanalysis of all the PET images. A further semiquantitative analysis, absolute asymmetry index (|AI|), was performed to evaluate the intensity of the metabolic abnormality in brain regions established using this combined assessment. In patients with more than 1 cortical area showing hypo- or hypermetabolism, the region with the most severe abnormality was selected for the calculation of |AI|. According to a previous study (22), data were collected as nCi/cm3 tissue for each region of interest with a 48 mm2 circle in the original PET scans, and |AI| was calculated using the following formula: |AI| = |(left − right)/([left + right]/2)|.
Statistical Analysis
Values are reported as mean ± SD. All data were analyzed by the SPSS software (version 20.0; IBM SPSS Statistics). Comparison of sex was performed using the χ2 test and concordance between visual assessment and SPM analysis using the κ test. The 2-sample t test was used to compare age and age of onset. Comparisons of seizure severity, seizure frequency, duration of epilepsy, number of AEDs, and time since last seizure were performed using the Mann–Whitney test. Comparisons of |AI| among groups were performed using either the Mann–Whitney test or the Kruskal–Wallis test, and followed by a post hoc test when appropriate. Analysis of correlation was performed using Spearman correlation coefficients. Stepwise multivariate linear regression analysis was conducted to determine the independent contribution of individual variables (age, age of onset, duration of epilepsy, seizure frequency, time since last seizure, and number of AEDs) to the |AI|. A P value of less than 0.05 (P < 0.05) was considered statistically significant.
RESULTS
After careful retrospective reviewing of EEG, MRI, and PET results and clinical follow-up, a total of 100 patients were included in this study. Epileptiform activity was noted on the EEG of 86 patients (86%), with 76 (76%) showing focal epileptiform abnormalities. Slowing was noted on the EEG in only 5 patients, 2 of whom were focal and 3 generalized. The EEG and 18F-FDG PET results were both abnormal in 75 patients (75%) and both normal in 5 (5%) (Table 1). The EEG results were significantly associated with PET findings (κ = 0.237, P = 0.008). In contrast, the EEG and MRI results were both abnormal in 37 patients (37%) and both normal in 7 (7%). The association between EEG and MRI findings was not significant (κ = 0.051, P = 0.279).
Comparisons of EEG, 18F-FDG PET, and MRI Findings in Pediatric Epilepsy Patients (n = 100)
Visual Assessment and SPM Analysis of 18F-FDG PET Images
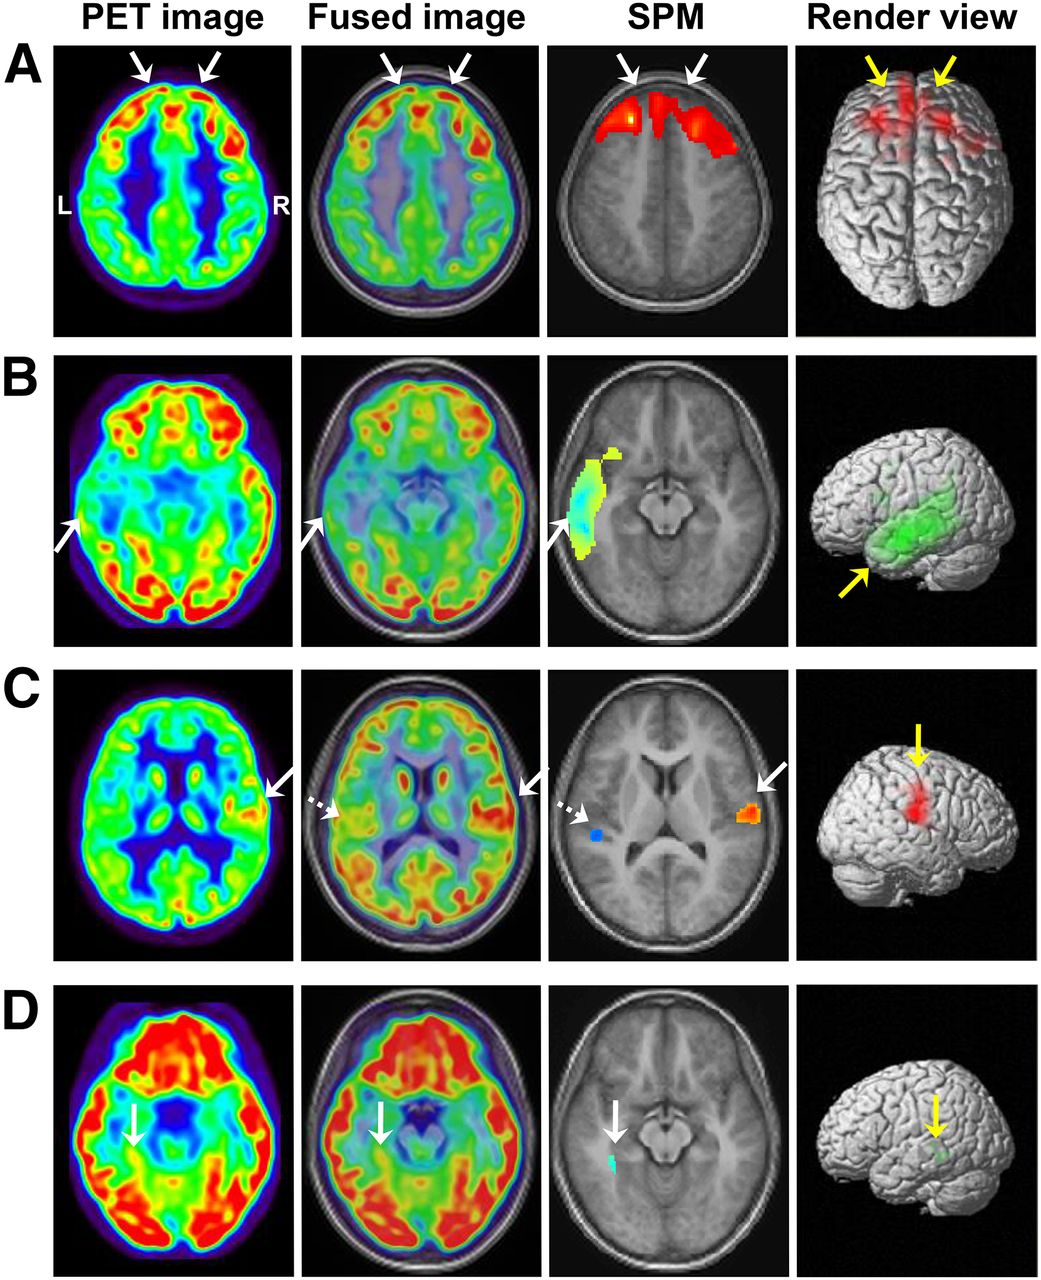
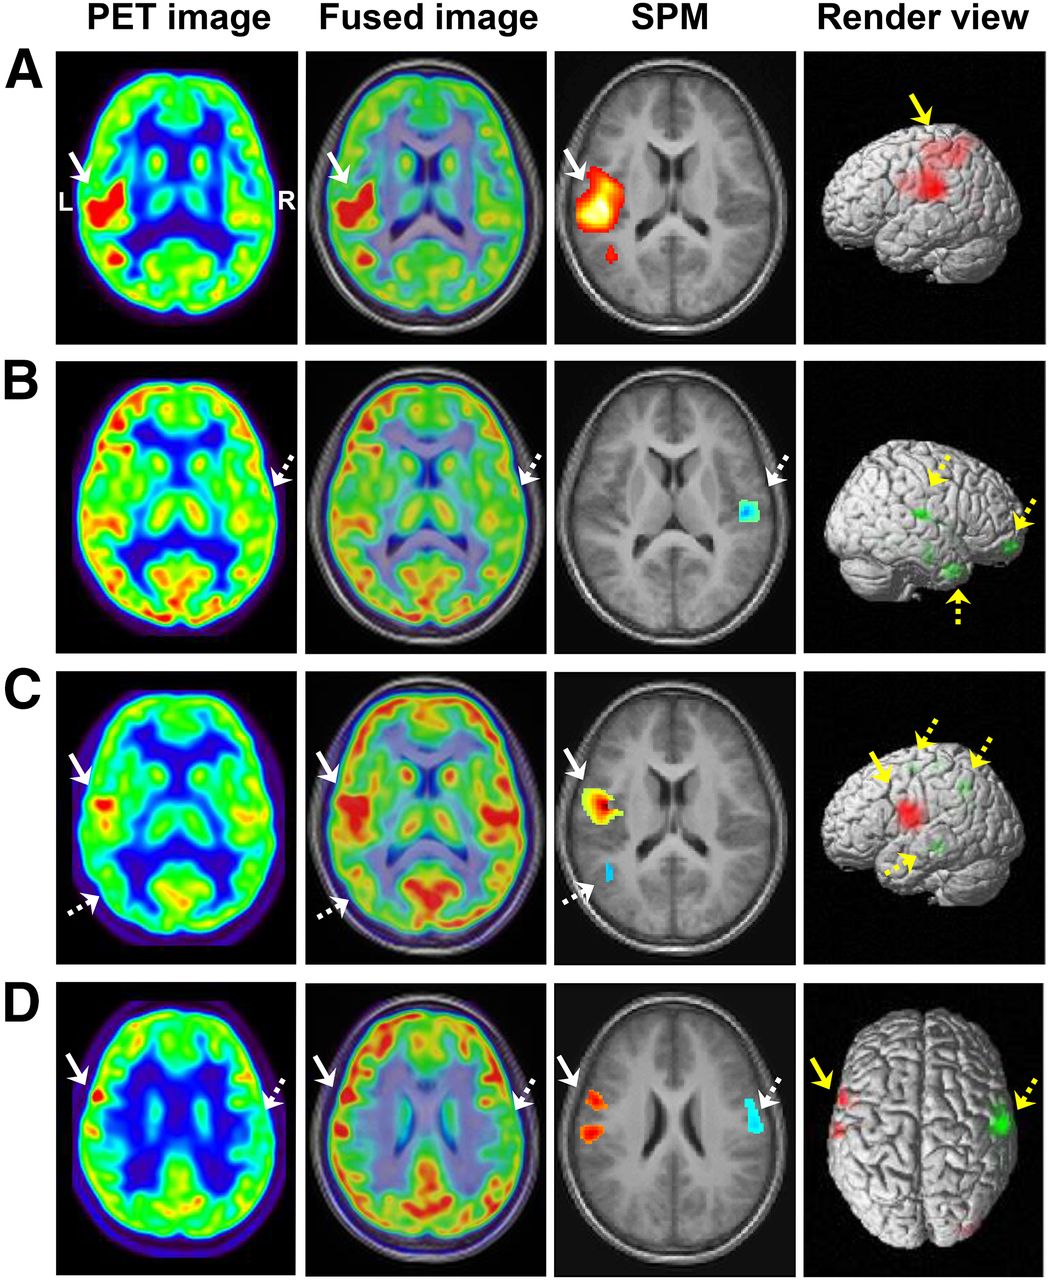
Abnormal cerebral metabolism was observed by visual assessment in 70 patients (70%), including 63 with hypometabolism and 7 with hypermetabolism (Table 2). SPM analysis identified abnormal metabolism in 71 patients (71%), including 47 with hypometabolism and 24 with hypermetabolism. Among the 24 hypermetabolic patients, hypermetabolism associated with hypometabolism was detected in 14 patients using SPM analysis; however, primary visual assessment demonstrated only hypometabolic regions in these patients. A concordant result between the visual and SPM analyses was obtained in 69 patients (κ = 0.483, P < 0.001). Representative images were shown in Figure 1.
Comparison between Visual Assessment and SPM Analysis of 18F-FDG PET Studies in Pediatric Epilepsy Patients (n = 100)

Comparison between visual and SPM analysis of 18F-FDG PET images. (A) Hypermetabolism in bilateral frontal lobes (solid arrow) was detected by both visual and SPM analysis. (B) Hypometabolism in left temporal lobe (solid arrow) was detected by both visual and SPM analysis. (C) Hypometabolism was found in left rolandic area (dashed arrow) by visual assessment, and hypermetabolic region was further identified in right rolandic area (solid arrow) by SPM analysis. (D) Hypometabolic region undetected by visual assessment was identified in left mesial temporal lobe (solid arrow) by SPM analysis.
Correlation Between Clinical Characteristics and Glucose Metabolism
The analysis of correlation between clinical characteristics and glucose metabolism was based on the combined visual and SPM analysis. Patients with abnormal glucose metabolism had a significantly shorter time period since last seizure (P < 0.05) and a greater severity of epilepsy (P < 0.05) and seizure frequency (P < 0.05) than those with normal metabolism (Table 3). No significant differences were found in sex, age, age of onset, duration of disease, or number of AEDs (P = 0.745, 0.293, 0.149, 0.713, and 0.127, respectively) between patients with normal and abnormal glucose metabolism. Metabolic abnormalities were detected in 25 (71.4%) of 35 patients with idiopathic epilepsy, in 35 (77.8%) of 45 patients with cryptogenic epilepsy, and in 19 (95.0%) of 20 patients with symptomatic epilepsy. No significant difference of abnormal metabolism rate was found among these 3 types of epilepsy (Fisher exact test, P = 0.109).
Clinical Characteristics and 18F-FDG PET Findings in Pediatric Epilepsy Patients (n = 100)
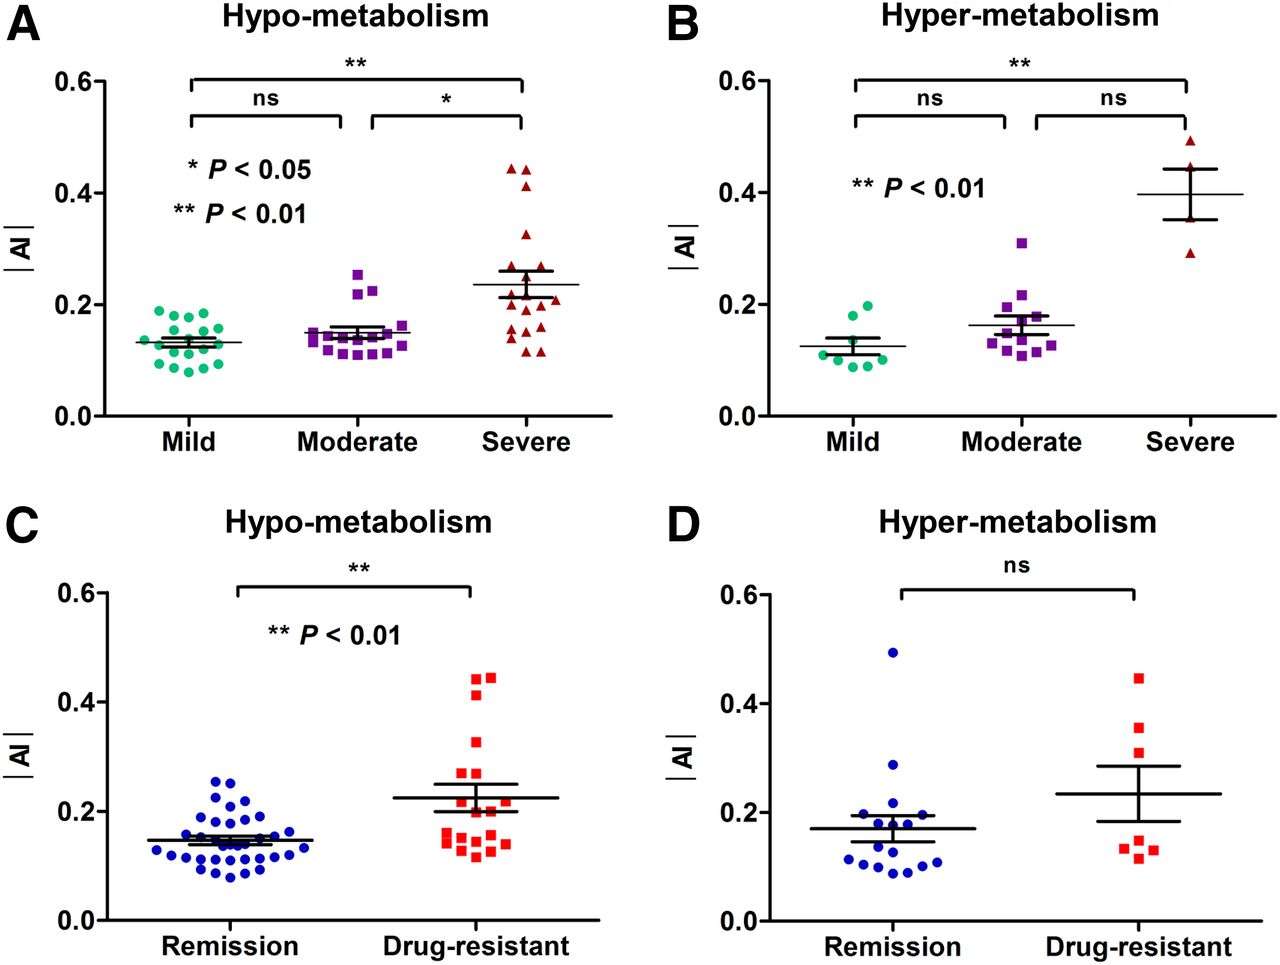
Among patients with hypometabolism, the severe group had greater |AI| than the mild and moderate groups (P < 0.01 and <0.05, respectively; Fig. 2A). In patients with hypermetabolism, the severe group had greater |AI| than the mild group (P < 0.01; Fig. 2B) and slightly greater than the moderate group (P = 0.051). As shown in Table 4, the |AI| was significantly positively correlated with seizure frequency (rs = 0.516, P < 0.001 and rs = 0.653, P = 0.001, respectively) but negatively correlated with the time since last seizure in patients with hypometabolism (rs = −0.477, P < 0.001) and hypermetabolism (rs = −0.621, P = 0.001). For patients with either hypometabolism (P < 0.01) or hypermetabolism (P < 0.05), a significantly lower value of |AI| was found in patients with more than 1 year of time since last seizure than in those with a much shorter period since the last seizure (Supplemental Fig. 1; supplemental materials are available at http://jnm.snmjournals.org).

Clinical value of 18F-FDG PET in severity and outcome of pediatric epilepsy. (A) In patients with hypometabolism (n = 55), severe group had higher value of |AI| than mild and moderate groups (P = 0.001 and 0.030, respectively). (B) In patients with hypermetabolism (n = 24), severe group had higher value of |AI| than mild group (P = 0.002) and slightly higher value than moderate group (P = 0.051). (C) On the basis of follow-up, in patients with hypometabolism, drug-resistant patients had higher values of |AI| than seizure-free patients (P = 0.002). (D) In patients with hypermetabolism, drug-resistant patients had slightly higher values of |AI| than seizure-free patients (P = 0.209).
Correlation Between |AI| and Clinical Severity in Pediatric Epilepsy Patients with Abnormal Glucose Metabolism (n = 79)
Stepwise multivariate linear regression analysis was performed to determine the independent contribution of individual variables (age, age of onset, duration of epilepsy, seizure frequency, time since last seizure, and number of AEDs) to the |AI|. The only significant contributing variable was the time since last seizure, in patients both with hypometabolism (β = −0.03; SEM = 0.01; P = 0.001) and with hypermetabolism (β = −0.05; SEM = 0.01; P = 0.005).
Metabolic Features of Temporal Lobe Epilepsy (TLE) and Rolandic Epilepsy
On the basis of the clinical manifestations, EEG, MRI, and PET findings, 28 of 100 patients were found with TLE, 29 with rolandic epilepsy, 10 with frontal lobe epilepsy, and 4 with occipital lobe epilepsy.
Of the 28 patients with TLE, 26 patients (92.9%) showed hypometabolism, 1 patient (3.6%) had hypermetabolism in the unilateral temporal lobe, and 1 patient (3.6%) showed an absence of any abnormal cerebral metabolism. Among the 26 patients with hypometabolism, the |AI| was significantly positively correlated with seizure frequency (rs = 0.707, P < 0.001) and negatively correlated with the time since last seizure (rs = −0.481, P < 0.05).
Among the 29 patients with rolandic epilepsy, 4 metabolic patterns were found: hypermetabolism only (n = 6), hypermetabolism associated with hypometabolism (n = 12), hypometabolism only (n = 5), and absence of metabolic abnormality (n = 6). Representative images are demonstrated in Figure 3. Of 18 patients with hypermetabolism, the intensity was significantly positively correlated with seizure frequency (rs = 0.597, P < 0.01) but negatively correlated with the time since last seizure (rs = −0.569, P < 0.05). Twenty RE patients were reported as nonlesional on MRI studies. Among the other 9 patients with abnormal MRI results, 4 patients were found with hippocampal abnormality, 2 patients with arachnoid cysts, 1 patient with an enlarged temporal horn, 1 patient with demyelination, and 1 patient with cortical dysplasia.

Metabolic features of rolandic epilepsy. (A) Hypermetabolism was found in left rolandic area (solid arrow). (B) Hypometabolic regions were found in right frontal and temporal lobes and rolandic areas (dashed arrow). (C) Hypermetabolism (solid arrow) with associated surrounding hypometabolism (dashed arrow) was observed in left rolandic area. (D) Hypermetabolism and its associated remote hypometabolism were found in left (solid arrow) and right (dashed arrow) rolandic areas, respectively.
Coregistration of PET and MR Images
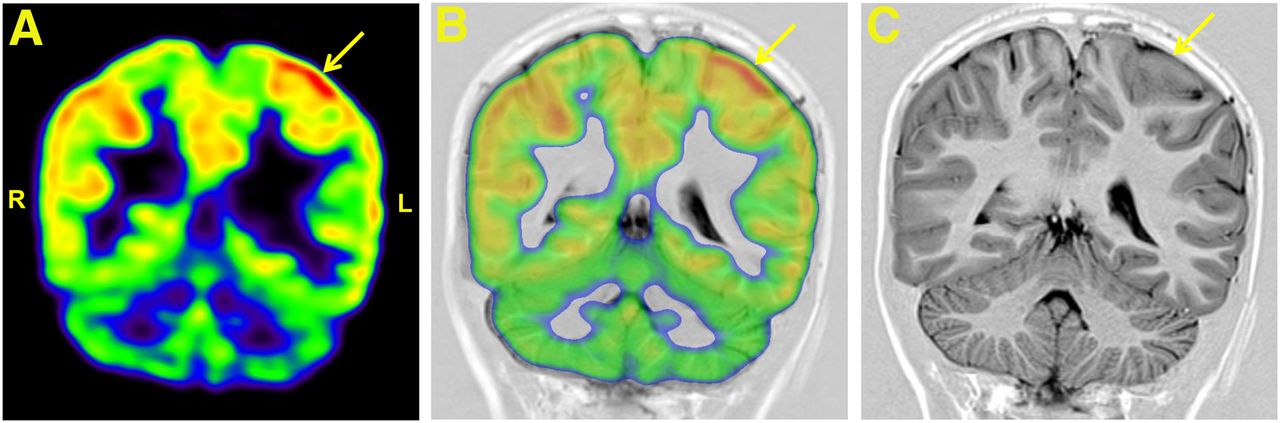
As shown in Table 1, in 39 children MRI results were abnormal, including hippocampal atrophy (n = 10), hippocampal sclerosis (n = 5), T2-weighted image signal abnormalities of hippocampus (n = 4), cortical dysplasia (n = 7), arachnoid cyst (n = 5), demyelination (n = 3), heterotopias (n = 1), focal cortical atrophy (n = 1), polymicrogyria (n = 1), and enlarged temporal horn (n = 2). Among the other 61 patients with normal MRI findings, however, after the coregistration of PET and MR images the guided second reading changed the MRI report to “subtle lesion” in 7 patients. The representative images of a 14-y-old patient are shown in Figure 4.

Interictal 18F-FDG PET and MRI studies of 14-y-old girl who experienced 6 times of right hemifacial contraction with drooling during a 4-mo time. 18F-FDG PET image (A) and PET/MR image (B) coregistration guided second reading of MR images, in which previously missed cortical thickening in the left parietal lobe (solid arrow) on T1-weighted image (C) was detected.
Visual Assessment Combined with SPM Analysis and Clinical Management
When visual assessment combined with SPM analysis was used, 79 patients (79%) were found with abnormal metabolism, including 55 with hypometabolism and 24 with hypermetabolism (Table 4).
In patients with either hypometabolism (P < 0.01; Fig. 2C) or hypermetabolism (P = 0.209; Fig. 2D), higher values of |AI| were found in drug-resistant patients than in those with seizure remission. Higher values of |AI| were found in patients with add-on therapy than in those with unchanged therapy or withdrawal (both P < 0.01; Fig. 5A), and slightly higher values of |AI| were observed in patients who showed persistence/progression than in those who showed improvement (P = 0.051; Fig. 5B).
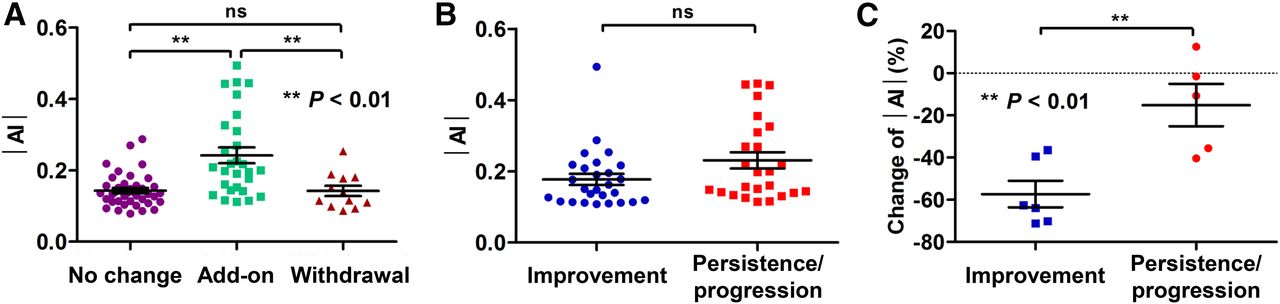
Diagnostic value of 18F-FDG PET imaging during clinical course of pediatric epilepsy. (A) Patients with add-on therapy after 18F-FDG PET study had higher values of |AI| than those with unchanged therapy or withdrawal (P = 0.006 and <0.001, respectively), but no significant difference in |AI| was found between patients with unchanged therapy and those at withdrawal (P = 1.0). (B) Improvement course was defined as remaining seizure-free throughout follow-up of patients in moderate or severe groups; and persistence or progression course was defined as being drug-resistant throughout follow-up. Patients with persistence or progression course had slightly higher values of |AI| than those with improvement (P = 0.051). (C) Of 11 patients who also underwent post-1-y follow-up PET scans, significant change of |AI| (%) was found in patients with clinical improvement compared than with persistence or progression (P = 0.005). n.s. = not significant.
There were 11 patients who underwent the post-1-y follow-up PET studies. A significant change of |AI| (%) was found in patients with improvement compared with those with persistence or progression (P < 0.01; Fig. 5C).
DISCUSSION
We retrospectively evaluated the results of 18F-FDG PET, MRI, and EEG in 100 nonsurgical epilepsy patients. We found that the visual assessment combined with SPM analysis could be an effective approach for identifying abnormal cerebral metabolic changes. Increased or decreased values of |AI| on 18F-FDG PET images could be applied as an imaging biomarker for clinical evaluation of nonsurgical epilepsy. Patients with a prolonged period of seizure freedom may have more subtle (or no) metabolic abnormalities on PET. The shorter interval since the last seizure, the more patients with metabolic abnormality could be detected by 18F-FDG PET imaging. To the best of our knowledge, this is the first visual assessment combined with SPM analysis of 18F-FDG PET study to evaluate the severity and clinical management in nonsurgical pediatric epilepsy patients.
The key to successful epilepsy control is defining epileptogenic foci, whether it is an apparent anatomic focus or a more functional one, such as nonlesional epilepsy. However, the visual assessment of 18F-FDG PET images in the clinical application is subjective and relies on the experience and knowledge of the readers (23). Therefore, it is inevitable that the interpretation of a single image by visual assessment is variable among different observers, and subtle metabolic abnormalities of epilepsy might not be identified easily. In our study, visual assessment combined with SPM analysis of 18F-FDG PET images identified more patients with abnormalities than visual assessment or SPM alone. Even for the nonlesional report on MRI, after coregistration of 18F-FDG PET and MR images, the guided second reading could detect subtle pathologic abnormalities in 7 patients. Similarly, another group has reported that in children with MRI-negative epilepsy, coregistered 18F-FDG PET and MR images with SPM could detect subtle MRI abnormalities that were not previously recognized in 9 out 31 patients (24). Taken their and our results together, visual assessment combined with SPM analysis of coregistered 18F-FDG PET and MR images could be an objective and effective method to identify subtle metabolic abnormalities corresponding to seizure foci.
Interictal hypometabolism was one of the first clinical findings during the development of PET, and in the past years, it has been noted to have predictive value independent of EEG and MRI (25). However, the exact mechanism underlying hypometabolism is not entirely understood. In our nonsurgical pediatric population, we found that 92.9% of TLE patients showed hypometabolism, 3.6% had hypermetabolism in the unilateral temporal lobe, and 3.6% showed an absence of any abnormal cerebral metabolism. A previous study has demonstrated that, despite the normal appearance of the MRI of the brain, about 40% of patients exhibit hypometabolism as measured by 18F-FDG PET at the onset of cryptogenic TLE (26). The extent of cortical glucose hypometabolism can undergo dynamic changes, which is partly related to the frequency of seizures (27). Interestingly, hypermetabolism could be detected in the acute phase of epileptic syndrome, with continuous spikes and waves during slow sleep, but disappeared in the recovery phase (28). Transient hypermetabolism was observed in 9 of 60 patients with Sturge–Weber syndrome, which was considered to reflect a period of epileptogenesis (29). In an autoradiography study, 14C-FDG uptake was related to the general intensity of synaptic activity rather than the nature of excitation or inhibition (30). Therefore, either strong excitations or strong inhibitions had the potential to increase cerebral metabolism.
So far, the correlation between the regional asymmetry of 18F-FDG distribution and clinical severity has not been studied in patients with hypermetabolism. In the previous studies, the value of |AI| higher than 0.1 or 0.15 in at least one cortical region other than the cerebellum was considered abnormal (22,27,31). In our study, most patients in the mild and moderate groups had |AI| values lower than 0.2. The severe group had higher values of |AI| than the mild and moderate groups, and the |AI| was positively correlated with seizure frequency in patients with hyper- or hypometabolism. Although hypermetabolism is frequently observed during the ictal state of epilepsy (32,33), it can also be observed in the absence of ictal events during tracer uptake and correlates well with regions of high spike count, suggesting a state of increased epileptogenicity (33,34). In view of the abundant sample size of patients with interictal hypermetabolism, we assume that the |AI| value on 18F-FDG PET images in patients with hypermetabolism could be affected by the clinical severity and seizure frequency. Previous studies demonstrated that increased seizure frequency and severity were related to greater hypometabolism on 18F-FDG PET images, in both adult and pediatric patients (22,26). Therefore, hypometabolism could be reversible as the seizures come under control (27,35) but worsened by continuing epileptic activity (26). In addition, because the patients showing drug resistance had significant metabolic abnormalities (especially hypometabolism) compared with those showing remission, 18F-FDG PET might provide valuable follow-up information for pediatric patients with epilepsy.
Most importantly, on the basis of the results of multivariate regression analysis, we found that the timing of the last clinical seizure (rather than seizure frequency) might primarily drive the severity of metabolic asymmetries. This finding indicated that the localizing value of 18F-FDG PET may diminish in patients with prolonged seizure freedom, and on the other hand, the clinical value of PET might be enhanced by timing the scan closer to clinical seizures. Most of our patients who underwent 18F-FDG PET study within less than a month since last seizure were found to have abnormal glucose metabolism. Therefore, we recommend that the optimal timing of interictal 18F-FDG PET scanning might be from 1 d to 1 mo after the last seizure.
There were several limitations to the current study. First, because this is a retrospective study, the selection bias due to specific referral patterns cannot be avoided entirely. Second, no pathologic confirmation or invasive EEG recordings were available as the gold standard to study the correlation between abnormal metabolism and epileptogenic pathology. This is inherent to our selection criteria, because nonsurgical patients are unwilling to undergo invasive procedures for obvious medical and ethical reasons. Third, EEG recording was performed 1 d before 18F-FDG PET scanning; however, because of the retrospective feature of this study, simultaneous EEG was not performed. Fourth, we used coregistered PET/MR images, which requires repositioning of the patient and might fail to eliminate significant changes in physiologic and pathologic condition during the 2 data acquisitions. Currently, 18F-FDG PET and MR image coregistration has been recommended in the routine presurgical evaluation of epilepsy, especially in patients without lesions on MRI (36) Ideally, simultaneous imaging of PET and MR might yield benefits with regard to patient management and time saving (37). Despite these limitations, the population in this retrospective study was large enough to investigate the correlation between cerebral metabolism and severity of pediatric epilepsy, and might pave the way for a further prospective study.
CONCLUSION
Coregistration of 18F-FDG PET/MR images with visual assessment combined with SPM analysis could provide cerebral glucose metabolic profiles in nonsurgical epilepsy patients. |AI| might be used for the evaluation of clinical severity and progress in these patients. Patients with a prolonged period of seizure freedom may have more subtle (or no) metabolic abnormalities on PET. The clinical value of PET might be enhanced by timing the scan closer to clinical seizures.
DISCLOSURE
This work is partly sponsored by grants from the National Key Research and Development Program of China (2016YFA0100900), National Key Basic Research Program of China (2013CB329506), National Science Foundation of China (NSFC) (no. 81425015, 81271601), and Zhejiang Provincial Natural Science Foundation of China (LR13H180001). No other potential conflict of interest relevant to this article was reported.
Footnotes
Published online Jan. 19, 2017.
- © 2017 by the Society of Nuclear Medicine and Molecular Imaging.
REFERENCES
- Received for publication November 18, 2016.
- Accepted for publication December 15, 2016.


