


Abstract
Incorporation coefficients (K*) of arachidonic acid (AA) in the brain are increased in a rat model of neuroinflammation, as are other markers of AA metabolism. Data also indicate that neuroinflammation contributes to Alzheimer's disease (AD). On the basis of these observations, K* for AA was hypothesized to be elevated in patients with AD. Methods: A total of 8 patients with AD with an average (±SD) Mini-Mental State Examination score of 14.7 ± 8.4 (mean age, 71.7 ± 11.2 y) and 9 controls with a normal Mini-Mental State Examination score (mean age, 68.7 ± 5.6 y) were studied. Each subject received a 15O-water PET scan of regional cerebral blood flow, followed after 15 min by a 1-11C-AA scan of regional K* for AA. Results: In the patients with AD, compared with control subjects, global gray matter K* for AA (corrected or uncorrected for the partial-volume error [PVE]) was significantly elevated, whereas only PVE-uncorrected global cerebral blood flow was reduced significantly (P < 0.05). A false-discovery-rate procedure indicated that PVE-corrected K* for AA was increased in 78 of 90 identified hemispheric gray matter regions. PVE-corrected regional cerebral blood flow, although decreased in 12 regions at P < 0.01 by an unpaired t test, did not survive the false-discovery-rate procedure. The surviving K* increments were widespread in the neocortex but were absent in caudate, pallidum, and thalamic regions. Conclusion: These preliminary results show that K* for AA is widely elevated in the AD brain, particularly in regions reported to have high densities of senile (neuritic) plaques with activated microglia. To the extent that the elevations represent upregulated AA metabolism associated with neuroinflammation, PET with 1-11C-AA could be used to examine neuroinflammation in patients with AD and other brain diseases.
The postmortem Alzheimer's disease (AD) brain is characterized by intracellular neurofibrillary tangles with paired helical filaments consisting of phosphorylated τ-protein and extracellular senile (neuritic) plaques containing β-amyloid fibrils. The senile plaques often are infiltrated by activated microglia that secrete inflammatory cytokines, release nitric oxide, and express peripheral benzodiazepine receptors (1–4).
Inflammatory cytokines released from the microglia can bind to astrocytic cytokine receptors that are coupled to the Ca2+-dependent enzymes, cytosolic phospholipase A2 (cPLA2), and secretory phospholipase (sPLA2) (5). Each of these enzymes, when activated, hydrolyzes esterified arachidonic acid (AA) (20:4n-6) from membrane phospholipids. The released nitric oxide also can promote AA hydrolysis from the membrane by cPLA2, by stimulating glutamate release from nerve terminals and thereby increasing intracellular Ca2+ concentrations via postsynaptic ionotropic N-methyl-d-aspartate and other glutamatergic receptors (6–8). β-amyloid peptide in the AD brain also can provoke glutamate-induced excitotoxicity and PLA2 activation (9,10). Consistent with this scenario, the AD brain demonstrates increased cytokine levels (3), increased expression of both cPLA2 and sPLA2, increased concentrations of inflammatory metabolites of AA (5,11,12), and increased glutamatergic markers and different forms of accumulated β-amyloid (9,10,13). Additionally, concentrations of isoprostane and isoflurane metabolites of AA are elevated in cerebrospinal fluid (CSF) from patients with AD (14).
In view of these observations, AA metabolism is likely elevated in the AD brain; having a method to image this metabolism might help in examining neuroinflammation in the course and therapy of AD. We have developed such a method. It involves injecting radiolabeled AA intravenously and then determining regional brain AA incorporation coefficients (K*; brain radioactivity normalized to integrated plasma radioactivity) using quantitative autoradiography in unanesthetized rodents or PET in nonhuman primates or humans. K* for AA represents metabolic loss of AA in the brain; once lost by metabolism, AA cannot be synthesized de novo nor can it be converted from its precursor, linoleic acid (18:2n-6) (15). K* for AA is unaffected by changes in regional cerebral blood flow (rCBF), which makes radiolabeled AA an ideal tracer for independently imaging brain AA metabolism (16–19).
We used the method described above to demonstrate an increased K* for AA in wide areas of the brain in unanesthetized rats in which bacterial lipopolysaccharide had been infused into the cerebral ventricles for 6 d, a model of chronic neuroinflammation. The elevations were accompanied by increased brain expression of cPLA2, increased turnover rates of AA in brain membrane phospholipids, increased formation of AA-derived eicosanoids such as prostaglandin E2, and formation of activated microglia after a longer infusion time (20–23). Furthermore, the increments in K* after lipopolysaccharide infusion could be reduced by chronic pretreatment with lithium, which is reported to downregulate each of these markers of brain AA metabolism in control rats (24).
In this article, the fatty acid method with PET and intravenous 1-11C-AA was used to image K* for AA, as a marker of neuroinflammation, in diagnosed patients with AD and age-matched healthy controls. Methods for making measurements and calculations are reported elsewhere in detail (17–19,25). PET and intravenous 15O-water also were used to image rCBF as a marker of brain functional activity in the same subjects (26) and to coregister AA scans to anatomic MRI scans for regional data analysis and for partial-volume error (PVE) correction.
MATERIALS AND METHODS
Subject Selection
The protocol was approved by the Institutional Review Board of the National Institute of Neurological Disorders and Stroke and by the Radiation Safety Committee of the National Institutes of Health. Eight otherwise healthy male patients with AD (mean age ± SD, 71.1 ± 11.2 y; range, 51–87 y) who met research criteria for AD and were mainly mildly to moderately (1 severely) demented on the Mini-Mental State Examination (mean score, 14.7 ± 8.4; range, 4–27) (27) were studied. In addition, 9 healthy age-matched male controls (mean age, 68.7 ± 5.6; range, 60–76 y; mean Mini-Mental State Examination score, 30) were studied. Exclusion criteria included a history of head trauma, hypertension or other cardiovascular disorder, diabetes, alcoholism, psychiatric or neurologic disorder, or malignancy. AD and control subjects were normotensive and off centrally acting medication for at least 2 wk, aspirin for at least 2 d, and caffeine and alcohol for at least 12 h before the procedure.
PET Procedure
1-11C-AA was synthesized as reported (17,28). The tracer was 97.6% pure on high-performance liquid chromatography, and its specific activity exceeded 3,700 MBq (100 mCi)/μmol.
Indwelling radial vein and artery catheters were inserted before scanning, and the subject's head was secured in a thermoplastic face mask fixed to the scanner bed. Scanning was performed with an Advance Tomograph (GE Healthcare), which acquires 35 simultaneous slices with 4.25-mm separation and has in-plane and axial resolutions of 6–7 mm. Scans were performed parallel to the orbitomeatal line and were conducted in a quiet, dimly lit room, with the subject's eyes open and ears unoccluded.
After a transmission scan had been performed for attenuation correction, 370 MBq (10 mCi) of 15O-water was injected as an intravenous bolus to measure rCBF. A 60-s scan was performed in the 3-dimensional mode after the bolus had reached the brain, and rCBF images were produced using the measured arterial input function (26). To quantify regional values of K* for AA and regional blood volumes, Vb, 15 min after the 15O-water injection, 920 ± 115 MBq (24.9 ± 3.1 mCi) of 1-11C-AA was infused intravenously for 3 min at a constant rate. Serial dynamic 3-dimensional scans (30 s to 5 min) were performed for 1 h. Radial artery blood (1–3 mL) was sampled at fixed times, and radioactivity in whole blood and plasma was measured with a γ-counter. Details of the procedures have been published (18,19).
Motion Correction
Subject motion during the 60-min acquisition period was corrected with a mutual information registration of each time frame to a standard frame before attenuation correction. On the basis of calculated motion, the transmission images were resliced and projected for final attenuation correction, reconstruction, and realignment.
Plasma Time–Activity Curves
Whole-blood and plasma radioactivities were determined as a function of time after injecting 1-11C-AA. In 7 of the 9 controls, a rapid extraction procedure (18,29) was used to determine radioactivity due to 1-11C-AA and 1-11C-CO2. In all the patients with AD and in 2 of the controls, fractional metabolite measurements were not performed with this procedure. To analyze all PET scans together, therefore, the fractional data (1-11C-AA and 1-11C-CO2) from the 7 controls having appropriate input function data were averaged to obtain mean fractional curves, which then were used to process individual radioactivity curves in each patient with AD. The curves were multiplied by the group average fractional curve to produce time–activity curves of 1-11C-AA and 1-11C-CO2 in these patients and in the 2 remaining controls. To assess the effect of using average curves, data from the 7 controls also were analyzed with the averaged metabolite curves. t tests showed that the results were not significantly affected by this procedure. To have a consistent statistical analysis, we therefore report data on all subjects processed with the averaged metabolite curves.
Modeling
On a pixel-by-pixel basis, reconstructed images were analyzed using the following equation to produce parametric images of K* for AA (incorporation coefficient of plasma AA into brain tissue, μL/min/cm3 of brain) and of Vb (cerebral blood volume, [mL of blood]/[cm3 of brain]), Eq. 1Ci(t), Cb(t), and Cp(t) are pixel, whole-blood, and plasma 1-11C-AA time–activity curves, respectively; CCO2(t) is the predicted brain tissue concentration of 11C-CO2; and Δt is the delay between the brain and blood curves. The predicted tissue 11C-CO2 concentration was computed by measuring for each subject the plasma 11C-CO2 concentration and applying a 1-tissue-compartment model with published values of the gray matter influx rate constant (K1) and the distribution volume for CO2 (30). Calculations were applied to the original radioactivity images and to images that had been corrected for the PVE (18,31).
Registration to MR Images
For each subject, K* images derived from the original PET volumes after 1-11C-AA injection were registered to the CBF volume to correct for motion between the 1-11C-AA and 15O-water scans, using a 6-parameter transformation and a mutual information cost function (19,32). CBF and MRI volumes then were coregistered using the same algorithm. Images of K* for AA were transformed to MRI space using the product of the 2 transformation matrices.
PVE Correction
Brain radioactivity, corrected for the PVE, was calculated with a 3-compartment (gray matter, white matter, and CSF) MRI-based approach (19,33). Binary mask images for gray matter (mGM), white matter (mWM), and CSF (mCSF) first were produced using an adaptive fuzzy c-mean segmentation. The gray and white matter masks then were smoothed, based on a 3-dimensional gaussian kernel of 6-mm full width at half maximum that corresponded to the resolution of the scanner, to account for radioactivity spill-out and spill-in effects between gray and white matter and for spill-out of gray matter activity into CSF. White matter radioactivity was assumed uniform, and CSF radioactivity was set at zero. For each voxel, the PVE-corrected radioactivity was calculated as: Eq. 2where C3S is PVE-corrected gray matter radioactivity, C is measured PET radioactivity, CWM is estimated white matter radioactivity, and sGM and sWM are smoothed masks for gray and white matter, respectively. Cwm was calculated by an extrapolation method (19). For each frame, PET activity values of pixels with swm values greater than 0.99 were identified and then fitted as a linear function of swm. The fitted value at swm = 1 was used as Cwm.
Image Processing for Statistical Analysis
Individual rCBF images were aligned without smoothing to a stereotactic PET template using Statistical Parametric Mapping-2 software (http://www.fil.ion.ucl.ac.uk/spm/software) (19,34). The transformation information obtained by alignment was used to resample the K* images from the 1-11C-AA scans, after they had been aligned to the CBF image in the same stereotactic space. The same transformation information was used to resample the gray matter volume into the stereotactic space. Region-of-interest masks identifying 90 gray matter regions in the stereotactic space of the cerebral hemispheres (35), plus the resampled gray matter mask, then were applied to each subject's spatially normalized rCBF and K* images to obtain 90 (45 bilateral) weighted mean rCBF and K* for AA values, respectively. We used the gray matter mask to minimize mixing white matter values into the calculated region-of-interest measurements.
For each subject, global gray matter rCBF and global K* for AA were calculated by averaging the 90 bilateral regional hemispheric values of rCBF and K*, respectively. Statistical comparisons were made between AD and control means. Data from an individual patient with AD were not matched to data from an exact-age control, as PVE-corrected rCBF, K* for AA, and regional glucose metabolism do not change with age in healthy nonhypertensive controls (19,36), and the numbers of subjects were too limited to do this in any case. Group comparisons for global and PVE-corrected regional means were made using 2-tailed t tests. Additionally, a false-discovery-rate (FDR) procedure (37) was used to account for the increased risk of performing multiple comparisons. In this procedure, it was accepted that 5% of surviving differences between means were false-positives. The FDR procedure applies to statistically independent as well as to positively correlated data (38).
RESULTS
Global Values of CBF and K* for AA
Table 1 lists mean values of global gray matter CBF and K* for AA in the patients with AD and in control subjects, before and after a PVE correction. Without the correction, global CBF was reduced significantly by 28.6% in the patients with AD (n = 6), compared with control subjects (n = 7), whereas global K* for AA was elevated significantly by 18.3% in the patients with AD (n = 8), compared with control subjects (n = 9). There were fewer CBF than K* measurements because some of the CBF studies failed.
Global Values of CBF and K* for AA in Healthy Controls and Patients with AD, Before and After Correction for PVE
Because a PVE correction compensates for spill-out or spill-in effects by resolution and makes the measured tissue concentration approximate the true concentration (19), this correction increased global CBF and K* for AA. After the correction, differences between the patients with AD and controls remained significant for global K* (P < 0.01) but not global CBF. PVE-corrected K* for AA was 26.4% higher in the patients with AD than in controls (8.7 ± 1.4 μL/min/cm3, compared with 6.9 ± 0.8 μL/min/cm3).
Comparison of Regional PVE-Corrected Values of rCBF and K*
Two-tailed t tests showed that PVE-corrected rCBF was less at P < 0.01 in the patients with AD than in the control subjects in 12 of the 90 regions examined (data not shown). However, these regions, as well as the remaining 78, did not survive the FDR analysis. In contrast, 78 regions survived the FDR analysis for PVE-corrected global K* for AA, with all K*s being higher in the patients with AD than in control subjects (Table 2). Regions that survived were largely in the neocortex, hippocampus, and amygdala. About half of the 12 regions that did not survive the FDR analysis were subcortical and included the left thalamus, left and right pallidum, and left and right caudate nucleus (Table 3). These differences are illustrated in the serial horizontal brain slices of Figure 1.
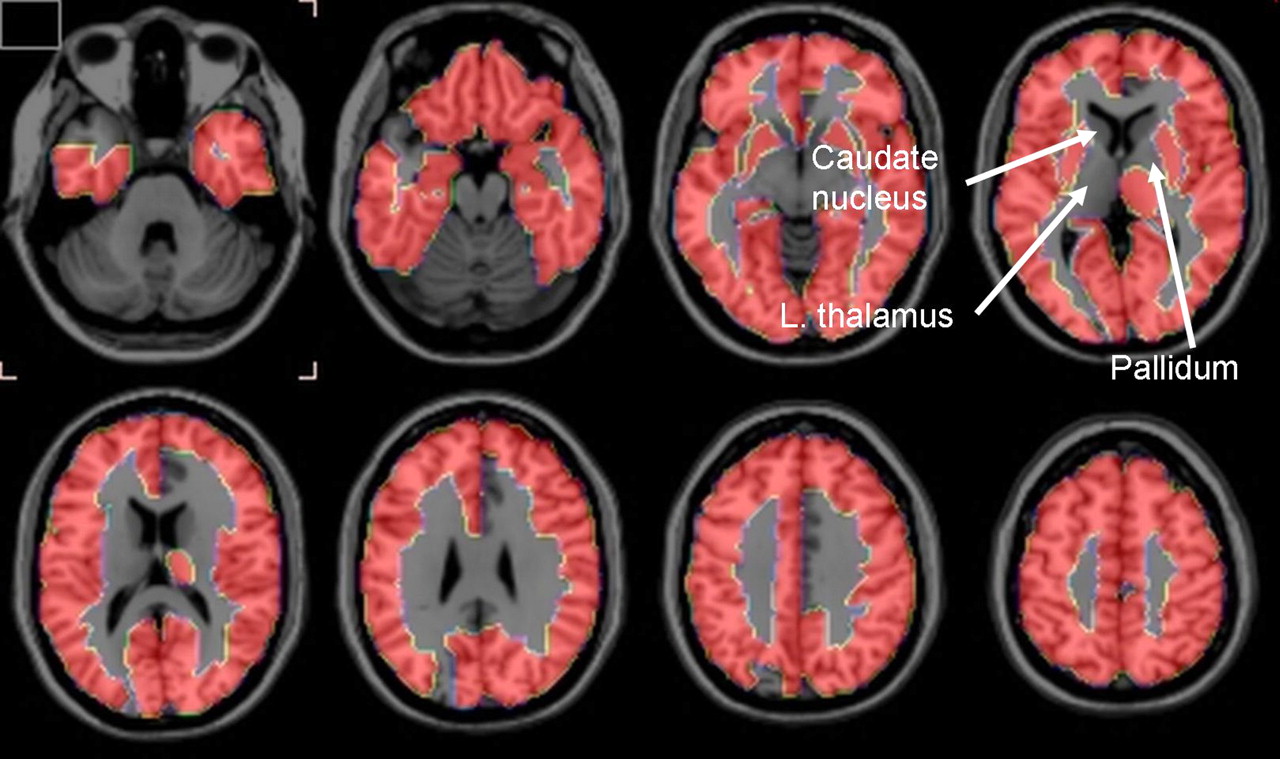
Horizontal brain slices showing brain regions in which PVE-corrected K* for AA survived FDR procedure that separated patients with AD from control subjects at 5% level of significance. Regions in 1-mm-thick T1-weighted MRI slices are defined in Tables 2 and 3 based on stereotactic atlas of Tzourio-Mazoyer et al. (35).
Brain Regions in Which PVE-Corrected K* for AA Differed by FDR Procedure Between Patients with AD and Control Subjects
Brain Regions That Did Not Survive FDR Analysis
Normalized Regional Values of rCBF and K* for AA
After PVE-corrected rCBF was normalized to global PVE-corrected CBF, 7 group mean differences survived the FDR procedure. Reductions were noted in the right temporal inferior and middle gyri, the left precuneus, and the right supramarginal gyrus, whereas increases occurred in the left frontal superior medial gyrus, left putamen, and right thalamus. No group difference of normalized PVE-corrected K* for AA survived the FDR procedure.
Vb
Significant differences in Vb (Eq. 1) between patients with AD and control subjects occurred in only a few regions and were not in a consistent direction (data not shown).
DISCUSSION
PET with intravenously injected 1-11C-AA was used to show that mean values of PVE-uncorrected and -corrected gray matter global hemispheric K* for AA were increased by 18% (P < 0.05) and 26% (P < 0.01), respectively, in otherwise healthy, mildly to moderately (1 severely) demented unmedicated patients with AD, compared with age-matched healthy controls. Of the 90 hemispheric regions studied (35), the FDR procedure showed that mean PVE-corrected regional K* for AA was elevated in 78 regions, largely in the cerebral cortex. The 12 regions in which PVE-corrected regional K* did not survive the FDR procedure included right and left caudate, right and left pallidum, and left thalamus (Table 3; Fig. 1).
PVE-uncorrected but not PVE-corrected mean global CBF was significantly less (26%; P < 0.05) in the patients with AD than in the control subjects (Table 1). Of the 90 regions examined, PVE-corrected rCBF was reduced at P < 0.01 on a 2-tailed t test in 12 of them, but none of these reductions survived the FDR procedure. The procedure did indicate that PVE-corrected rCBF, when normalized to the global CBF, was reduced in 4 regions and increased in 3, of which 2 were the left putamen and right thalamus. Significant differences in Vb between the 2 groups occurred in a few regions but were not in the same direction and were uninformative.
The mean PVE-corrected global gray matter CBF in the controls, 61.0 ± 10.1 (coefficient of variation [CV] = 16.4%) mL/100 g/min (Table 1), is similar to a reported gray matter mean in older healthy subjects, 66 (CV = 13%) mL/100 g/min (19). The mean PVE-corrected global K* for AA, 6.9 ± 0.8 (CV = 11.9%) μL/min/cm3 (Table 1), corresponds to a published global gray matter mean, 7.03 (CV = 8%) μL/min/cm3, in older healthy subjects (19). Regional PVE-corrected means of rCBF and K* for AA also correspond to published values in healthy subjects.
The significant reduction in the mean global CBF uncorrected for the PVE (Table 1) also agrees with the literature (39), whereas the absence of a significant difference or of a difference that survived the FDR procedure in PVE-corrected CBF or rCBF, respectively, likely reflected the few subjects in which rCBF was measured, the high coefficient of variation of the flow measurements (Table 1), and noise introduced by the PVE correction (40).
The results support the hypothesis that regional K* for AA would be increased in patients with AD, as a marker of upregulated AA metabolism accompanying neuroinflammation. This hypothesis was based on showing elevated brain K* for AA and other markers of AA metabolism in a rodent lipopolysaccharide-infusion model of neuroinflammation and on evidence of neuroinflammation associated with senile (neuritic) plaques surrounded by activated microglia and of accumulated β-amyloid in the AD brain. The distribution of senile plaques is more common in cortical than in subcortical brain regions (41,42) and may explain why PVE-corrected K* for AA in the left thalamus and in bilateral caudate nucleus and pallidum did not survive the FDR analysis (Table 3; Fig. 1).
Comparing K* for AA with rCBF in this study was useful for several reasons. The 15O-water PET scan helped to coregister the 1-11C-AA PET scan with the subject's anatomic MRI scan, helping to identify regions in the K* images and to perform the PVE correction (32). K*'s independence of rCBF was confirmed by finding that PVE-corrected values for global and regional K* were elevated, whereas uncorrected global CBF was decreased and PVE-corrected rCBF tended to decrease. Flow independence of K* has been demonstrated in preclinical studies (17) and exists because the unesterified AA that is highly bound to circulating albumin acts as an “infinite” and rapidly available source of AA delivery to the brain (16).
The pattern of AD-related differences in K* for AA in this study might be compared with differences found with other relevant PET compounds. For example, brain uptake of 11C-(R)-PK11195, a ligand for peripheral benzodiazepine receptors on activated brain microglia, was increased in cortical but not in subcortical regions in patients with AD, compared with control subjects (43,44), as was uptake of 11C-PIB, a ligand for β-amyloid (45). Comparisons with 11C-PIB imaging may be particularly important in the course of AD, as β-amyloid peptide alone can stimulate cytokine formation and activate PLA2 before senile plaques accumulate (9,10). Glucose metabolism, to which rCBF is coupled, is reduced in AD more in neocortical than in subcortical regions (31,46).
The results of the current study should be considered preliminary. Future studies should include more subjects and perhaps consider additional methods (e.g., statistical parametric mapping, correlation approaches) to evaluate the data. Doing so should help to identify significant differences in rCBF and to relate rCBF and K* for AA in patients with AD to each other and to dementia severity. Individual metabolite-corrected input functions to calculate K* also should be used. We could not do this in the patients with AD and in 2 of the controls in this study, but comparable significant changes in K* using the average input function after correcting for plasma metabolites indicated that this did not affect our conclusions.
rCBF and K* for AA were analyzed after correcting for the PVE, to address the effect of atrophy and estimate actual parenchymal rates (19,31). With this correction, the estimated tracer concentration in high-uptake areas is increased, which translates into a nonuniform increase in K* for AA or rCBF. Furthermore, the correction increases noise in the data (40). However, the results and the analyses of global values suggest that this correction did not affect group separation with K*.
CONCLUSION
Regional PVE-corrected K* for AA, a measure of regional brain AA consumption, was elevated in widespread cortical areas of mildly to moderately (1 severely) demented but otherwise healthy patients with AD, compared with age-matched controls. These results support the hypothesis that K* for AA would be elevated in AD, which was based on evidence of upregulated markers of brain AA metabolism in a rat model of neuroinflammation and on the presence of neuroinflammation in AD. If such elevations are confirmed in follow-up studies on larger groups of patients and controls, we might then use intravenous 1-11C-AA with PET to image the involvement of AA in neuroinflammation in AD and other brain diseases.
Acknowledgments
We thank Dr. Madhav Thambisetty for his helpful comments about the manuscript. This work was supported by the Intramural Programs of the National Institute on Aging, the National Institute of Neurological Disorders and Stroke, the National Institute of Mental Health, and the PET Department of the Clinical Center at the National Institutes of Health, Bethesda, Maryland.
Footnotes
-
COPYRIGHT © 2008 by the Society of Nuclear Medicine, Inc.
References
- Received for publication December 6, 2007.
- Accepted for publication May 12, 2008.


Jump to section
Related Articles
Cited By...
- Arachidonic Acid Mobilization and Peroxidation Promote Microglial Dysfunction in A{beta} Pathology
- Gut microbiota regulate Alzheimers disease pathologies and cognitive disorders via PUFA-associated neuroinflammation
- Pro-resolving Lipid Mediators Within Brain Esterified Lipid Pools are Reduced in Female Rats Chronically Exposed to Traffic-Related Air Pollution or Genetically Susceptible to Alzheimers Disease Phenotype
- Molecular Imaging of Inflammation: Current Status
- Imaging of neuroinflammation in dementia: a review
- The Synthesis and In Vivo Pharmacokinetics of Fluorinated Arachidonic Acid: Implications for Imaging Neuroinflammation
- Lithium modifies brain arachidonic and docosahexaenoic metabolism in rat lipopolysaccharide model of neuroinflammation
- Radioisotopic Imaging of Neuroinflammation
- Cerebrospinal Fluid Secretory Ca2+-Dependent Phospholipase A2 Activity Is Increased in Alzheimer Disease
- Imaging incorporation of circulating docosahexaenoic acid into the human brain using positron emission tomography
- Arachidonic Acid and the Brain