


Visual Abstract

Abstract
Developing a noninvasive imaging method to detect immune system activation with a high temporal resolution is key to improving inflammatory bowel disease (IBD) management. In this study, granzyme B (GZMB), typically released from cytotoxic T and natural killer cells, was targeted using PET with 68Ga-NOTA-GZP (where GZP is β-Ala–Gly–Gly–Ile–Glu–Phe–Asp–CHO) to detect early intestinal inflammation in murine models of colitis. Methods: Bioinformatic analysis was used to assess the potential of GZMB as a biomarker for detecting IBD and predicting response to treatment. Human active and quiescent Crohn disease and ulcerative colitis tissues were stained for GZMB. We used IL-10−/− mice treated with dextran sulfate sodium (DSS) as an IBD model, wild-type C57BL/6J mice as a control, and anti–tumor necrosis factor as therapy. We used a murine GZMB-binding peptide conjugated to a NOTA chelator (NOTA-GZP) labeled with 68Ga as the PET tracer. PET imaging was conducted at 1, 3, and 4 wk after colitis induction to evaluate temporal changes. Results: Bioinformatic analysis showed that GZMB gene expression is significantly upregulated in human ulcerative colitis and Crohn disease compared with the noninflamed bowel by 2.98-fold and 1.92-fold, respectively; its expression is lower by 2.16-fold in treatment responders than in nonresponders. Immunofluorescence staining of human tissues demonstrated a significantly higher GZMB in patients with active than with quiescent IBD (P = 0.032).68Ga-NOTA-GZP PET imaging showed significantly increased bowel uptake in IL-10−/− mice with DSS-induced colitis compared with vehicle-treated IL-10−/− mice (SUVmean, 0.75 vs. 0.24; P < 0.001) and both vehicle- and DSS-treated wild-type mice (SUVmean, 0.26 and 0.37; P < 0.001). In the IL-10−/− DSS-induced colitis model, the bowel PET probe uptake decreased in response to treatment with tumor necrosis factor–α (SUVmean, 0.32; P < 0.001). There was a 4-fold increase in colonic uptake of 68Ga-NOTA-GZP in the colitis model compared with the control 1 wk after colitis induction. The uptake gradually decreased to approximately 2-fold by 4 wk after IBD induction; however, the inflamed bowel uptake remained significantly higher than control at all time points (week 4 SUVmean, 0.23 vs. 0.08; P = 0.001). Conclusion: GZMB is a promising biomarker to detect active IBD and predict response to treatment. This study provides compelling evidence to translate GZMB PET for imaging IBD activity in clinical settings.
Inflammatory bowel disease (IBD) is a chronic gastrointestinal inflammatory disorder and includes 2 major groups: Crohn disease (CD) and ulcerative colitis (UC) (1). Although there have been notable advancements in the clinical management of IBD, substantial challenges remain in enhancing diagnostic precision, overcoming issues with treatment intolerance, and addressing the recurrent cycle of remission and relapse (2,3). In addition, long-standing IBD is associated with an increased risk of cancer, which necessitates constant monitoring of disease activity (4–6). Although endoscopy is widely used for the diagnosis and management of IBD, it has limitations, such as invasiveness and lack of ability to capture the abnormalities in deep bowel wall layers (7,8). Leveraging multimodal imaging such as PET/CT and PET/MRI enhances IBD diagnosis accuracy beyond the reach of standard colonoscopy, allowing for detailed visualization in regions inaccessible to endoscopic evaluation and offering a comprehensive view of inflammatory activity and structural changes (9). Hence, noninvasive imaging techniques are urgently needed to provide real-time information on specific pathologic processes across the entire bowel and to offer a high temporal resolution for accurate detection, staging, and quantitative evaluation of response to treatment (10). Recent research has shown that molecular imaging with SPECT and PET may be more accurate for identifying gastrointestinal inflammation in both clinical and preclinical settings, with the added advantage of real-time information (11–15). Since IBD is an immune-mediated disease, imaging biomarkers that provide information on specific immune mediators could be valuable in early diagnosis and evaluation of treatment response (16).
The pathophysiology of IBD is believed to involve dysregulation of innate and adaptive immune systems. Therefore, tracking the activity of immune cells, particularly natural killer cells and CD8+ cytotoxic T cells, which initiate the inflammatory cascade in the bowel, could indicate inflammation status in IBD (17,18). Granzyme B (GZMB) is a serine protease released by immune cells, mainly activated natural killer cells and CD8+ cytotoxic T cells, that triggers apoptosis in infected, neoplastic, or malfunctioning cells (19). It has been suggested that GZMB is an early initiator of inflammation in IBD (19). Hence, PET imaging of GZMB could capture the inflammatory status of the mucosal immune layer of the gastrointestinal tract in the early stages of IBD. Our group has developed and used a GZMB-targeted peptide-based PET imaging probe, 68Ga-NOTA-GZP, where GZP is β-Ala–Gly–Gly–Ile–Glu–Phe–Asp–CHO. We have shown that GZMB PET can noninvasively evaluate the effectiveness of immune checkpoint inhibitors and predict the immunotherapy response in preclinical cancer models and immune-related adverse events (20–23). These results built the foundation of our next-step efforts to explore the application of GZMB PET in the setting of IBD.
This study aimed to establish GZMB PET as a noninvasive and accurate imaging technique for detecting bowel inflammation and monitoring response to treatment in IBD. We first evaluated GZMB gene expression in human CD, UC, and noninflamed bowel using bioinformatics data and assessed the GZMB gene expression and excretion level in human bowel tissues with active and quiescent inflammation. Next, we studied the ability of GZMB PET to quantify bowel inflammation compared with control conditions, the disease activity over time, and in response to antiinflammatory treatment in an established mouse model of colitis.
MATERIALS AND METHODS
Dataset Acquisition for Bioinformatics and Differential Gene Expression Analysis
The gene expression datasets were obtained from the Gene Expression Omnibus public platform under accession numbers GSE10191, GSE25220, GSE36807, GSE117993, GSE95437, GSE93624, GSE11831, GSE57945, GSE75214, GSE16879, and GSE100833. The study design and sample acquisition are detailed in Supplemental Table 1 (supplemental materials are available at http://jnm.snmjournals.org). A systematic search was performed on the Gene Expression Omnibus (24) using the following keywords: “inflammatory bowel disease,” “ulcerative colitis,” and “Crohn’s disease,” with “Homo sapiens” as the tissue donor species filter.
The datasets were classified into 3 subgroups based on study design and IBD conditions, including UC compared with non-IBD colon conditions (8 datasets), CD compared with non-IBD colon conditions (7 datasets), and treatment responder compared with nonresponder IBD patients (2 datasets) (Supplemental Table 1). The differential gene expression analysis was performed for each dataset, followed by gene intersection analysis to find the common genes in different datasets in each colon condition group. The common genes were then ranked on the basis of fold change among different groups.
We compared 2 sample groups using the “affy” and “limma” R packages after preprocessing and normalizing the microarray datasets to identify significant differential gene expression levels that varied depending on the experimental settings.
GZMB Quantification on Immunofluorescence Staining of Human Colon Tissues
Formalin-fixed paraffin-embedded tissue blocks from active and quiescent IBD patients and normal bowel tissue were obtained from OriGene. Immunofluorescence staining against GZMB was performed on cut samples using methods previously described (23); briefly, we incubated slides with rabbit antihuman GZMB (ab243879; Abcam) primary antibody at 1:100 dilution at 4°C overnight, followed by Alexa Fluor 647 (Life Technologies Corp.) conjugated goat antirabbit IgG (A32733; ThermoFisher) secondary antibody at 1:100 dilution and nuclear staining with 4′,6-diamidino-2-phenylindole at a 1 μg/mL concentration. Fluorescence images were acquired with a cell imaging multimode reader (Cytation 5; Agilent). Semiquantitative analysis was performed by measuring the cumulative total fluorescence signal in a gray-scale image related to GZMB expression divided by the cumulative total fluorescence signal in a gray-scale image related to 4′,6-diamidino-2-phenylindole (as a measure of the total number of cells) using Fiji software (version 2.9.0; National Institutes of Health).
Animals and Groups
Animal studies were conducted with the approval of the Institutional Animal Care and Use Committee, and all animal experiments were conducted following the “Animal Research: Reporting of In Vivo Experiments” guidelines. Six-week-old male wild-type C57BL/6J (n = 18) and IL-10−/− mice (with C57BL/6J background, n = 83) were used (Jackson Laboratories). After acclimatization, both IL-10−/− and C57BL/6J mice were divided into 2 major groups. The first group received only autoclaved water as a vehicle control (IL-10−/− vehicle, n = 13, and C57BL/6J vehicle, n = 7). In the second group, colitis was induced by supplementing 3% dextran sulfate sodium (DSS; Sigma) in the autoclaved drinking water for 7 d (IL-10−/− DSS, n = 22, and C57BL/6J DSS, n = 11), followed by restoring regular water on day 8 (25). IL-10−/− DSS-treated mice were divided into subgroups not treated (n = 9) or treated with anti–tumor necrosis factor (TNF) (n = 13, a single 100-μg dose of murine anti-TNF injection intraperitoneally [XT3.11, BE0058; Bio X Cell]) (26). Furthermore, we used an additional 48 IL-10−/− mice to assess temporal changes in 68Ga-NOTA-GZP over 4 wk, dividing them into 2 groups: 24 mice treated with DSS and 24 treated with a vehicle. Supplemental Figure 1 provides a schematic representation of the study’s timeline and the grouping methodology used. All animals were monitored 3 times a week for changes in behavior, weight loss, stool consistency, blood in the stool, and anal prolapse. At the end of the experiments, the animals were euthanized in a humane manner using CO2 gas, according to the guidelines recommended by the American Veterinary Medical Association for the euthanasia of laboratory animals. The procedure was performed ensuring a gradual-fill method to minimize animal distress. In addition, since the UC mouse model is well established and responds effectively to anti-TNF treatment, we minimized the use of animals and addressed potential ethical concerns by not using IgG1 monoclonal antibody treatment as a control group to the anti-TNF group.
68Ga-NOTA-GZP Probe Synthesis
68Ga-NOTA-GZP was synthesized using 68Ga eluted from a 68Ge/68Ga generator (Eckert & Ziegler) as previously described (23). Briefly, NOTA-GZP (50 μg) was mixed with 68Ga (370 MBq) in 2 M 4-(2-hydroxyethyl)piperazine-1-ethanesulfonic acid buffer, and the pH was adjusted to 3.5–4.0. The reaction mixture was incubated for 10 min at room temperature. The product was then purified using a reverse-phase C18 Sep-Pak (Waters) solid-phase extraction cartridge and diluted with saline before administration to mice. The radiolabeling yield was measured by instant thin-layer chromatography as previously described (27,28). We exclusively used the 68Ga-NOTA-GZP probe as our primary probe because of its well-established efficacy in our prior research, eliminating the need for a control peptide.
Animal 68Ga-NOTA-GZP PET/CT Imaging and Biodistribution Analysis
Mice from all groups were imaged with a rodent PET/CT scanner (TriFoil Imaging) 7 d after treatment with DSS or vehicle. Approximately 7.4 MBq of 68Ga-NOTA-GZP were intravenously injected, and PET/CT was performed 1 h after injection. Before imaging, the mice were anesthetized with 2% isoflurane, and 100 μL of diatrizoate meglumine and diatrizoate sodium solution (Gastrografin; Bracco) were administered intrarectally as a large-intestine contrast agent. PET images were acquired for 20 min at a single bed position, followed by CT acquisition for approximately 10 min. We used a heating system to keep the mice warm during the scans. Throughout the imaging process, we monitored vital signs, including core temperature, heart rate, and respiratory rate, using equipment from SA Instruments, Inc. The acquired images were reconstructed using a 3-dimensional maximum-likelihood expectation maximization algorithm with 4 iterations and 20 subsets. Under CT guidance, a 3-dimensional region of interest was drawn over the colon. The bowel’s SUVmean was calculated within the 3-dimensional region of interest using VivoQuant software (Invicro).
Immediately after the PET/CT acquisition, biodistribution analysis of the 68Ga-NOTA-GZP images was conducted for a subset of animals (7–13 animals/group). The animals were euthanized, blood and organs were harvested and weighed, and the retained radioactivity was measured using a γ-counter (Wizard; Perkin Elmer). Raw mean counts of the tissue were corrected for background activity, decay, and tissue weight and reported as percentage injected dose per gram. Additionally, the colon and cecum of each animal were fixed or processed for further cytokine analyses.
Cytokine Analysis of Colon Samples
The extracted colon tissues from the colitis-induced mice, on day 7 after induction, were rinsed using ice-cold phosphate-buffered saline followed by cold complete RPMI 1640 medium. Tissues were then cut longitudinally, and a 5 mm2 sample of each tissue was placed in a small petri dish and incubated at 37°C for 24 h with 1.5 mL of complete RPMI medium supplemented with 5% CO2. The supernatant was aspirated, centrifuged at 4,100g for 10 min, and stored at −70°C until used for biomarker analyses. The cytokine analysis was performed using a ProcartaPlex mouse immune monitoring panel 48-plex kit (catalog no. EPX480-20834-901; Thermo Fisher Scientific). A panel of 48 inflammatory markers was analyzed using the Luminex 200 system (Thermo Fisher Scientific).
Statistical Analysis
Statistical analyses were performed using Prism software (GraphPad). Differences in variables were assessed by 2-tailed Student t tests, 2-way ANOVA, or 3-way ANOVA, depending on the comparison. After ANOVA, a post hoc Holm–Sidak multiple-comparisons test was applied. A P value of less than 0.05 was considered statistically significant. Values are reported as mean ± SD. We used the false-discovery rate or Benjamini–Hochberg method as a statistical correction method for differential gene expression analysis, to accurately identify significant differences between sample groups. The criteria for identifying differential gene expression were set as an adjusted P value of less than 0.05 and an absolute log2 fold change of more than 0.6, which provided a statistically significant and biologically meaningful threshold for identifying differentially expressed genes.
RESULTS
GZMB Is Biomarker of IBD
When comparing whole transcriptome profiling between UC and non-IBD bowel conditions, we observed significant alterations in 4328, 2985, 3993, 245, 1460, 2131, 2526, and 1896 genes in the bowel in GSE10191, GSE11831, GSE16879, GSE25220, GSE36807, GSE75214, GSE95437, and GSE117993 datasets, respectively (Supplemental Fig. 2; Supplemental Tables 2 and 3). Among these genes, we found 48 genes consistently altered in UC compared with non-IBD conditions, including 44 upregulated and 4 downregulated genes (Fig. 1A; Supplemental Table 4). The GZMB gene showed a significant upregulation of 2.98-fold in UC compared with non-IBD conditions (Fig. 1B).

GZMB as biomarker in IBD for detecting active disease and evaluating treatment response using bioinformatic analysis. (A) Number of significantly altered genes in active UC vs. normal tissues. (B) Upregulated genes that were in common in UC 8 datasets ranked by log2 fold change. (C) Heat map of up- and downregulated genes in UC and CD tissues compared with normal tissue. (D) Number of altered genes in active CD vs. normal tissues. (E) Upregulated genes that were in common in CD 7 datasets ranked by log2 fold change. (F) Gene expression of GZMB in patients before and after treatment analyzed by 1-way ANOVA followed by adjusting P value using Benjamini–Hochberg method (data are mean ± SD). (G) Top 15 genes significantly decreased after treatment at different time points (green spots represent top 5 genes, which decreased after treatment, and red represents GZMB). (H) Evaluation of GZMB gene expression in active and inactive UC using t test analysis. FDR = false-discovery rate; log2FC = log2 fold change.
In the analyses of GSE11831, GSE16879, GSE57945, GSE75214, GSE93624, GSE95437, and GSE117993 datasets, we observed significant alterations in 817, 1975, 1406, 1137, 1181, 2316, and 673 genes, respectively, in the colon for patients with CD compared with non-IBD conditions (Supplemental Fig. 2; Supplemental Tables 2 and 5). We identified 97 consistently altered genes across all databases, including 81 upregulated and 16 downregulated genes (Fig. 1C). The GZMB gene showed a significant upregulation of 1.92-fold in CD compared with non-IBD conditions (Fig. 1D). Heat-map analysis of all significantly altered genes in UC and CD samples compared with non-IBD conditions is shown in Figure 1E. These findings suggest that GZMB could be a potential diagnostic marker for IBD.
We investigated the expression of GZMB in the bowels of patients with IBD in response to treatment using the GSE16879 and GSE100833 databases and in active versus inactive IBD using the GSE75214 database. A reanalysis of GSE16879 demonstrated that GZMB was significantly upregulated in IBD at baseline in both treatment responders and nonresponders compared with corresponding normal noninflamed bowel samples. The GZMB gene decreased by 2.16-fold in patients who responded to the first infliximab treatment but showed no significant change in patients who did not respond to the treatment (Fig. 1F). Additionally, in the reanalysis of the GSE100833 database, GZMB was among the top 15 downregulated genes, showing a decrease of 2.16-fold as early as 6 wk after ustekinumab treatment in IBD patients who responded to treatment, and remained low in remission (Fig. 1G). The downregulation of GZMB at 6 wk after treatment was observed in bowel samples regardless of their anatomic site, that is, taken from the rectum; sigmoid descending, transverse, or ascending colon; or terminal ileum (Supplemental Fig. 3). Furthermore, we investigated the differential gene expression of GZMB in IBD patients with active and inactive inflammation. Consistent with our previous findings, GSE75214 database analysis revealed that the expression of GZMB was significantly higher in patients with active IBD than in those with inactive disease (false-discovery rate < 0.001%, Fig. 1H). Collectively, these findings from published online databases support the potential of GZMB as a diagnostic biomarker of IBD and its utility for monitoring treatment response early after initiation of treatment in patients with IBD.
GZMB Is Highly Excreted in Clinically Active IBD
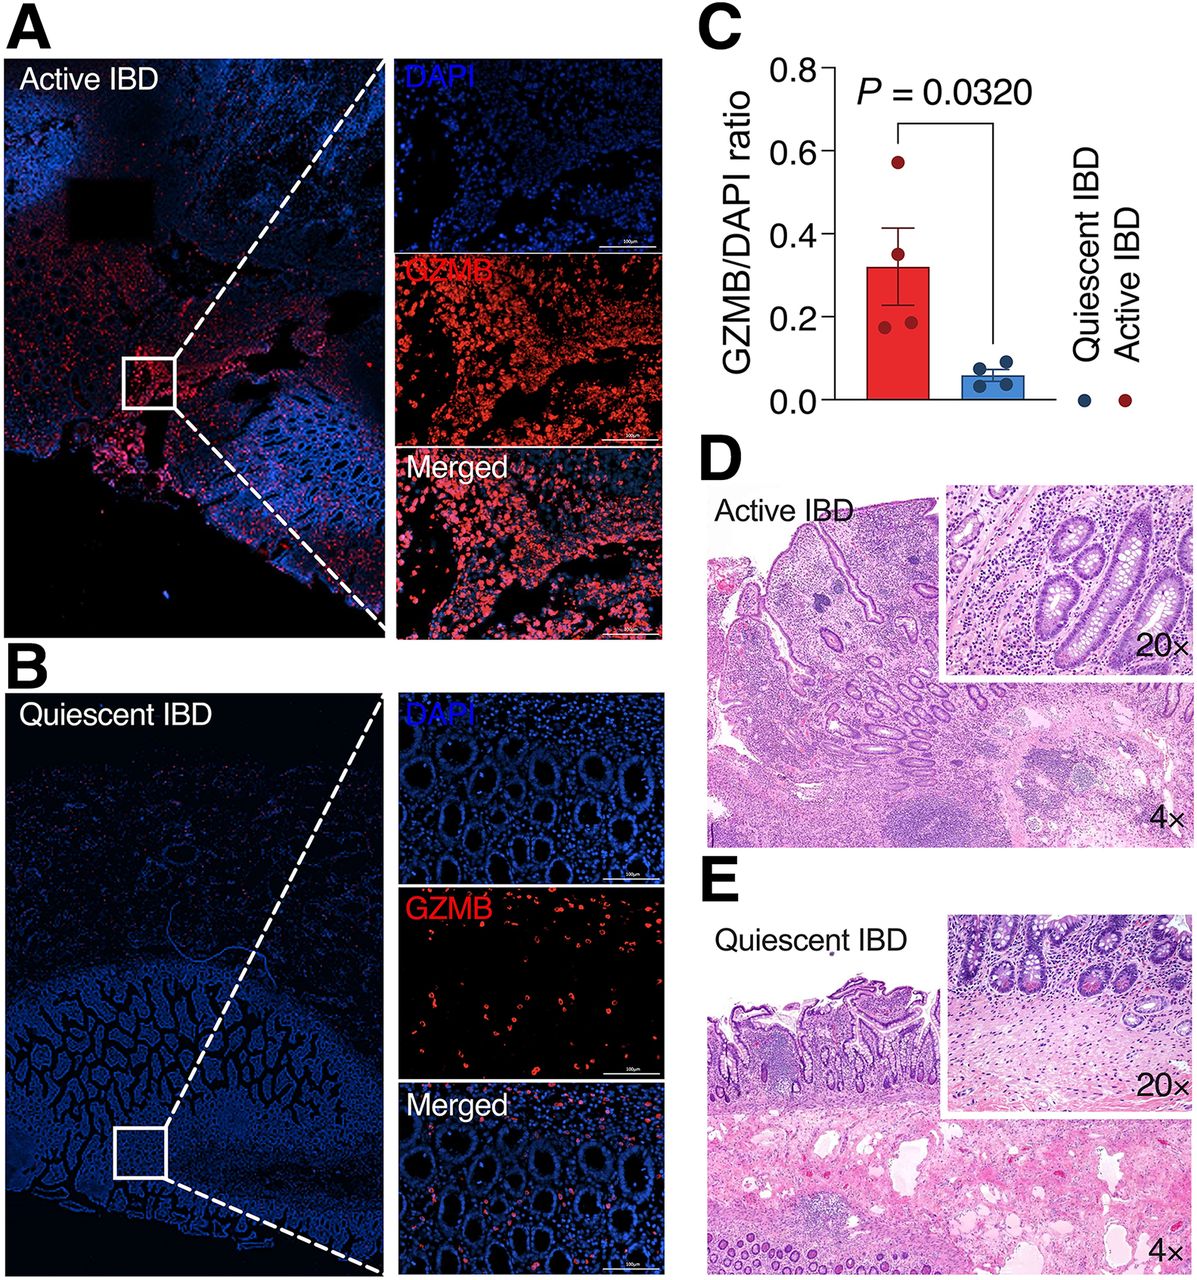
Immunofluorescence staining of human intestinal specimens for GZMB was strong at the lamina propria in active CD samples (Fig. 2A), with significantly weaker staining in the quiescent or normal colon samples (0.32 ± 0.19 vs. 0.06 ± 0.03, P = 0.032) (Figs. 2B–2E). These findings confirm the potential of GZMB as a histologic and imaging biomarker for assessing disease activity in human subjects with IBD.

(A) Immunofluorescence evaluation of GZMB expression in active IBD. (B) Immunofluorescence evaluation of GZMB expression in quiescent IBD. (C) Quantitative analysis of GZMB to 4′,6-diamidino-2-phenylindole ratio in active IBD vs. quiescent IBD (data are mean ± SEM, 4/group). (D) Hematoxylin and eosin staining of corresponding active IBD samples at indicated magnification. (E) Hematoxylin and eosin staining of corresponding quiescent IBD samples at indicated magnification. Scale bars represent 100 μm. DAPI = 4′,6-diamidino-2-phenylindole.
68Ga-NOTA-GZP Has Favorable Characteristics for Imaging Bowel Inflammation
We made 68Ga-NOTA-GZP with a yield of 67% ± 11%, more than 95% radiochemical purity, and specific activity of 5,190 ± 1,100 MBq/mg. The biodistribution of 68Ga-NOTA-GZP in normal mice (3/group) showed rapid renal elimination of the probe and low background uptake in the liver, blood pool, and other nontarget organs (Supplemental Fig. 4A). In vehicle-treated wild-type animals, probe uptake in the intestines and stomach remained below the level in the blood pool (0.29 ± 0.04, 0.25 ± 0.03, and 0.40 ± 0.05 percentage injected dose per gram, respectively), indicating a favorable biodistribution for imaging active inflammation in the gastrointestinal tract (Supplemental Fig. 4B).
GZMB PET Imaging Can Detect Active Bowel Inflammation
Representative axial and coronal 68Ga-NOTA-GZP PET/CT images of the animal models at 7 d after treatment are shown in Figures 3A and 3B. Quantitative analyses of the PET images showed a low level of uptake in the bowel of wild-type mice treated with either vehicle or DSS (SUVmean, 0.26 ± 0.05 vs. 0.37 ± 0.11, respectively; P = 0.255; Figs. 3A–3C). The IL-10−/− mice with DSS-induced colitis demonstrated significantly higher 68Ga-NOTA-GZP uptake than that in IL-10−/− mice treated with vehicle (SUVmean, 0.76 ± 0.10 vs. 0.24 ± 0.10, respectively; P < 0.001; Figs. 3A–3C). Anti-TNF treatment significantly decreased PET uptake in the IL-10−/− mice with colitis, compared with untreated mice with active colitis (SUVmean, 0.32 ± 0.14 vs. 0.76 ± 0.10; P < 0.001; Figs. 3A–3C). The ex vivo measurement of the retained activity in the extracted intestinal specimens of the mice in all groups confirmed the results of PET studies, demonstrating that 68Ga-NOTA-GZP uptake was significantly higher in intestinal specimens of IL-10−/− mice with DSS-induced colitis than in other groups (percentage injected dose per gram: 3.38 ± 0.39, 0.94 ± 0.57, 0.59 ± 0.29, 0.86 ± 0.25, and 0.59 ± 0.53 in IL-10−/− vehicle-treated, IL-10−/− DSS-induced colitis treated with anti-TNF, wild-type vehicle-treated, and wild-type DSS-treated, respectively; P < 0.001; Fig. 3D).

(A) Coronal representation of 68Ga-NOTA-GZP PET imaging patterns alongside CT scans, encompassing both combined PET/CT and standalone PET views in IL10−/− mice treated with vehicle, DSS, or DSS plus anti-TNF, as well as wild-type animals treated with DSS or vehicle. (B) Representative axial view of 68Ga-NOTA-GZP PET/CT uptake pattern in IL10−/− mice treated with DSS and wild-type mice treated with vehicle. (C) Quantitative analysis of 68Ga-NOTA-GZP PET/CT SUVmean in DSS-treated IL10−/− mice compared with other groups (7–13/group). (D) 68Ga-NOTA-GZP uptake in ex vivo PET/CT imaging experiment of extracted colonic specimens (3/group). (E) Temporal change in 68Ga-NOTA-GZP PET/CT uptake during 4 wk after DSS induction (data are mean ± SEM, 8/group). %ID = percentage injected dose; WT = wild-type.
GZMB PET Has Favorable Temporal Resolution for Imaging IBD Activity
Serial 68Ga-NOTA-GZP PET imaging over 4 wk after colitis induction showed a significant 4-fold increase in colonic uptake 1 wk after DSS colitis induction in the IL10−/− mice compared with vehicle-treated IL10−/− mice. Uptake in the former group gradually decreased by 4 wk to approximately 2-fold higher than in the vehicle-treated IL10−/− control (Fig. 3E). 68Ga-NOTA-GZP uptake was significantly higher in the DSS-induced colitis group than in vehicle-treated IL10−/− mice at all time points (repeated-measure ANOVA, 8/group; Fig. 3E).
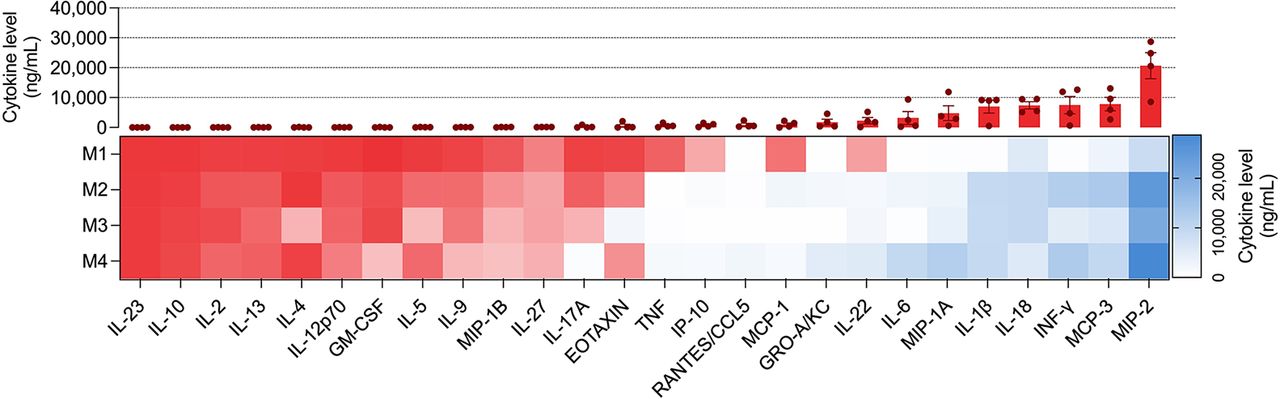
Cytokine Profile of Extracted Colon Samples Confirmed Dysregulated Cell-Mediated Immune Response in DSS-Induced IL10−/− Colitis Model
Quantification of the level of cytokines in extracted colon tissue from the DSS-induced IL10−/− colitis model (Fig. 4) demonstrated an increase in Th1 and Th22 cytokines (including interferon; interleukins 1β, 6, and 22; and TNF) and absence of Th2 and Th17 cytokines (including interleukins 4, 5, 10, 13, and 17) (Fig. 4). Moreover, there was a marked increase in multiple monocyte chemotactic factors such as macrophage inflammatory proteins 1 and 2, interleukin 18, and monocyte chemotactic proteins 1 and 3, which could be observed in a dysregulated immune condition, such as IBD (Fig. 4) (29).

Evaluation of colonic cytokine levels in different groups (M1–M4 represent each mouse’s data; red box represents cytokine levels < 250 ng/mL).
DISCUSSION
Effective management of IBD requires close monitoring of disease activity. However, the lack of reliable, noninvasive techniques for assessing IBD activity remains a challenge (30). Commonly used endoscopic assessment and tissue sampling are invasive and do not offer adequate reach to assess the state of disease reliably. Anatomic imaging techniques such as CT or MR enterography show the sequelae of the prolonged inflammation and often do not have the temporal resolution necessary for close disease monitoring. Molecular imaging techniques can potentially fill this gap because of their high sensitivity and time resolution. Different molecular imaging tracers have been tested in experimental IBD studies with variable results (14,30–32). Many of these techniques are indirect measures of active colonic inflammation and therefore may not be mechanistically linked to the pathophysiology of IBD (34). We believe GZMB PET imaging can potentially answer this unmet need as it mechanistically targets the early phase of disease activation in IBD and, because of the rapid turnover of the target, provides high temporal resolution for imaging IBD disease activity.
We hypothesized that GZMB PET imaging could be noninvasively used to evaluate IBD activity in vivo. GZMB directly induces intestinal epithelial cell damage, disrupts the integrity of the gut barrier, and contributes to the breakdown of the intestinal mucosa in IBD (34). In addition, GZMB can promote the production of proinflammatory cytokines, such as interleukin 1β, TNF, and interleukin 18, which are involved in the inflammatory cascade in IBD (35). It modulates the function of regulatory T cells (36,37), dysregulation of which leads to further propagation of inflammation in IBD. Moreover, GZMB excretion promotes tissue damage and fibrosis (38) by activating the fibroblasts, producing excessive collagen and fibrosis in the bowel (39). We have previously shown that GZMB PET imaging could be a predictive biomarker of immunotherapy response in cancer patients (22,23). Subsequently, we showed that GZMB PET imaging can detect immune-related adverse events mechanistically due to the imbalance between immune activation and self-tolerance, similar to IBD (40). To further investigate the potential of GZMB as a biomarker for IBD disease activity and treatment response assessment, we performed bioinformatic and ex vivo analyses of IBD human samples. Bioinformatic analyses of datasets showed high GZMB gene upregulation in both active CD and UC in comparison to inactive- or non-IBD conditions. In line with our study, a similar report revealed GZMB as a top potential biomarker associated with diagnosis of rheumatoid arthritis, as another condition with a similar dysregulated immune response (41). Immunofluorescence staining of human intestinal specimens confirmed our bioinformatic analysis results by showing strong GZMB staining in active CD samples compared with quiescent IBD or normal samples. Collectively, these findings supported our hypothesis that 68Ga-NOTA-GZP PET imaging could be potentially used to assess disease activity in IBD.
Our experiments showed that intestinal uptake of 68Ga-NOTA-GZP was significantly higher in our colitis mouse model than in the controls. We showed that 68Ga-NOTA-GZP PET imaging can effectively detect GZMB in the intestinal tissue of mice with colitis, with low uptake in the normal gastrointestinal tract, which is desirable for IBD imaging. Moreover, the significant dynamic change in 68Ga-NOTA-GZP uptake over 4 wk suggests that this imaging technique could be a useful biomarker of disease activity in IBD patients, allowing for real-time assessment of active inflammation and more tailored treatment interventions. Additionally, we showed that 68Ga-NOTA-GZP uptake was significantly reduced in the group that received therapy, showing the ability of this imaging to assess the treatment response rapidly. Unlike other PET imaging modalities for detecting IBD—such as immune-PET imaging methods that focus on membranous markers such as CD69 and OX40, 18F-FDG PET/CT for inflammation (42), and 68Ga-FAPI PET/CT for fibrosis (43)—GZMB PET imaging does not merely localize immune cells, inflammation, or fibrosis lesions. Rather, GZMB PET uniquely captures immune activity, which is particularly crucial in autoimmune diseases such as IBD, for which the dynamic nature of immune responses plays a pivotal role in disease progression and management. This new technique’s ability to reflect the functional state of immune cells—specifically, their cytolytic activity—provides critical insights into the mechanisms driving inflammation and tissue damage. Unlike other imaging modalities that target membranous markers and highlight immune cell presence, GZMB imaging delves more deeply, offering a window into the effector functions of these cells. This distinction is vital for IBD, for which the spatial and temporal patterns of immune activity, rather than the mere accumulation of immune cells, dictate the course of the disease. By focusing on immune activity, GZMB PET imaging facilitates a more accurate assessment of the inflammatory status, enabling targeted interventions that can more effectively modulate the disease process.
This study had some limitations. The GZMB PET imaging was studied in only one mouse model of IBD and needs to be validated in other mouse models of IBD. However, the model was mechanistically chosen to imitate the early stages of IBD, in which a combination of mucosal barrier disruption and dysregulated response to gut antigens triggers intestinal inflammation. Therefore, we believe our findings are repeatable in other mouse models of IBD. We hope to validate these findings in human subjects with active IBD. Another limitation is that this study primarily focused on the early detection of IBD activity, and we did not explore the potential of GZMB PET imaging in monitoring acute flares of disease in the background of chronic bowel inflammation, long-term disease progression, or response to multiple treatment regimens. Future research should aim to replicate these results in clinical trials to establish the efficacy and practicality of GZMB PET imaging in routine IBD management.
CONCLUSION
GZMB PET imaging is a potentially promising approach for detecting IBD disease activity, monitoring intestinal inflammation, and assessing the treatment response to antiinflammatory medications. It might improve diagnosis certainty in difficult-to-biopsy regions of the intestine, monitor disease activity, and guide treatment regimens. These findings warrant further investigation in clinical trials to evaluate this imaging technique’s feasibility and clinical utility in IBD patients.
DISCLOSURE
This study was funded by K08CA249047 (Pedram Heidari), R01DK123143 (Umar Mahmood), and K08CA259626 (Shadi Esfahani). Umar Mahmood is a cofounder, shareholder, and consultant (scientific advisory board) of CytoSite BioPharma. No other potential conflict of interest relevant to this article was reported.
KEY POINTS
QUESTION: Does targeting GZMB with 68Ga-NOTA-GZP PET imaging provide a reliable, noninvasive method for detecting early intestinal inflammation in murine models of IBD, and can it predict treatment response?
PERTINENT FINDINGS: Bioinformatic analysis and immunofluorescence staining confirmed GZMB as a significant biomarker in IBD, showing upregulation in active human UC and CD. 68Ga-NOTA-GZP PET imaging demonstrated significantly higher uptake in IL-10−/− mice with DSS-induced colitis than in controls, with a 4-fold increase in uptake 1 wk after induction. The uptake correlated with treatment response, decreasing significantly in anti-TNF–treated models.
IMPLICATIONS FOR PATIENT CARE: The successful application of 68Ga-NOTA-GZP PET imaging to detect GZMB suggests a promising noninvasive method for early detection of IBD activity and monitoring of treatment efficacy, potentially guiding more personalized patient management strategies in clinical settings.
Footnotes
Published online May 16, 2024.
- © 2024 by the Society of Nuclear Medicine and Molecular Imaging.
REFERENCES
- Received for publication December 26, 2023.
- Accepted for publication April 18, 2024.


