


Visual Abstract

Abstract
Peptide receptor radionuclide therapy presents the possibility of tracing and quantifying the uptake of the drug in the body and performing dosimetry, potentially allowing individualization of treatment schemes. However, the details of how neuroendocrine tumors (NETs) respond to different absorbed doses are insufficiently known. Here, we investigated the relationship between tumor-absorbed dose and tumor response in a cohort of patients with NETs treated with [177Lu]Lu-DOTATATE. Methods: This was a retrospective study based on 69 tumors in 32 patients treated within a clinical trial. Dosimetry was performed at each cycle of [177Lu]Lu-DOTATATE, rendering 366 individual absorbed dose assessments. Hybrid planar–SPECT/CT imaging using [177Lu]Lu-DOTATATE was used, including quantitative SPECT reconstruction, voxel-based absorbed dose rate calculation, semiautomatic image segmentation, and partial-volume correction. Changes in tumor volume were used to determine tumor response. The volume for each tumor was manually delineated on consecutive CT scans, giving a total of 712 individual tumor volume assessments. Tumors were stratified according to grade. The relationship between absorbed dose and response was investigated using mixed-effects models and logistic regression. Tumors smaller than 4 cm3 were excluded. Results: In grade 2 NETs, a clear relationship between absorbed dose and volume reduction was observed. Our observations suggest a 90% probability of partial tumor response for an accumulated tumor-absorbed dose of at least 135 Gy. Conclusion: Our findings are in accordance with previous observations regarding the relationship between tumor shrinkage and absorbed dose. Moreover, our data suggest an absorbed dose threshold for partial response in grade 2 NETs. These observations provide valuable insights for the design of dosimetry-guided peptide receptor radionuclide therapy schemes.
For patients with metastatic somatostatin receptor–positive neuroendocrine tumors (NETs), [177Lu]Lu-DOTATATE is an essential treatment. Results from the NETTER-1 clinical trial showed an improved median survival compared with treatment with high-dose somatostatin analogs in small-intestine NETs, with relatively modest side effects (1).
According to the established treatment scheme, all patients are given the same number of cycles (4), with a fixed activity per cycle (7.4 GBq). A radiobiologic perspective, however, suggests that the treatment effect of [177Lu]Lu-DOTATATE could be improved through patient-specific dosimetry. Dosimetry takes advantage of the characteristics of the radioactive decay of 177Lu, for which there is an intrinsic proportionality between the intensities of the cell-damaging β-radiation and the measurable γ-radiation, which provides a unique opportunity to quantify, and thus individualize, treatment.
A few groups have studied individualized dosimetry-guided [177Lu]Lu-DOTATATE treatment, with the overarching goal of mitigating side effects and increasing the antitumor effect. In these studies, the cumulative administered activity was tailored to the patient, taking into consideration the absorbed dose to organs at risk, mainly the kidneys, rather than the absorbed dose to the tumors. The cumulative administered activity has been modified by either altering the number of treatment cycles (while keeping the activity per cycle fixed) or altering the activity per cycle (while keeping the number of treatment cycles fixed) (2–4). So far, these dosimetry-based [177Lu]Lu-DOTATATE studies have not produced substantial survival benefits compared with the NETTER-1 results (2,4–6), although differences in patient populations preclude direct comparison of results.
The dosimetry-guided schedules adhere to an approach that maximizes the total administered activity within the constraints set by tissues at risk. Treatment optimization according to this approach assumes that a higher cumulative administered activity also results in a higher tumor-absorbed dose, leading to a higher likelihood of tumor response. However, in a previous study, a decreasing pattern in the tumor-absorbed dose over treatment cycles was observed, which was more pronounced for grade 2 (G2) NETs than for grade 1 (G1) NETs (7), suggesting that the timing of treatment intensification during the course of treatment could potentially also be of importance.
Still, fundamental pieces of knowledge are yet lacking in view of treatment optimization. Data supporting the relationship between tumor-absorbed dose and tumor response are still scarce for NETs treated with [177Lu]Lu-DOTATATE. Existing observations suggest that tumor shrinkage becomes more pronounced with increasing absorbed doses in large pancreatic NETs (8). For small-intestine NETs, a similar observation has been made, although with an arguably weaker relationship (9,10). Nevertheless, data indicating which levels of absorbed doses are required to elicit tumor response do not yet exist, further limiting optimization of dosimetry-guided peptide receptor radionuclide therapy.
The aim of this study was to investigate parameters of importance for the response of NETs, including the total administered activity and the absorbed dose. Further aims included investigation of the existence of an absorbed dose–response relationship and the possibility of identifying a threshold absorbed dose required to elicit tumor response.
MATERIALS AND METHODS
Patient and Tumor Selection
Tumor data were derived from the Iluminet trial (NCT01456078) (2), a phase II nonrandomized clinical trial run at 2 sites in Sweden between 2011 and 2018. The study was approved by the institutional review board, and all subjects signed an informed consent form. In total, 103 patients with somatostatin receptor–expressing NETs were included. Tumors were allowed a Ki-67 index of no more than 20% (e.g., G1 and G2 tumors) based on the most recent biopsy before inclusion in the study. The included patients were given repeated cycles of [177Lu]Lu-DOTATATE (7.4 GBq) at intervals ranging from 8 to 12 wk. Kidney dosimetry was performed after each cycle. On reaching an accumulated renal biologically effective dose of 27 ± 2 Gy, no further treatment cycles were given. Patients younger than 70 y with a good renal and hematologic tolerance and no signs of tumor progression were, however, allowed to continue up to a renal biologically effective dose of 40 ± 2 Gy. In the trial, follow-up of tumor response was done according to RECIST 1.1, based on contrast-enhanced CT (CECT) imaging and in a few cases MRI. Follow-up started at baseline (the first CECT before treatment began) and continued until the patient left the study. The intervals between CECT scans were initially fixed to every 3 mo, but with longer follow-up the intervals were prolonged and in practice ranged between 3 and 12 mo.
Data in this study were derived from the 48 patients in the ILUMINET study treated at the facility in Lund. For a tumor to be eligible for analysis, it needed to be quantifiable on both baseline CECT and hybrid planar–SPECT/CT using [177Lu]Lu-DOTATATE images. Tumors with unsatisfactory dosimetry in any cycle or unsatisfactory visibility in subsequent CECT were excluded, as were skeletal tumors and tumors that progressed during treatment.
Tumor Volumetry from CT Images
Tumors were identified on all postbaseline CECT (or MRI) scans and were manually delineated using ARIA 15.6 (Varian Medical Systems, Inc.). When more than one CT contrast phase was available, the tumor was delineated in the phase where it was most readily visible throughout the range of scans. If the tumor was not sufficiently identifiable, it was excluded from the analyses, as were bone tumors. From defined volumes of interest (VOIs), tumor volumes were calculated by the software and extracted.
Tumor volumes were analyzed graphically as a function of time after baseline, and the times of the maximum ( ) and minimum (
 ) tumor volumes were identified. The relative tumor volume reduction was calculated according to
 Eq. 1
Eq. 1
In most cases,  occurred at baseline. However, in some cases,
  occurred at the next time of follow-up. Moreover, for a few tumors, the best response (
 ) occurred before the delivery of the last treatment cycle. For complementary analyses, the smallest tumor volume after treatment was then also scored.
Image-Based Dosimetry
Tumor dosimetry was based on a combination of SPECT/CT using [177Lu]Lu-DOTATATE, performed at 1 d after administration, and planar image data, with nominal acquisition times at 1, 24, 96, and 168 h. Details of the image acquisition and of the methods for activity quantification and dosimetry have been presented earlier (7) and are summarized in Supplement 1 (supplemental materials are available at http://jnm.snmjournals.org) (11–13). Tumors were selected for analysis if deemed eligible, according to the criteria for planar images detailed previously (14). The absorbed dose to each tumor was determined for each cycle. The cumulative absorbed dose was determined both as the sum until the time of best response and as the sum over all delivered cycles. Likewise, the cumulative administered activity was determined until the time of best response and over all cycles. The uncertainty in absorbed dose for each cycle was assessed similarly as in Gear et al. (15). The uncertainty in cumulative absorbed dose over the cycles was then calculated assuming independence between cycles. Further details are provided in Supplement 2.
Statistical Analysis
Tumors with a volume reduction greater than or equal to 66% were defined as responders, whereas the remaining tumors were defined as nonresponders. The cutoff volume reduction was derived from RECIST 1.1, in which a reduction of more than 30% of the sum of diameters of predetermined lesions is classified a partial tumor response (16). Translated to volume for spheres, 30% corresponds to a volume reduction of 66%.
The potential association between tumor response and the cumulative absorbed dose, as well as the cumulative administered activity, was examined by analyzing the difference between the means for responders and nonresponders. To mitigate uncertainties in the tumor-absorbed doses, which become higher for smaller volumes (15,17), a volume cutoff was set such that tumors smaller than 4 cm3 on the baseline CECT image were excluded from analysis. Since tumor grade has been previously found to affect the absorbed dose pattern over the cycles (7), separate analyses were made for grade 1 and 2 NETs. To take potential interaction between tumors in the same patient into account, a linear mixed-effects model was used to test the difference in means between responders and nonresponders, with patient identity included as a random effect. A P value of less than 0.05 was considered statistically significant. Supplement 3 provides details on the linear mixed-effects model.
For variables that exhibited a significant difference between responders and nonresponders, further analyses were made using nonlinear mixed models including both logistic regression for dichotomized response data and response-versus-dose modeling for continuous response data. Logistic regression was used to model the tumor control probability (TCP) by fitting of the logarithm of the odds ratio (Supplement 4). A patient-specific random effect was included for the intercept, and tumor grade was included as a factor. The SD in the modeled TCP was determined from the Jacobian and propagation of the covariance matrix obtained from model fitting. A 95% CI for the modeled TCP was obtained as 1.96 times the SD. Receiver operating characteristics were also analyzed to assess the consistency between observed and model-predicted probabilities for response, with a 95% CI estimated by bootstrapping with 104 bootstrap repetitions. Sensitivity and specificity were calculated for different absorbed doses. Response-versus-dose modeling was performed according to the asymptotic growth model using a nonlinear mixed model. A patient-specific random effect was included for the curve amplitude, and grade was included as a factor (Supplement 5). Normality of residuals was confirmed using a quantile–quantile plot and the Shapiro–Wilk test. Initial estimates for the model were obtained by making preliminary fits using a nonmixed model, and a 95% CI was determined in a manner corresponding to that for the logistic regression.
Statistical analyses were performed in R, version 4.2.2; mixed-effects models were implemented in package LME4 and NLME (18); significance tests were performed using emmeans, version 1.4.8-1; and receiver-operating-characteristic analyses were based on the package pROC (19).
RESULTS
Characteristics of Tumors
Initially, 275 tumors from 41 patients were included after an assessment of their visibility on baseline CECT scans and hybrid planar–SPECT/CT using [177Lu]Lu-DOTATATE images acquired during therapy. Of these, 76 tumors were excluded because they were not deemed eligible for dosimetry, 81 tumors were excluded because of limited visibility on subsequent CECT scans, and 19 tumors were excluded because of immediate progression after inclusion in the study. After these exclusions, 118 tumors from 38 patients remained. These were identified on every subsequent CECT scan and delineated. After the exclusion of all tumors smaller than 4 cm3, 69 tumors from 32 patients remained. Figure 1 demonstrates the selection process.

Schematic overview of selection of included tumors.
For the 32 patients, the time of follow-up ranged from 0.8 to 8.3 y, with a mean of 3.6 y and a median of 2.7 y. The number of cycles administered to the included patients ranged from 2 and 9, with a median of 5.5. The cumulative administered activity ranged from 15 to 67 GBq, with a median of 41 GBq.
The number of tumors per patient ranged from 1 to 9, with a median of 2. Table 1 summarizes the tumor origin and grade across patients. Of the 69 included tumors, 41 (59%) were G1 and 28 were G2 (41%). Forty-three (62%) tumors were of small-intestine origin, and 26 (38%) originated from other organs (17 from the pancreas, 5 from the lung, 1 from the right colon, and 1 from the ovaries; 2 were of unknown origin). Of the 43 tumors from the small intestine, 34 (79%) were G1 and 9 (21%) were G2. Of the 26 tumors from other organs, 7 (27%) were G1 and 19 (73%) were G2.
Tumor Origin and Grade
For all evaluated tumors, baseline volumes ranged from 4.0 to 630 cm3, with a median of 17.1 cm3. The tumor volume reduction ranged from 6.0% to 100%, with a median of 69.9%. For G1 tumors, the median tumor volume reduction was 63%, whereas for G2 it was 75%. The cumulative tumor-absorbed dose delivered until best response ranged from 22 to 368 Gy, with a median of 142 Gy. For G1, the median absorbed dose was 179 Gy (range, 35–368 Gy), and for G2 the corresponding values were 109 Gy and 22–226 Gy. The cumulative administered activity for G1 tumors was 22–67 GBq, with a median of 45 GBq. For G2 tumors, the median value was 30 GBq, with a range of 15–45 GBq.
Evaluation of Variables and Their Association with Response
Table 2 summarizes the results from analysis of the association between tumor response, cumulative administered activity, and tumor-absorbed dose, with means calculated using a linear mixed-effects model (Supplemental Eq. 1) and stratification according to tumor grade.
Cumulative Administered Activity and Absorbed Dose for G1 and G2 NETs
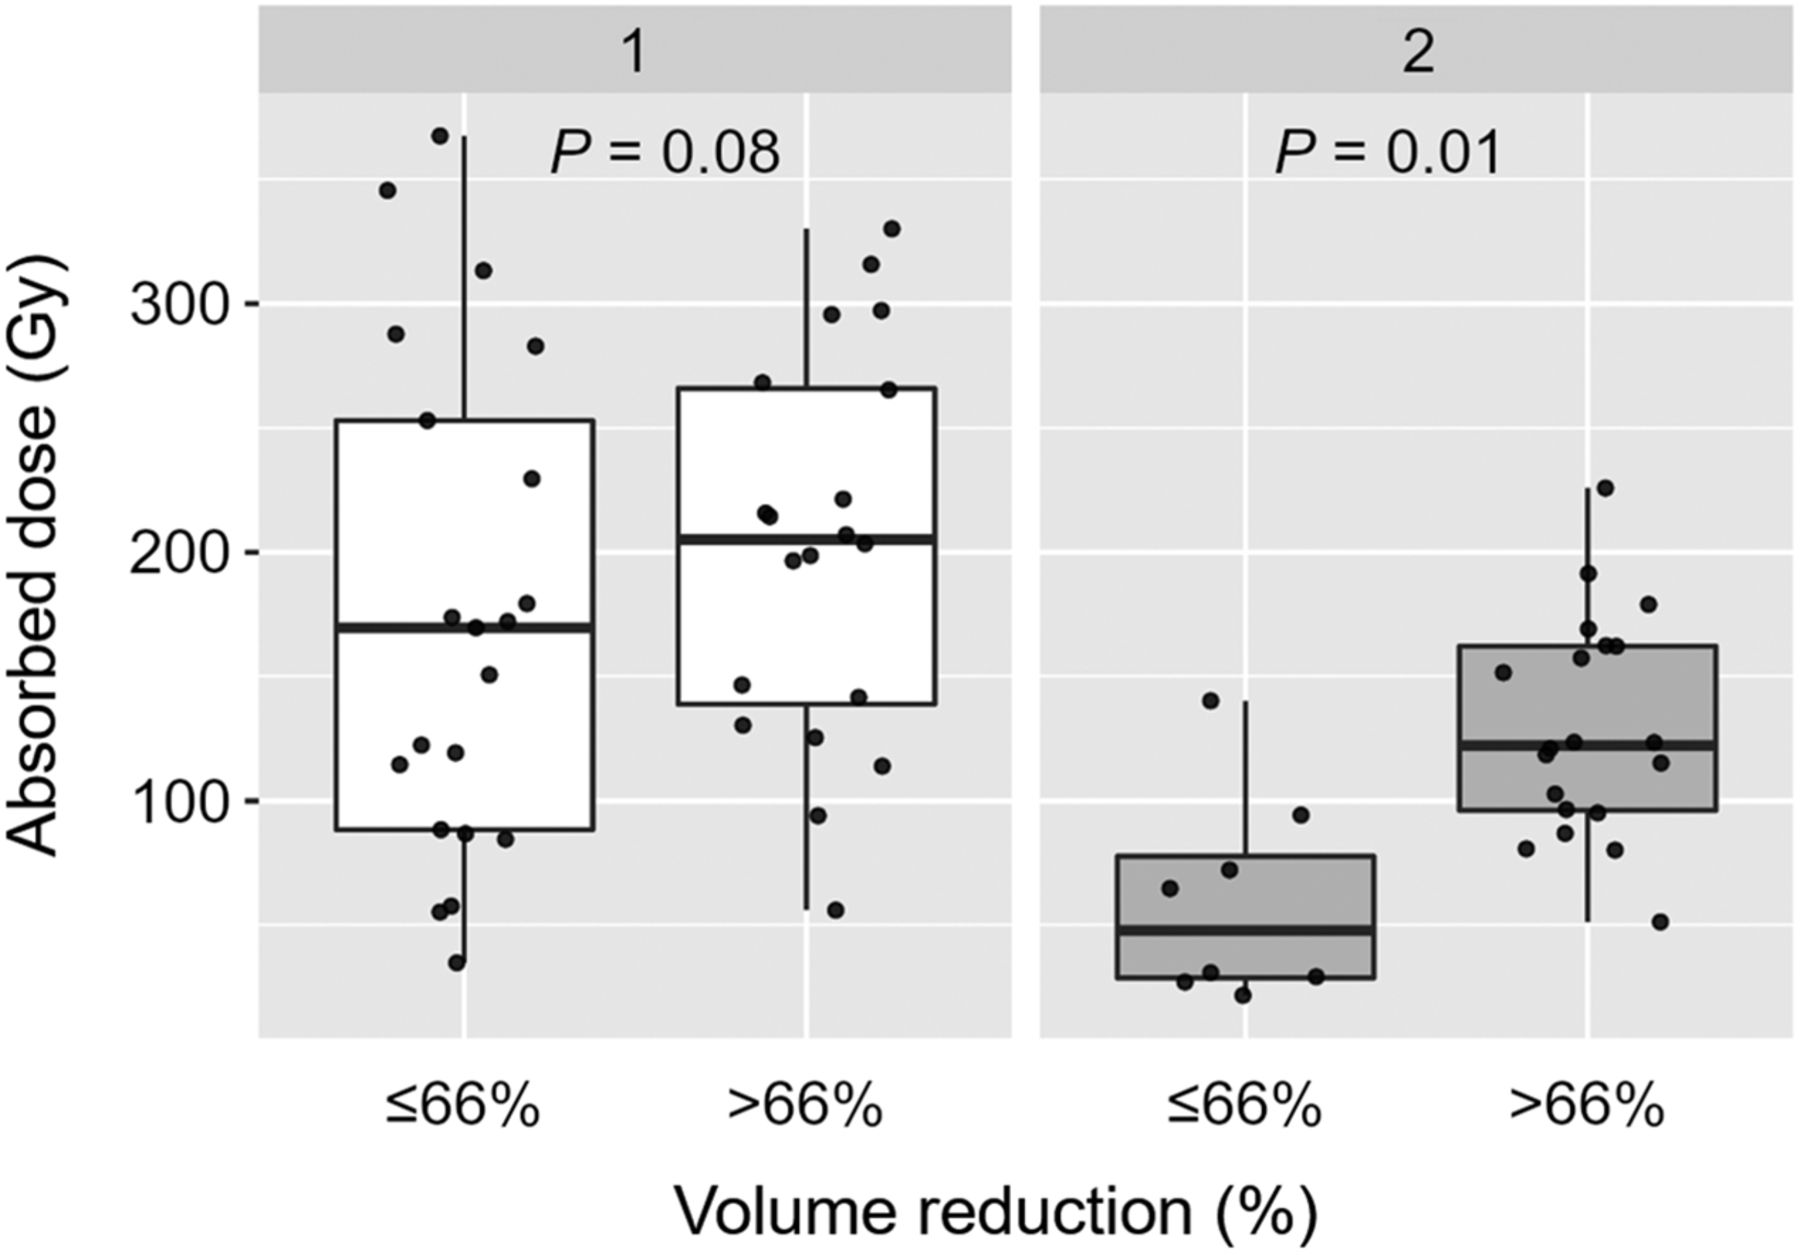
The cumulative administered activities did not significantly differ between responders and nonresponders for either G1 or G2 NETs. The mean absorbed doses were significantly higher for responding than for nonresponding G2 tumors (P = 0.01). For G1 tumors, there was a clear numeric difference, but statistical significance was not reached (P = 0.08). Figure 2 shows the absorbed dose data underlying Table 2 as box plots for G1 and G2 NETs, for responding and nonresponding tumors. For 5 tumors in 4 patients (2 G1 and 2 G2), the best response occurred before the delivery of all treatments. For this reason, complementary analyses were also performed on the association between the best response identified after treatment and the cumulative administered activity or tumor-absorbed dose over all cycles. The difference between this analysis and the results in Table 2 was thus the time when the tumor response and absorbed dose were evaluated for the 5 tumors. The results obtained were similar to those of Table 2 and Figure 3, with mean absorbed doses of 167 versus 203 Gy (G1) and 72 versus 129 Gy (G2) for nonresponders and responders, respectively. The results of the P values for differences between means were also similar, and results were thus consistent with Table 2.

Cumulative absorbed dose until best response of G1 and G2 NETs, separated by volume reduction relative to baseline of 66%. Horizontal box-lines indicate median and 25th and 75th percentiles, and whiskers indicate 1.5 times interquartile range. Markers represent individual tumor data; horizontal dispersion within each box has been introduced for purpose of visibility.

TCP for G2 NETs, as function of cumulative absorbed dose over all cycles. Tumor control was defined as 66% volumetric reduction after baseline. Colored points indicate data for individual tumors, where same color represents same patient. Black line shows result of logistic regression via mixed-effects model, and gray-shaded band indicates CI for fitted TCP curve.
Relationship Between Absorbed Dose and Response
Figure 3 shows the probability of tumor control as a function of absorbed dose for G2 NETs. As a significant difference in the absorbed doses between responders and nonresponders was not reached, corresponding analyses were not performed for G1 NETs.
Parameters describing the curve for G2 were obtained for the intercept ( in Supplement 4) to −1.44 ± 0.78 (estimate ± SE) and rate constant for dose dependence
  of 0.027 ± 0.01 Gy−1. The receiver-operating-characteristic analysis yielded an area under the curve (AUC) of 0.89 (bootstrapped CI, 0.73–1). The optimal threshold (Youden J) TCP was obtained to 65%, corresponding to a sensitivity and specificity of 0.95 and 0.75, respectively, an odds ratio of 1.85 (95% CI, 0.71–4.85), and an absorbed dose of 76 Gy. From a clinical perspective, a TCP of, for example, 90% may be considered more relevant. For an absorbed dose of 135 Gy, a TCP of 90% (95% CI, 64%–98%) was obtained, corresponding to a sensitivity and specificity of 0.4 and 0.88, respectively. The continuous data underlying Figure 3 are presented in Figure 4.

Tumor volume reduction as function of cumulative absorbed dose over all cycles to G2 NETs. Colored points indicate data for individual tumors, with same color representing same patient, and error bars indicate ±SD in cumulative absorbed dose. Black line shows result of modeling using mixed-effects asymptotic growth model, and gray-shaded band indicates CI for fitted curve.
Analysis of these data with the asymptotic growth model (Supplement 5) yielded a curve that leveled out at a volume reduction of 78%. The curve parameter determining the amplitude ( ) was obtained to 78% ± 7% (estimate ± SE), and the slope (
 ) was obtained to 32 ± 12 Gy. The relative uncertainty in cumulative absorbed dose over cycles ranged from 4% to 10%, with a mean of 5%. The major uncertainty contribution was associated with estimation of tumor volume.
DISCUSSION
Our data provide empiric insights on parameters that govern the tumor response in G1 and G2 NETs. For both grades, the administered activity was found to be less informative as a predictor than the absorbed dose was, although significance in the difference between the absorbed doses for responders and responders was not reached for G1 NETs.
Our data suggest that G2 tumors that respond well to peptide receptor radionuclide therapy generally have received a higher absorbed dose than G2 tumors that do not respond as well. In G1 tumors, similar results were observed, but without reaching significance. Although this particular observation is new, it also harmonizes well with previous data showing a dose–response relationship in the generally faster-growing pancreatic NETs but a less distinct dose–response relationship in the generally slower-growing small-intestine NETs (9,10). In our material, a majority of G1 tumors (83%) were small-intestine NETs whereas a minority of G2 tumors (32%) were small-intestine NETs. Taken together, the available data strongly suggest that there exists a relationship between response and increased absorbed doses in G2 tumors.
The cutoff in tumor volume on the baseline CECT was set to limit the influence of dosimetry uncertainties. The cutoff of 4 cm3 was established as a compromise between loss of data and dosimetry uncertainties. Notably, the absorbed doses were determined for each cycle and then summed over cycles, and the relative uncertainty in the cumulative absorbed dose was thus expected to be lower than for a single cycle. However, as a consequence, approximately 40% of the analyzed tumor data were excluded. This is considered a major limitation to this study, as the relationship between absorbed dose and response for small tumors is left unanswered. In addition to the relatively sparse number of included tumors and patients, further limitations to this study are its retrospective and nonrandomized nature. Moreover, because of the time-consuming nature of tumor volume assessment, only one observer assessed the tumor volumes, possibly making CECT volumetry susceptible to operator bias.
To further elucidate the reasons behind the negative results obtained for G1 NETs, an exploratory analysis was performed of the impact of tumor volume at baseline. As the absorbed dose was not considered for this analysis, the 4 cm3 volume cutoff was not required, and volume data on 118 tumors could be included. G1 and G2 tumors were separated into 2 groups based on their initial volume and the mean volume decrease estimated for the respective group using a linear mixed-effects model corresponding to Supplemental Equation 3.1, for different volume thresholds. Figure 5 shows box plots separated by tumor volumes below or above 30 cm3 at baseline. For G1, there was a significant difference (P = 0.001) in the mean volume reduction between the 2 groups, with means of 70% versus 48% (medians, 70% vs. 47%). For G2, there was a similar tendency, although the difference was not significant (P = 0.07), with means of 73% versus 63% (medians, 86% vs. 59%). Although data did not allow for inclusion of baseline volume as a factor for the dose–response analyses, we find the observation interesting, in particular for G1 NETs. The expression of somatostatin 2 receptors has, in preclinical studies, been shown to vary across the tumor, implying that the activity uptake can be nonuniform (20,21). Most G1 tumors originate from small-intestine cells, known to excrete profibrotic substances, possibly then affecting the distribution of active tumor cells (22). In preclinical studies, the radiobiologic response has been observed to be nonuniform, protracted, and associated with cellular senescence (20). It is reasonable to assume that the nonuniformity is more pronounced for large than small tumors. In the perspective of the mean range of the β-particles emitted from 177Lu, which is less than 0.5 mm in soft tissue, the absorbed dose distribution becomes nonuniform within the tumor, which together with a nonuniform distribution of active tumor cells may affect response. Possibly, therapy using 90Y, with a longer electron range, could counteract the effects of nonuniformity (23).

Volume reduction relative to baseline for G1 and G2 NETs, separated by 30 cm3 tumor volume at baseline. Horizontal box-lines indicate median and 25th and 75th percentiles, and whiskers indicate 1.5 times interquartile range. Markers represent individual tumor data; horizontal dispersion within each box was introduced for purpose of visibility.
To our knowledge, this was the first study to estimate the TCP in NETs treated with [177Lu]Lu-DOTATATE. Because of the small sample size, data did not allow for evaluation of the prediction capability, and the presented results would benefit from verification in an independent patient cohort. Nevertheless, our results appear to harmonize with 2 previous studies, exploring dose–response relationships in mixed populations of NET patients treated with 90Y selective internal radiation therapy (24,25). In these studies, tumor-absorbed dose cutoffs of 191.3 and 200 Gy were found to be predictive of tumor response, with 93% and 80% sensitivity, respectively (24,25). Although these absorbed doses are slightly higher than those obtained in this study, the differences in treatment mode, radionuclide, and tumor characteristics, and the relatively small sample size in all 3 studies, make our results comparable and suggest that they may be clinically applicable.
In our clinical experience, some patients with a large tumor burden and distinct tumor-related symptoms may benefit from a swift reduction in tumor volume. In these cases, we believe it advisable to aim for a total tumor-absorbed dose of at least 150 Gy. It is, however, unclear whether tumor shrinkage is the ultimate goal in the treatment of NET patients in general. Low-grade NET is generally an indolent disease in which the patient lacks debilitating symptoms for long periods but in which the tumor eventually progresses. In these cases, time to tumor growth after peptide receptor radionuclide therapy might be a more relevant response metric than tumor shrinkage. This would also provide a response metric that may be more clinically attractive and possibly more suitable for response assessment of G1/small-intestine NETs. In our material, there were too few tumors that progressed during the observation period to enable such an analysis.
CONCLUSION
Our data are in accordance with previous observations that tumor response is dependent on tumor-absorbed dose in NETs treated with [177Lu]Lu-DOTATATE. Moreover, our data suggest a TCP of 90% in tumors for an accumulated absorbed dose of at least 135 Gy. These observations provide valuable insights for the design of future dosimetry-guided peptide receptor radionuclide therapy schemes.
DISCLOSURE
Financial support was provided by the Swedish Cancer Society (211754Pj01H), Mrs. Berta Kamprad’s Foundation (FBKS-2020-13 and FBKS-2020-8), the Southern Sweden Healthcare Region (Doktorand-2021-0901), and the Gunnar Nilsson Cancer Foundation (GN-2020-16-173). Peter Bernhardt and Johanna Svensson acknowledge support from the Swedish Cancer Society, the Jubilee Clinic Cancer Research Foundation, and the Swedish federal government under the ALF agreement. No other potential conflict of interest relevant to this article was reported.
KEY POINTS
QUESTION: Is tumor response dependent on the absorbed dose in NETs treated with[177Lu]Lu-DOTATATE, and does a dose threshold for tumor response exist?
PERTINENT FINDINGS: In our retrospective study comparing dosimetry-derived tumor-absorbed doses and tumor response in NET G2 patients treated with [177Lu]Lu-DOTATATE, a statistically significant correlation between tumor response and tumor-absorbed dose was found. Moreover, a tumor-absorbed dose of 135 Gy was suggested to provide a TCP of 90%.
IMPLICATIONS FOR PATIENT CARE: Our data suggest that future dosimetry-guided treatment schemes of [177Lu]Lu-DOTATATE in NETs should aim for an accumulated tumor-absorbed dose of at least 135 Gy.
ACKNOWLEDGMENTS
We thank our coworkers Jonas Scherman, Theo Sjögreen Gleisner, Fanny Mörnsjö Centofanti, and Paula Gluchowski, as well as all patients participating in the study.
Footnotes
Published online May 9, 2024.
- © 2024 by the Society of Nuclear Medicine and Molecular Imaging.
REFERENCES
- Received for publication November 16, 2023.
- Accepted for publication March 26, 2024.
In this issue


Jump to section
Related Articles
Cited By...
- Multicycle Dosimetric Behavior and Dose-Effect Relationships in [177Lu]Lu-DOTATATE Peptide Receptor Radionuclide Therapy
- Rethinking Dosimetry: A European Perspective
- Establishing In Vitro Dosimetric Models and Dose-Effect Relationships for 177Lu-DOTATATE in Neuroendocrine Tumors
- Dosimetry Software for Theranostic Applications: Current Capabilities and Future Prospects