


Visual Abstract

Abstract
We aimed to evaluate the role of prostate-specific membrane antigen (PSMA) PET/CT for response assessment and outcome prediction in patients with metastatic castration-resistant prostate cancer (mCRPC) treated with androgen receptor pathway inhibitors (ARPIs), including abiraterone acetate or enzalutamide. Methods: We retrospectively analyzed 30 ARPI-treated mCRPC patients who underwent 68Ga-PSMA-11 PET/CT within 8 wk before (baseline) and 12 ± 4 wk after treatment initiation. Total PSMA tumor volume was calculated using the fixed threshold method (SUV ≥ 3). Patients were categorized as PSMA responders (PSMA-Rs) or PSMA nonresponders (PSMA-NRs) on the basis of both European Association of Urology/European Association of Nuclear Medicine (EAU/EANM) criteria and Response Evaluation Criteria in PSMA PET/CT (RECIP) 1.0. PSMA-R included patients with a complete response, a partial response, or stable disease, and PSMA-NR included those with progressive disease. On the basis of prostate-specific antigen (PSA), patients were classified as biochemical responders if PSA decreased by at least 50% and as nonresponders if it did not. The Φ-coefficient was used to evaluate the correlation of PSMA- and PSA-based responses. Survival analysis was performed using the Cox regression hazard model and the Kaplan–Meier method. Predictive accuracy was tested for both response criteria. Results: On the basis of PSMA PET/CT, 13 (43%) patients were PSMA-NR according to the EAU/EANM criteria and 11 (37%) patients were PSMA-NR according to RECIP 1.0. Significant correlations were observed between PSMA- and PSA-based responses for both criteria (Φ = 0.79 and 0.66, respectively). After a median follow-up of 25 mo (interquartile range, 21–43 mo), the median overall survival was significantly longer for PSMA-R than PSMA-NR (54 vs. 22 mo) for both the EAU/EANM criteria and RECIP 1.0, with hazard ratios of 6.9 (95% CI, 1.9–26; P = 0.004) and 5.6 (95% CI, 1.69–18.26, P = 0.005), respectively. No significant difference in predictive accuracy was found between the 2 criteria (C-index, 0.79 vs. 0.76, respectively, P = 0.54). Flare phenomena at the second PSMA PET study were not observed in our cohort. Conclusion: Our results demonstrate that PSMA PET/CT is a valuable imaging biomarker for response assessment and overall survival prediction when performed at 3 mo after ARPI treatment initiation in mCRPC patients. Both proposed PSMA response criteria (EAU/EANM and RECIP 1.0) seem to perform equally well. No PSMA flare was observed. Prospective validation of these findings is strongly needed.
Metastatic castration-resistant prostate cancer (mCRPC) is an aggressive disease that remains responsible for most disease-related deaths from prostate cancer. Androgen-based pathways remain essential drivers of castration-resistant prostate cancer cell growth and disease progression (1), leading to the development of androgen receptor pathway inhibitors (ARPIs) such as abiraterone acetate and enzalutamide. These agents improved overall survival (OS) and quality of life in phase III trials, leading to their implementation in the clinical guidelines for treating patients with mCRPC (2–4).
The response to abiraterone acetate and enzalutamide is evaluated mainly by measuring prostate-specific antigen (PSA) and performing conventional imaging techniques such as CT and bone scintigraphy. However, the ARPI-induced PSA flare phenomenon is frequent, making PSA a nonreliable biomarker for assessing response early and determining disease progression (5,6). Furthermore, PSA is unreliable for monitoring disease activity in prostate cancer patients who do not secrete a significant amount of PSA or have visceral metastases (7,8). Conventional imaging, including CT and bone scintigraphy, present intrinsic limitations in assessing bone metastasis response; neither method can assess response, and both are subject to flare phenomena, which can result in a false finding of disease progression (i.e., pseudoprogression) (9–11). To address the issue of bone scintigraphy flare, the Prostate Cancer Working Group 3 proposed the use of the 2 + 2 rule, which in turn may delay the detection of disease progression (9). Therefore, there is a need to find a reliable imaging biomarker for response assessment in mCRPC.
Prostate-specific membrane antigen (PSMA) imaging using PSMA-ligand radiotracers has dramatically improved prostate cancer imaging and patient management. Because of its high detection rates and specificity for prostate cancer, PSMA PET/CT has been incorporated into guidelines for the initial staging of intermediate- and high-risk PCa, for disease detection in biochemical recurrence, and for selection of patients for PSMA-targeted radionuclide therapy (12). The use of PSMA imaging for response assessment has not yet been validated and is still being researched. Scarce literature data so far have shown promising results on using PSMA PET for monitoring systemic therapies and predicting patient outcomes in mCRPC (13–15). Various proposals have emerged for defining the response status in prostate cancer using PSMA PET (16–18). The PSMA PET progression criteria were introduced in 2020 and later were endorsed by the European Association of Urology/European Association of Nuclear Medicine (EAU/EANM) and adopted into their consensus statements (16). Subsequently, the Response Evaluation Criteria in PSMA PET/CT (RECIP) 1.0 were developed specifically for patients undergoing 177Lu-PSMA radioligand therapy (18). To facilitate the use of PSMA imaging for response assessment in clinical trials, the Prostate Cancer Molecular Imaging Standardized Evaluation, version 2, suggests using PSMA PET progression criteria for early disease and metastatic hormone-sensitive prostate cancer and RECIP 1.0 for mCRPC (19). However, none of these criteria have been tested or validated in patients treated with ARPIs.
Preclinical studies have shown that androgen receptor inhibition may initially increase PSMA expression on the prostate cancer cell surface (20–22). Several clinical studies have reported that ARPIs induce PSMA upregulation for a few days after treatment initiation (22–25). However, there are still no data about the association of these early PSMA changes with patient outcomes. On the other hand, previous studies have shown no PSMA upregulation, the so-called flare phenomenon, if evaluated late—at a median of 3 mo after initiation of abiraterone acetate or enzalutamide (26,27). Moreover, there are few data—and those that exist are inconclusive—about the role of PSMA PET/CT in assessing response to ARPIs and about any association with patient outcomes. To address this unmet clinical need, we aimed to explore the potential role of PSMA PET/CT in response assessment and outcome prediction in patients with mCRPC treated with ARPIs, including abiraterone acetate or enzalutamide.
MATERIALS AND METHODS
Patients
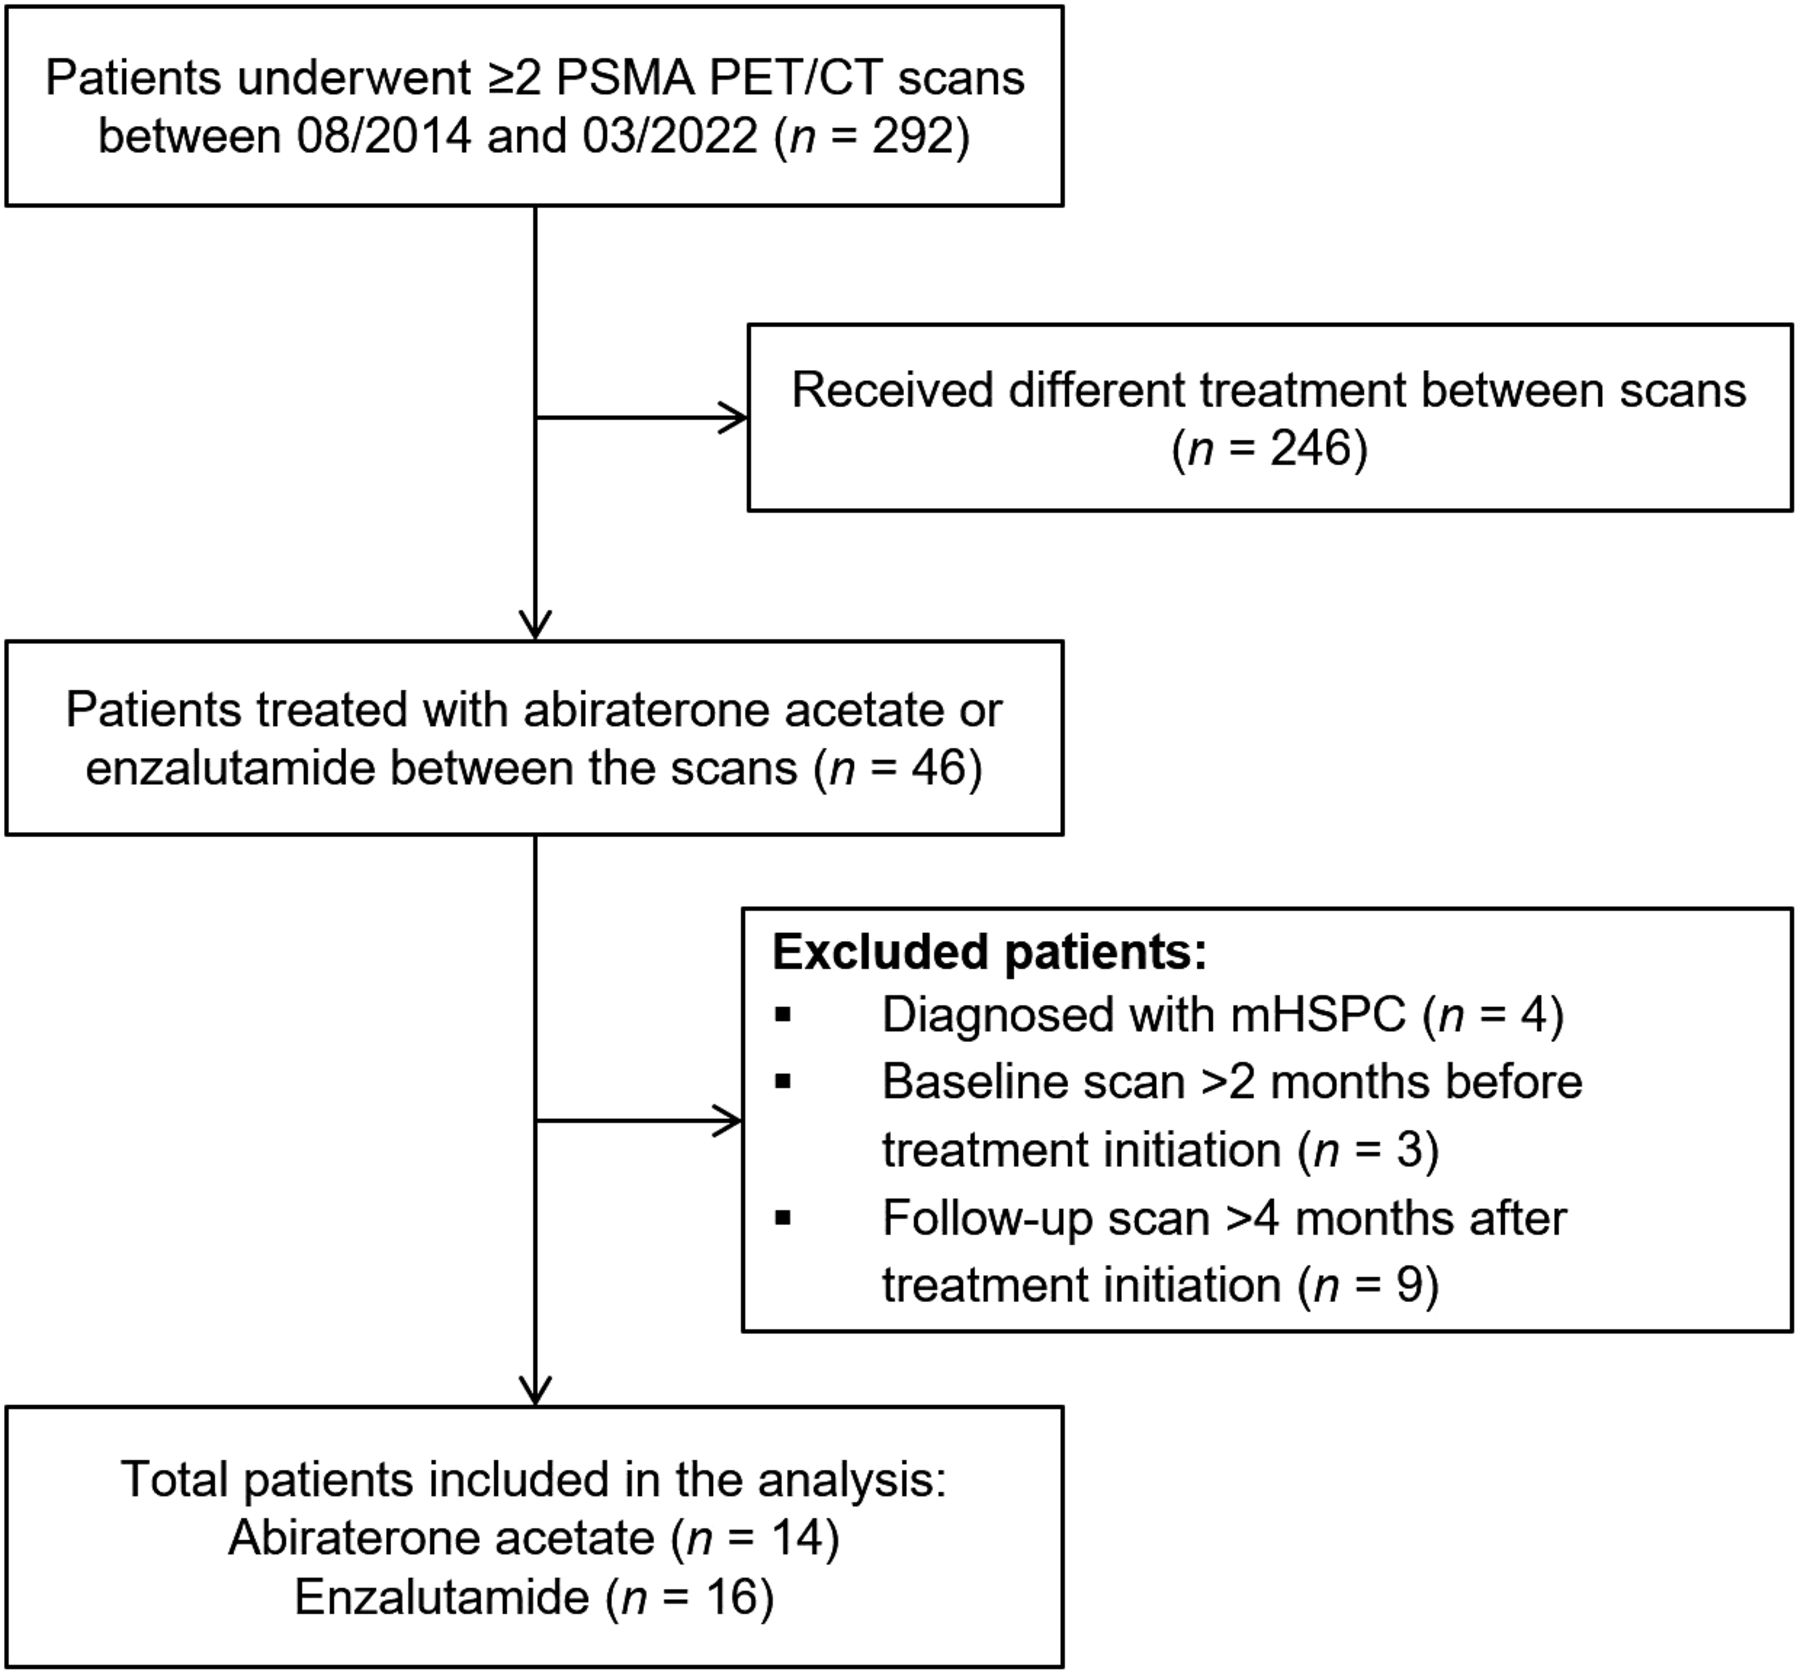
For this single-center retrospective study, we analyzed our PSMA PET/CT database for patients seen between November 2014 and March 2022. Patients considered eligible for analysis had to have been diagnosed with mCRPC, have been treated with either abiraterone acetate or enzalutamide, and have undergone baseline PSMA PET/CT within 8 wk before and 12 ± 4 wk after treatment initiation (Fig. 1). Demographic data and baseline clinical factors were recorded for each patient. The study was approved by the Ethics Committee of Institute Jules Bordet and was conducted according to standard good clinical practices and the 1964 Declaration of Helsinki.

Flowchart showing process of patient selection for study analysis. mHSPC = metastatic hormone-sensitive prostate cancer.
PET/CT Image Acquisition
The PET/CT images were acquired using a GE Healthcare Discovery 690 time-of-flight scanner approximately 1 h after administration of an average 68Ga-PSMA-11 dose of 1.9 ± 0.3 MBq/kg. PET images were acquired in 3-dimensional mode covering the mid thigh to the skull vertex, for 2 min at each bed position. Ordered-subsets expectation maximization with 2 iterations and 24 subsets, along with a 6.8-mm gaussian filter, was used to reconstruct the PET data. A low-dose CT scan was performed without contrast medium for attenuation correction and anatomic orientation, using an x-ray tube voltage of 120 kVp (30–250 mA).
68Ga-PSMA PET/CT Image Analysis
Two nuclear medicine physicians with more than 3 y of expertise in PSMA PET/CT analyzed the images. Maximum-intensity projections, as well as axial, sagittal, and coronal images, were visually analyzed for new lesions. A new lesion was defined as any suggestive focus of PSMA uptake higher than the background level on the follow-up PSMA PET/CT scan. Semiautomatic quantification of the total PSMA tumor volume (PSMA-TV) was performed on the baseline and follow-up PSMA PET/CT scans using MIM software (Fig. 2). The PSMA-TV parameter was obtained after segmenting whole-body tumor volume using the proposed SUV threshold of at least 3 (13). Manual corrections were performed to exclude any sites of physiologic uptake. Percentage changes in PSMA-TV were calculated using the following formula:


Patient A had multiple new lesions and significant increase in PSMA-TV of >100% (PSMA-NR). Patient A died 14 mo after starting therapy. Conversely, patient B had disappearance of most lesions and decrease in PSMA-TV by >30% (PSMA-R). Patient B died after 40 mo. Follow-up scans (on right) were performed at 112 d for patient A and 91 d for patient B after their first treatment. Intensity scale bars are SUV.
PSMA PET/CT Response Classification
PSMA-based responses were defined on a patient basis following the EAU/EANM recommendations (16) for PSMA response assessment, with complete response being defined as absence of PSMA uptake; partial response, as a PSMA-TV decline of 30% or more from baseline, with no new lesions; progressive disease, as a PSMA-TV increase of 30% or more from baseline or the appearance of at least 2 new lesions; and stable disease, as neither a 30% change in PSMA-TV nor new lesions. Patients were stratified as PSMA responders (PSMA-Rs; patients with complete response, partial response, or stable disease) or PSMA nonresponders (PSMA-NRs; patients with progressive disease) (Fig. 2) (16).
Following the same approach, patients were categorized as PSMA-Rs or PSMA-NRs on the basis of the newly proposed RECIP 1.0 (18). The main difference lies in how progressive disease is defined by RECIP 1.0—an increase in PSMA-TV by more than 20% accompanied by at least 2 new lesions.
Biochemical (PSA-Based) Response
Serum PSA measurements were performed concurrently (±1 wk) with PSMA PET/CT, at baseline and at follow up. PSA response status was based on PSA percentage changes between baseline and follow-up according to the classification of Prostate Cancer Working Group 3 (9): patients were classified as biochemical responders if PSA decreased by at least 50% from baseline and as biochemical nonresponder otherwise. PSA-based responses were evaluable in 28 patients with PSA-secreting disease.
Statistical Analysis
The statistical analyses were performed using SPSS Statistics version 27.0 (IBM). Continuous data are presented as median and interquartile range (IQR), and categoric variables are presented as relative frequencies. The correlation between categoric PSMA-based and PSA-based responses was tested using the Φ-coefficient.
OS was defined as the time from treatment initiation until death from any cause or the last follow-up. The survival probabilities were estimated using the Kaplan–Meier method and compared using the Log-rank test. The relationship between PSMA-based response and OS was tested using the Cox regression hazard model. The predictive accuracies of the proposed response criteria and the PSMA-TV cutoff were tested using the Harrell concordance index (C-index) by the survival package on R studio (28,29). Finally, survival analyses for biochemical PSA response (PSA-R vs. PSA-NR) and for different ARPI treatments (abiraterone vs. enzalutamide) were performed and are presented in the supplemental materials (available at http://jnm.snmjournals.org). All statistical tests were 2-sided, and a P value of less than 0.05 was considered significant.
RESULTS
Patient Characteristics
The study cohort comprised 30 men with mCRPC fulfilling the predefined inclusion criteria; 14 patients were treated with abiraterone and 16 with enzalutamide. Patient characteristics are presented in detail in Table 1. Baseline PSMA PET/CT scans were performed at a median of 9 d (IQR, 8–21 d) before treatment initiation, and the follow-up scans were performed at a median of 3 mo (IQR, 2.6–3.6 mo) after treatment commencement. Patients were followed up for a median of 25 mo (IQR, 21–43 mo), and 13 died at the time of the study analysis, with a 67% (95% CI, 52%–89%) 2-y OS.
Patient Characteristics
Concordance Between PSMA-Based and PSA-Based Response
PSA-based and PSMA-based responses according to the EAU/EANM criteria were concordant in 25 (89%) patients (Φ = 0.79, P = 0.001) and discordant in 3 patients (2 biochemical nonresponders/PSMA-Rs and 1 biochemical responder/PSMA-NR). Details of discordant patients are presented in Table 2, including late follow-up and OS. When defining the PSMA-based responses according to RECIP 1.0, concordance was found in 23 (82%) patients (Φ = 0.66, P = 0.001) (Table 3).
Patients with Discordant PSMA/PSA-Based Responses
Correlation Between PSMA-Based and PSA-Based Response Status
PSMA-Based Response Criteria and Their Association with OS
The median PSMA-TV percentage change was −11% (IQR, −44% to 53%). Figure 3 and Supplemental Table 1 present the individual PSMA-TV percentage changes among all patients. Of all patients, 17 were PSMA-R, with a median PSMA-TV change of −40%. Of these, 1 patient achieved a complete response, 10 patients showed a partial response, and 6 patients had stable disease. In addition, 13 patients were PSMA-NR and presented with a median PSMA-TV change of +61%, with 12 of 13 PSMA-NRs having at least 2 new lesions.

Waterfall charts of percentage changes for PSMA-TV.
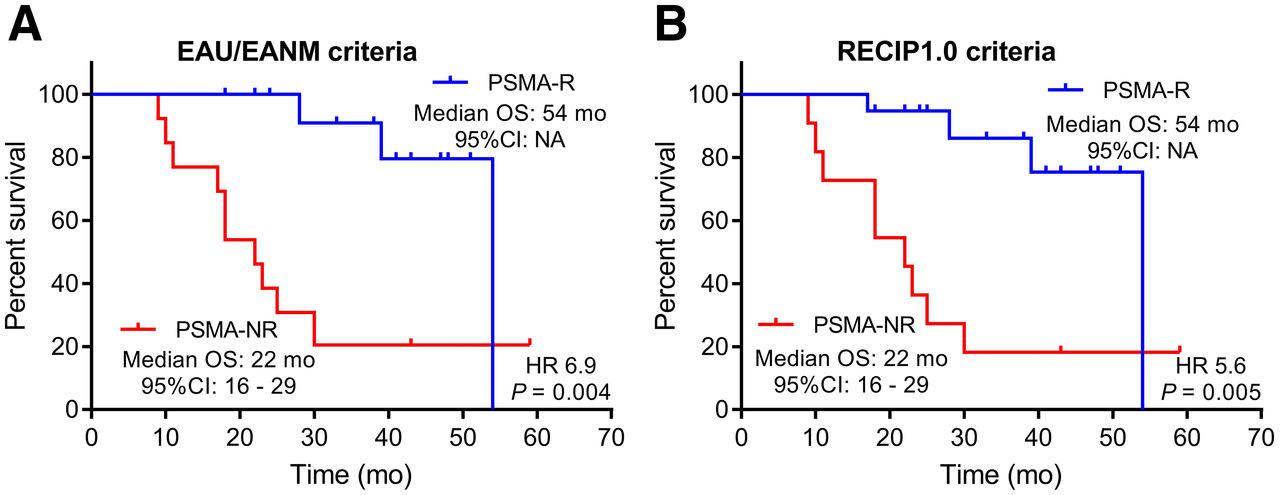
The PSMA-based response, according to the EANM/EAU recommendations, presented an excellent ability to predict patient outcomes, with a C-index of 0.79 (95% CI, 0.71–0.87). Furthermore, the PSMA-NR group had a significantly higher risk of death than the PSMA-R group (hazard ratio, 6.9; 95% CI, 1.9–26; P = 0.004), with a median OS of 22 versus 54 mo, respectively, and a 2-y OS probability of 38% versus 100%, respectively (Fig. 4).

Kaplan–Meier plots of OS for all patients according to response status of PSMA-Rs vs. PSMA-NRs as defined following EAU/EANM criteria (A) and RECIP 1.0 (B). HR = hazard ratio.
Similar results were found when using the recently proposed RECIP 1.0, with a median OS of 22 mo versus 54 mo for PSMA-R and PSMA-NR, respectively (hazard ratio, 5.6; 95% CI, 1.69–18.26; P = 0.005). RECIP 1.0 also demonstrated excellent predictive accuracy, with a C-index of 0.76 (95% CI, 0.65–0.88), slightly lower than, but not significantly different from, the EAU/EANM criteria (P = 0.54) (Table 4).
Cox Regression Analyses for PSMA-Based Response Status According to EAU/EANM Criteria and RECIP 1.0
DISCUSSION
PSMA-targeted imaging has revolutionized the imaging of PCa, showing higher sensitivity and specificity than conventional imaging modalities, such as CT and bone scintigraphy, in evaluating disease extent. These advantages allow PSMA PET/CT to provide earlier detection and more accurate assessment of therapeutic effectiveness and disease progression. Previous studies have demonstrated the potential of PSMA PET/CT in assessing response and predicting outcomes in the settings of taxane-based chemotherapy (13), 223Ra treatment (30), and PSMA-targeted radioligand therapy (18,31). In the present study, we evaluated the value of PSMA PET/CT in assessing response to ARPIs (abiraterone or enzalutamide) and its ability to predict patient outcomes. The results demonstrated that the PSMA PET/CT response at 3 mo after initiation of ARPIs is a predictor of patient outcome: patients who were PSMA-Rs had a significantly longer OS (median, 54 mo) and a lower risk of death than those who were PSMA-NRs (median OS, 22 mo). These data demonstrate that PCa-cell molecular PSMA changes that originally relied on cell viability could represent therapeutic effectiveness. This advantage is clinically meaningful, particularly in mCRPC, for which conventional imaging tools are inaccurate.
The recent Prostate Cancer Molecular Imaging Standardized Evaluation guideline, version 2, recommends using PSMA PET progression criteria for evaluating the treatment response in early metastatic disease and metastatic hormone-sensitive prostate cancer, whereas RECIP 1.0 are to be used for mCRPC (19). The PSMA PET progression criteria have been endorsed by EAU/EANM consensus statements that have shown excellent predictive accuracy in this analysis (16,17). The only difference between the PSMA PET progression criteria and the EAU/EANM criteria is that the former recommend considering not only imaging results but also laboratory results in the assessment of progression. However, the specific cutoffs for determining progression for laboratory factors have not been clearly defined, leaving physicians and researchers to use arbitrary values. Moreover, RECIP 1.0 have not been tested outside 177Lu-PSMA radioligand therapy. Our study, for the first time, to our knowledge, showed that RECIP 1.0 are also applicable in the setting of APRI treatment, demonstrating excellent predictive accuracy, with a C-index of 0.76, which is higher than that reported previously in the setting of 177Lu-PSMA radioligand therapy (C-index, 0.63) (18). These findings suggest that RECIP 1.0 are more broadly applicable for evaluating treatment response in mCRPC. A recent study highlighted a robust concordance between the quantitative and qualitative evaluations of RECIP 1.0 (32). This concordance implies that integration of these criteria into the regular clinical workflow is feasible, potentially simplifying procedures and reducing the time demands of quantitative analysis. However, although quantitative assessment offers greater objectivity, relying solely on visual assessment might be influenced by reader subjectivity. Consequently, there is an urgent need for further validation within larger cohorts. However, when compared with the EAU/EANM criteria, RECIP 1.0 are more restrictive in the definition of progressive disease because there is a need for both an increase in volume and an increase in the number of lesions. This may be the reason that fewer patients with progressive disease were identified using RECIP 1.0. However, that difference was not associated with an increased hazard ratio compared with the EAU/EANM criteria, which performed equally well. Nonetheless, the observations in this study show the need to determine which criteria are better for assessing response to ARPIs using PSMA PET/CT in mCRPC.
A previous study evaluated the utility of PSMA PET/CT for response assessment in 16 mCRPC patients treated with abiraterone or enzalutamide. The authors measured the change in SUVmax in all lesions and found that the sum of the percentage of SUVmax and the absolute change in SUVmax predicted OS and the time to a change in treatment (33). However, that study was conducted on a small cohort and used whole-body SUVmax rather than tumor volume, making it challenging to draw any pragmatic conclusion. In contrast, the current study was conducted on a larger population (30 individuals) and used response assessment criteria based on the PSMA volume change and new lesions, demonstrating excellent predictive accuracy. Furthermore, a previous study showed that PSMA-TV is superior to SUVmax for assessing the response on PSMA PET/CT in mCRPC patients receiving taxane-based chemotherapy (13). Even though SUVmax is easy to apply and widely used in PET/CT, it cannot provide a comprehensive response evaluation of tumors in the whole body, similar to PSMA-TV, given that most mCRPC patients have multiple metastases, which make response assessment on a lesion basis more challenging. The advent of commercial software equipped with artificial intelligence–assisted workflows has facilitated the measurement of PSMA-TV and reduced the time and effort involved.
A second significant observation of our study was the lack of a flare (pseudoprogression) on PSMA response PET/CT when performed 3 mo after ARPI initiation. Observed PSMA increases were significantly associated with worse outcomes. The 3-mo waiting period seems long enough to avoid early ARPI-induced PSMA upregulation and false interpretations of pseudoprogression, which could lead to premature discontinuation or modification of potentially effective treatment (16). Several preclinical studies have reported that androgen receptor knockdown results in PSMA upregulation in prostate cancer cell lines (22,34–36). Moreover, clinical studies have shown a heterogeneous increase in PSMA expression during the first month after ARPIs begin (24,25). In fact, PSMA is upregulated by the folate hydrolase 1 gene, and its suppression results in downregulation of PSMA expression (37). However, blocking the androgen receptor releases suppression of the folate hydrolase 1 gene, thereby temporarily increasing PSMA expression (22,35). These data could partly explain the temporary increase in PSMA after administration of ARPIs. More research is needed to elucidate the exact mechanisms behind the ARPI-induced PSMA upregulation (biology, starting time, and duration).
PSMA flare is unlikely to be present 3 mo after the start of ARPI treatment. Long-term blocking of the androgen receptor–mediated cell growth pathway could reduce viable cells because of cell apoptosis or death (3,34,38). Consequently, after blocking of the androgen receptor for a long time, one would expect a reduction in volumetric PSMA expression in responding disease and vice versa in nonresponding disease. Our previous study found no PSMA flare at a median of 3 mo in mCRPC patients treated with abiraterone or enzalutamide (26). Similar findings have been seen in another study, which found an increase in PSMA expression in a few patients at 4 wk after ARPI initiation but not at 12 wk (27). We believe the recommended timing—12 wk after treatment initiation—for response assessment in prostate cancer using conventional imaging (9) can also be used for PSMA PET/CT in the ARPI setting. The expert panel from an advanced prostate cancer consensus conference recommends performing CT and bone scintigraphy at least every 6 mo, regardless of any clinical symptoms, whereas the EAU recommends using the criteria of the Prostate Cancer Working Group 3 (39,40). Notably, the use of PSMA PET for treatment monitoring can improve patient clinical outcomes and reduce costs, thanks to increased accuracy and cost-effectiveness compared with conventional imaging techniques (41).
Another important study observation was that PSA and PSMA responses were highly correlated. Only 3 (10%) patients in this study had discordant PSMA and PSA responses. This could be due to the presence of patients with low–PSA-secreting disease, which can be present in up to 10%–20% of mCRPC patients (42). Indeed, the mechanism of PSA secretion is different and dissociated from that of PSMA expression in prostate cancer cells. To date, there is no clear explanation for the relationship between the PSA secretion mechanisms and PSMA expression, and there are even some case reports showing high PSMA expression in patients with neuroendocrine dedifferentiation and low PSA levels (43). Further preclinical investigations are still needed to elucidate these mechanisms. On the other hand, to date, there is no validated PSMA-TV change cutoff to determine the disease’s progression or response. A 30% change cutoff was recommended in the EAU/EANM criteria and 20% in RECIP 1.0, and indeed, both presented comparable predictive accuracies in this study (Supplemental Table 2). The differences in predictive accuracy between different PSMA-TV cutoffs should be interpreted with caution because of the small sample size of the analyzed cohort but may serve as a means to generate hypotheses for further evaluation in larger studies.
This study had potential limitations, such as its retrospective nature, small sample size, and nonsystematic use of PSMA PET/CT for response assessment in routine practice, which could induce a selection bias. Despite these limitations, the study demonstrated critical preliminary data on the use of PSMA PET/CT to assess the response of mCRPC to ARPI treatment—data that can guide future research. Other limitations stem from the complexity of the mCRPC disease presentation and the lack of validated standardized response criteria on PSMA PET/CT.
CONCLUSION
Our study demonstrated that PSMA-based response measured 3 mo after ARPI treatment initiation predicts patient prognosis. Both proposed PSMA response criteria (EAU/EANM and RECIP 1.0) seem to perform equally well. No PSMA flare phenomenon was observed. These findings need further validation in prospective studies.
DISCLOSURE
This work was supported by a grant from la Fondation Contre le Cancer, a Belgian national cancer research foundation. Additionally, Qaid Ahmed Shagera has been granted funding from the same foundation as a fellow investigator. No other potential conflict of interest relevant to this article was reported.
KEY POINTS
QUESTION: Can PSMA PET/CT assess the response to ARPIs in patients with mCRPC?
PERTINENT FINDINGS: In 30 patients with mCRPC undergoing treatment with abiraterone acetate or enzalutamide, the PSMA-based response was predictive of patient outcomes. Patients with no response on PSMA PET/CT had a significantly higher risk of death and a shorter OS than those with a response.
IMPLICATIONS FOR PATIENT CARE: PSMA PET/CT can be used for monitoring the therapeutic efficacy of ARPI treatment and can also provide prognostic information.
Footnotes
Published online Sep. 28, 2023.
- © 2023 by the Society of Nuclear Medicine and Molecular Imaging.
REFERENCES
- Received for publication April 14, 2023.
- Revision received September 7, 2023.
In this issue


Jump to section
Related Articles
Cited By...
- RECIP 1.0: A Roadmap for Clinical Implementation
- The Role of PSMA PET Parameters as Biomarkers for Response to PSMA-Targeted Radiopharmaceutical Therapy
- RECIP 1.0 Predicts Progression-Free Survival After [177Lu]Lu-PSMA Radiopharmaceutical Therapy in Patients with Metastatic Castration-Resistant Prostate Cancer