


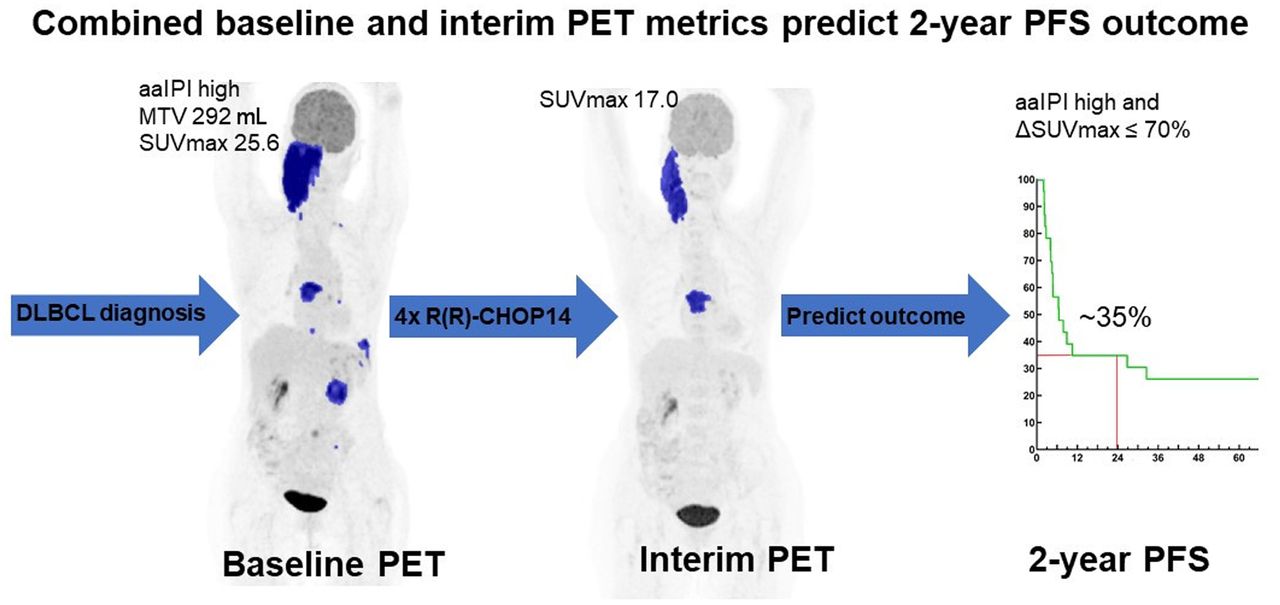
Visual Abstract

Abstract
We aimed to determine the added value of baseline metabolic tumor volume (MTV) and interim PET (I-PET) to the age-adjusted international prognostic index (aaIPI) to predict 2-y progression-free survival (PFS) in diffuse large B-cell lymphoma. Secondary objectives were to investigate optimal I-PET response criteria (using Deauville score [DS] or quantitative change in SUVmax [ΔSUVmax] between baseline and I-PET4 [observational I-PET scans after 4 cycles of rituximab, cyclophosphamide, doxorubicin, vincristine, and prednisone administered in 2-wk intervals with intensified rituximab in the first 4 cycles [R(R)-CHOP14]). Methods: I-PET4 scans in the HOVON-84 (Hemato-Oncologie voor Volwassenen Nederland [Haemato Oncology Foundation for Adults in the Netherlands]) randomized clinical trial (EudraCT 2006-005174-42) were centrally reviewed using DS (cutoff, 4–5). Additionally, ΔSUVmax (prespecified cutoff, 70%) and baseline MTV were measured. Multivariable hazard ratio (HR), positive predictive value (PPV), and negative predictive value (NPV) were obtained for 2-y PFS. Results: In total, 513 I-PET4 scans were reviewed according to DS, and ΔSUVmax and baseline MTV were available for 367 and 296 patients. The NPV of I-PET ranged between 82% and 86% for all PET response criteria. Univariate HR and PPV were better for ΔSUVmax (4.8% and 53%, respectively) than for DS (3.1% and 38%, respectively). aaIPI and ΔSUVmax independently predicted 2-y PFS (HR, 3.2 and 5.0, respectively); adding MTV brought about a slight improvement. Low or low-intermediate aaIPI combined with a ΔSUVmax of more than 70% (37% of patients) yielded an NPV of 93%, and the combination of high-intermediate or high aaIPI and a ΔSUVmax of 70% or less yielded a PPV of 65%. Conclusion: In this study on diffuse large B-cell lymphoma, I-PET after 4 cycles of R(R)-CHOP14 added predictive value to aaIPI for 2-y PFS, and both were independent response biomarkers in a multivariable Cox model. We externally validated that ΔSUVmax outperformed DS in 2-y PFS prediction.
Diffuse large B-cell lymphoma (DLBCL) is the most common subtype of non-Hodgkin lymphoma, characterized by an aggressive clinical course. Standard first-line treatment consists of rituximab, cyclophosphamide, doxorubicin, vincristine, and prednisone (R-CHOP) generally administered at 2-wk (R-CHOP14) or 3-wk (R-CHOP21) intervals.
No significant benefits were shown for R-CHOP14 versus R-CHOP21 in 2 large randomized clinical trials (1,2). Approximately 25%–40% of DLBCL patients experience relapse or progression in the first years after diagnosis. This problem underlines the need for early stratification between good and poor responders (3,4). An early switch to second-line treatment in poor responders might improve patient outcomes.
The international prognostic index (IPI) and age-adjusted IPI (aaIPI), both consisting of baseline clinical characteristics, have retained prognostic value after the introduction of rituximab (5). However, these prognostic indices are not widely used for individual treatment adaptation except for research purposes (6), do not inform about chemosensitivity, and are unable to identify a subgroup with survival clearly below 50%. Therefore, a powerful biomarker (e.g., imaging characteristics during treatment reflecting chemosensitivity) of early response is needed. Recently, measurement of baseline metabolic tumor volume (MTV) was reported to have prognostic value in DLBCL and was suggested as an alternative to IPI (7,8). Combining MTV with early response assessment at 18F-FDG interim PET (I-PET) further improved prediction of progression-free survival (PFS) (7,8). Several operationalizations of I-PET response criteria have been proposed, such as the visual 5-point Deauville score (DS, with various possible cutoffs) (9) and quantitative changes in 18F-FDG uptake between baseline and I-PET (10,11).
In the HOVON-84 study (Hemato-Oncologie voor Volwassenen Nederland [Haemato Oncology Foundation for Adults in the Netherlands]), DLBCL patients were randomized between R-CHOP14 and RR-CHOP14 (R-CHOP14 with intensified rituximab in the first 4 cycles) (12). In both arms, observational I-PET was performed after 4 cycles (I-PET4). To our knowledge, this was the first DLBCL randomized clinical trial in which I-PET4 results did not lead to treatment modification, which enables examination of its predictive value.
Our primary objective was to use prespecified cutoffs and methodologies from previous DLBCL studies to validate the potential added predictive value of baseline MTV and I-PET4 response to baseline clinical characteristics (aaIPI) for 2-y PFS in DLBCL in an independent study. A secondary objective was to determine the optimal I-PET4 response criteria.
MATERIALS AND METHODS
Study Population
Newly diagnosed DLBCL patients included in the HOVON-84 NHL study (EudraCT2006-005174-42, NTR1014) with I-PET4 were eligible. For this analysis, we combined the R-CHOP14 and RR-CHOP14 study arms, as there were no statistically significant outcome differences between the arms (12). Randomization was stratified for aaIPI score. The main eligibility criteria of the clinical study are described elsewhere (12,13). The HOVON-84 study was approved by the institutional review board of all centers, and participants signed an informed consent form.
Study Design
Patients at least 66 y old received 6 cycles of R-CHOP14 followed by 2 additional doses of rituximab; patients aged 65 y or less received 8 cycles of R-CHOP14. Baseline PET was highly recommended but not mandatory. I-PET was performed after 4 cycles of R-CHOP14 or RR-CHOP14 (without treatment modifications, I-PET4).
Qualitative and Quantitative Image Analysis
Baseline PET scans were analyzed with the semiautomatic ACCURATE tool (Fig. 1) (14) to obtain MTV using a fixed SUV of at least 4.0 (15,16). Continuous MTV values had a nonnormal distribution and were log-transformed using the natural logarithm. We used both the continuous and the dichotomized MTV with a prespecified cutoff adopted from the PETAL study to identify a high-MTV group (>345 cm3) and a low-MTV group (MTV ≤ 345 cm3) (8).

Flowchart of PET scans available for I-PET4, ΔSUVmax, and baseline MTV analyses. *PET quality was acceptable when liver SUVmean was 1.3–3.0 and total image activity was between 50%–80% of total injected dose. PD = progressive disease.
I-PET4 scans were centrally reviewed by 2 independent reviewers from a pool of 10 reviewers (13) according to DS criteria (9,17). Discrepancies were resolved by adjudication. DS4–5 was categorized as no complete metabolic response (PET-positive), and DS1–3 was categorized as complete metabolic response (PET-negative) (9,17). DS4 was assigned when tumor SUVmax exceeded hepatic SUVmax by fewer than 3 times, and DS5 was assigned when there were new lymphoma lesions or when tumor SUVmax was 3 or more times hepatic SUVmax (9). The accuracy of other DS cutoffs (i.e., 1 vs. 2–5, 1–2 vs. 3–5, and 1–4 vs. 5) for I-PET4 were evaluated in sensitivity analyses.
In patients with a baseline PET scan and an I-PET4 scan with DS2–5, we measured the change in SUVmax between baseline and I-PET4 (ΔSUVmax). For DS1, ΔSUVmax was set at 100% reduction (9). We applied a prespecified ΔSUVmax cutoff of 70% reduction between baseline and I-PET4 to define a positive (≤70%) or negative (>70%) I-PET result (10).
Statistical Analysis
The primary outcome measure was 2-y PFS, defined as time from randomization to disease progression, relapse, or death from any cause within 2 y (18). Survival curves were obtained with Kaplan–Meier analyses for PFS stratified by dichotomized PET response criteria and compared with log-rank tests. We used univariate and multivariable Cox proportional hazards regression models to assess the effects of baseline clinical factors (aaIPI, age, B symptoms, MTV, sex, treatment arm) and I-PET4 response criteria (DS, ΔSUVmax) on 2-y PFS. A backward Wald elimination procedure was used to test which prognostic factors were independently associated with 2-y PFS. In addition, 2 × 2 contingency tables were constructed to calculate diagnostic measures (i.e., sensitivity, specificity, positive predictive value [PPV], and negative predictive value [NPV]) to predict 2-y PFS. Sensitivity, specificity, predictive values, univariate hazard ratio (HR), and receiver-operating-characteristic curve were used to define the optimal I-PET4 response criteria to predict 2-y PFS. We examined whether the addition of baseline MTV to the multivariable Cox model improved prediction. Statistical analyses were performed using SPSS Statistics (version 22; IBM) and R (version 3.6.3). A P value of less than 0.05 was considered statistically significant.
RESULTS
Study Population
In total, 574 eligible DLBCL patients were included in the HOVON-84 study; 534 (93%) underwent I-PET4. Twenty-one I-PET4 scans were not evaluable (Fig. 1). The distribution of baseline characteristics and 2-y PFS were similar for patients with and without baseline MTV, I-PET4, and ΔSUVmax evaluations (Table 1).
Baseline Patient Characteristics
Prognostic Value of Baseline aaIPI and MTV
After a median follow-up of 91 mo (interquartile range, 84–101 mo), the estimated 2-y PFS was 79% (95% CI, 76%–83%). Most patients belonged to the low-intermediate or high-intermediate aaIPI groups (35% and 50%, respectively; Table 1). In the Kaplan–Meier analysis, both low and low-intermediate aaIPI survival curves and high-intermediate and high aaIPI survival curves crossed each other without statistically significant differences (Supplemental Fig. 1A; supplemental materials are available at http://jnm.snmjournals.org). Dichotomization into low or low-intermediate and high-intermediate or high yielded a 2-y PFS of 91% (95% CI, 87%–95%) and 71% (95% CI, 66%–76%), respectively, with a corresponding univariate HR of 3.6 (95% CI, 2.2–5.9; Supplemental Fig. 1B; Table 2).
Diagnostic and Prognostic Measures for aaIPI, Baseline MTV, Different Cutoffs of Deauville 5-Point Scale at I-PET4, and ΔSUVmax for 2-Year PFS
Of 384 patients who underwent baseline PET, baseline MTV was measurable in 296 (52%; Fig. 1). The continuous log-transformed MTV had a univariate HR of 1.4 (95% CI, 1.2–1.8; Supplemental Table 1). Patients in the low-MTV group (MTV ≤ 345 cm3, n = 137; 46%) had a 2-y PFS of 86% (95% CI, 80%–92%) versus 75% (95% CI, 68%–81%) in the high-MTV group (MTV > 345 cm3, n = 159; 54%), with a corresponding univariate HR of 2.0 (95% CI, 1.1–3.4; Table 2). I-PET and end-of-treatment PET scans were both available for 474 patients (Supplemental Table 2), with an overall agreement of 87% (95% CI, 84%–90%).
I-PET4 Analyses
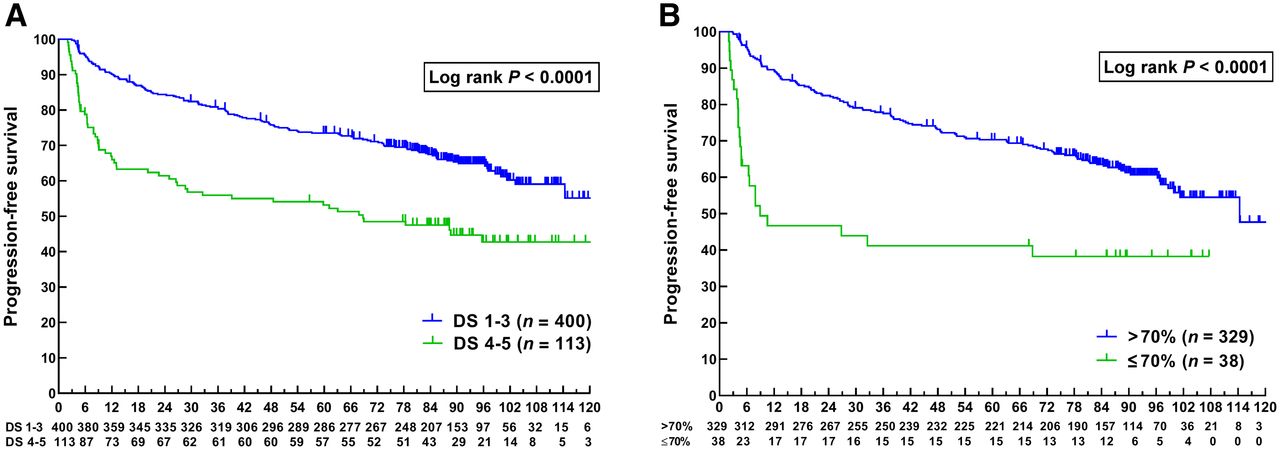
Of 513 I-PET4 scans, 113 (22%) were rated as PET-positive (no complete metabolic response). Dichotomization of I-PET4 results into DS4–5 (positive) versus DS1–3 (negative) yielded a 2-y PFS of 61% (95% CI, 52%–70%) for I-PET4–positive patients and 84% (95% CI, 81%–88%) for I-PET4–negative patients (P < 0.001), with a corresponding univariate HR of 3.1 (95% CI, 2.1–4.5; Table 2; Fig. 2A). Among the patients who experienced a relapse, the median time to relapse for I-PET4–positives was 8.1 mo (interquartile range, 4.4–23.2), versus 18.1 mo (interquartile range, 8.3–46.3) for I-PET–negatives. The corresponding PPV and NPV for 2-y PFS were 38% (95% CI, 30%–47%) and 85% (95% CI, 81%–88%), respectively.

Kaplan–Meier curves with numbers at risk for PFS in months stratified by I-PET4 result according to DS (A) and according to ΔSUVmax result (B).
Optimal I-PET4 Response Criterion
For various DS cutoffs, NPVs ranged between 82% and 85% for I-PET4 (Table 2). PPVs varied widely for different cutoffs (22%–68%); the highest PPV was seen for the DS5 cutoff in I-PET4 (68%). Also, the univariate HR of 7.4 was highest for the DS1–4 cutoff versus DS5, yielding the best separation between good and poor outcome (Supplemental Fig. 2). However, only 25 of 513 patients (5%) had a DS5.
ΔSUVmax analysis was feasible in 367 of 574 patients (64%; Fig. 1). In patients with no more than a 70% ΔSUVmax reduction between baseline and I-PET4 (n = 38, 10%), the 2-y PFS was 47% (95% CI, 31%–63%), versus 83% (95% CI, 78%–87%) for patients with more than a 70% reduction (Fig. 2B, P < 0.001), with a univariate HR of 4.8 (95% CI, 2.9–8.0). Corresponding PPVs and NPVs for 2-y PFS were 53% (95% CI, 37%–68%) and 83% (95% CI, 78%–86%), respectively (Table 2). Repeating these comparisons in the 296 patients with complete metrics on baseline MTV yielded similar results (Supplemental Table 3).
PPV and HRs were better for ΔSUVmax than for the most commonly used cutoff, DS4–5 (53% vs. 38% and 4.8 vs. 3.1, respectively). NPV was above 80% for all applied criteria. When ΔSUVmax was compared with the most commonly used DS cutoff, DS4–5, ΔSUVmax was preferred for prediction of 2-y PFS, but the highest PPV and HR were found for the DS5 cutoff.
Combined Baseline and I-PET4 Analysis
Statistically significant prognostic factors for 2-y PFS in univariate Cox regression analyses were a ΔSUVmax of 70% or less, a high-intermediate or high aaIPI, and B symptoms. In multivariable analysis, a high-intermediate or high aaIPI and no more than a 70% reduction in ΔSUVmax were independently associated with 2-y PFS (Supplemental Table 4). A low or low-intermediate aaIPI and a ΔSUVmax of more than 70% (37% of patients) resulted in an NPV of 93% (95% CI, 87%–96%), whereas a high-intermediate or high aaIPI and a ΔSUVmax of 70% or less (6% of patients) resulted in a PPV of 65% (95% CI, 45%–81%; Supplemental Fig. 3).
Dichotomized baseline MTV did not add prognostic value to ΔSUVmax and aaIPI for prediction of 2-y PFS. When continuous log-transformed MTV was added to the multivariable Cox model, aaIPI was eliminated by backward elimination, yielding log-transformed MTV, an age of more than 60 y, B symptoms, and ΔSUVmax as factors independently associated with 2-y PFS (Supplemental Table 1).
Overall Survival Analyses
The results of the response criteria and uni- and multivariable analyses for 2-y overall survival are presented in Supplemental Tables 5–7 and Supplemental Figure 4.
DISCUSSION
In this multicenter study, DLBCL I-PET after 4 cycles of R(R)-CHOP14 added predictive value to baseline clinical characteristics (aaIPI) for 2-y PFS, with high NPVs (82%–86%) independent of all I-PET response criteria. However, the PPV was still relatively low. Combining clinical and PET data showed that aaIPI and ΔSUVmax were independently associated with 2-y PFS, with HRs of 3.2 and 5.0, respectively. Adding log-transformed baseline MTV only slightly improved the predictive value combined with the ΔSUVmax response criteria. As a secondary objective, we compared the most commonly used visual and semiquantitative criteria and externally validated that ΔSUVmax criteria were the optimal I-PET4 criteria to predict 2-y PFS, with a HR of 4.8 and a PPV of 53%.
On the basis of the PPV and univariate HR in I-PET, the DS5 cutoff performed best, with a PFS clearly below 50% for the DS5 group. However, the percentage of DS5-positive patients was low (5%), but this group could be of interest for future new therapy strategies. The univariate HR for 2-y PFS with a DS4–5 cutoff in I-PET4 was 3.1 (95% CI, 2.1–4.5), which is similar to the pooled HR of 3.1 (95% CI, 2.5–3.9) in a systematic review, even though in that review I-PET was performed after 1–4 cycles of treatment and less strict I-PET response criteria were applied (19). The NPV for 2-y PFS in our study was 85%, which is in line with these previous studies generally reporting NPVs above 80% (range, 64%–95%) (19).
Two recent retrospective DLBCL studies analyzed the value of I-PET after 4 cycles (20,21), and both concluded that ΔSUVmax had a higher accuracy and PPV than DS in predicting PFS. The retrospective study from Itti et al. (n = 114, I-PET after 2 cycles), who analyzed different cutoffs for DS after 2 cycles, reported PPVs for DS4–5 and ΔSUVmax that were remarkably identical to our study (39% vs. 38% and 52% vs. 53%, respectively) (22). A DLBCL subgroup analysis of the PETAL study also reported a more favorable PPV for ΔSUVmax I-PET assessment than for Deauville assessment (23).
Baseline clinical characteristics and chemoimmunotherapy sensitivity are both relevant factors in outcome prediction. This relevancy was demonstrated in our multivariable analysis, in which aaIPI and ΔSUVmax (reflecting chemosensitivity) were both independent predictors of 2-y PFS. Again, the subgroup with both high-intermediate or high aaIPI and a ΔSUVmax of 70% or less had a PFS clearly below 50% but was relatively small (6% of all patients). Selection of a poor-risk group of only 6% is justified both from a cost awareness perspective and because it is the group most likely not be cured by standard treatment. These patients can be treated within clinical trials investigating the efficacy of new drugs.
Several relatively small retrospective studies reported inconsistent results regarding associations of clinical characteristics and I-PET results (DS or ΔSUVmax) with survival in multivariable Cox models (7,22,24). Two prospective studies concluded that only I-PET and not IPI was independently associated with event-free survival (25,26). The randomized phase III trials PETAL (I-PET after 2 cycles of R-CHOP21) and CALGB-50303 (I-PET after 2 cycles R-CHOP21 or DA-EPOCH-R [dose-adjusted etoposide, prednisone, vincristine, cyclophosphamide, doxorubicin, and rituximab]) also concluded that I-PET with ΔSUVmax (cutoff, 66%) and IPI were independent predictors for event-free survival and PFS (11,27), respectively.
Baseline MTV assessment was not a strong predictor of 2-y PFS in our study (Table 2; Supplemental Tables 1, 3, 5, and 7). We used a segmentation method applying a fixed SUV of at least 4.0, on the basis of a recent study showing that this method performed best and had a discriminative power similar to that of other segmentation methods (16). Addition of dichotomized baseline MTV (345-cm3 cutoff) to ΔSUVmax did not improve the predictive value, but log-transformed continuous MTV added some independent predictive value when combined with ΔSUVmax. In a secondary analysis of the PETAL randomized clinical trial (DLBCL subset, I-PET after 2 cycles, same MTV software and methodology as in our study), baseline MTV and ΔSUVmax were the only independent outcome predictors (8,28). We could not confirm these findings; possible explanations are the different PET timing (HOVON-84: I-PET4) or patient characteristics (HOVON-84: median age 3 y higher; advanced stage, 82% vs. 58% in PETAL). We chose a higher ΔSUVmax because the PET timing was different (I-PET4 vs. I-PET2) and to validate a formerly presented cutoff (10,20). This choice does not explain the difference in added value of MTV, since the positivity percentages were the same (10.4% vs. 9.6% in PETAL), as was the 2-y PFS for the positive (46.9% and 46.7%) and negative (80.2% and 82.5%) groups according to the ΔSUVmax criteria for HOVON-84 and PETAL, respectively. Recently, Vercellino et al. showed that a combination of high baseline MTV and high performance status (≥2) identifies an ultra-risk DLBCL population (29). We could not confirm this extra risk in our study.
There were several strengths to our study. First, to our knowledge, there are no other large, randomized trials with a homogeneous first-line treatment regimen and observational I-PET after 4 R-CHOP14 cycles. Another strength was the central review procedure for Deauville scoring, with 2 independent reviewers and a strict DS5 definition, which allowed for an analysis to determine the optimal I-PET4 response criteria (13).
On the basis of the relatively low values for PPV, escalation of treatment for the I-PET4–positive group is not yet recommend for clinical practice, but evidence in favor of I-PET–adapted treatment is clearly growing (11,30–32). The GAINED randomized clinical trial (30) enrolled 670 DLBCL patients (aged 18–60 y, aaIPI ≥ 1); I-PET2–positive/I-PET4–negative patients (n = 87) were scheduled to receive high-dose chemotherapy with autologous stem cell transplantation and had no statistically significant difference in PFS from the I-PET2–negative/I-PET4–negative patients (n = 401) who continued standard treatment. However, no firm conclusions can be made, because there was no randomization within these I-PET–adapted groups.
Because the NPV is acceptable (>80% for all criteria), reduction of treatment based on I-PET4 could be of interest, especially for low-risk and elderly patients. The randomized FLYER trial showed that in a group of 592 DLBCL patients (aged 18–60 y, no aaIPI risk factors, no bulky disease), 4 cycles of R-CHOP21 + 2 cycles of rituximab was not inferior to 6 cycles of R-CHOP21 (6), and in an exploratory analysis the international GOYA randomized clinical trial found no PFS benefit with 8 cycles of R-CHOP21 compared with 6 cycles of R-CHOP21 + 2 cycles of rituximab (31). The S1001 study presented 4 cycles of R-CHOP as the new standard for most patients with limited-stage disease (32).
CONCLUSION
In this large DLBCL study, I-PET after 4 cycles of R(R)-CHOP14 added predictive value to aaIPI for 2-y PFS, and both were independent response biomarkers in a multivariable Cox model, yielding a high NPV of 93% for 2-y PFS. Comparing the most commonly used DS and ΔSUVmax cutoffs, the optimal response criterion for I-PET4 to predict 2-y PFS was ΔSUVmax.
DISCLOSURE
This work was supported by the Alpe d’HuZes/KWF fund, provided by the Dutch Cancer Society (VU2012-5848). Pieternella Lugtenburg receives research funding from Roche, Takeda, and Servier and honoraria for advisory boards from Roche, Takeda, Servier, Genmab, Celgene, and Genentech. Josée Zijlstra receives research funding from, and is on the advisory board for, Roche. No other potential conflict of interest relevant to this article was reported.
KEY POINTS
QUESTION: What value do baseline MTV and I-PET add to aaIPI in predicting 2-y PFS in DLBCL, and what are the optimal I-PET response criteria?
PERTINENT FINDINGS: aaIPI and ΔSUVmax were independent predictors for 2-y PFS in DLBCL. Six percent of patients had a high PPV of 65% resulting in poor survival outcome. ΔSUVmax outperformed Deauville score in 2-y PFS prediction.
IMPLICATIONS FOR PATIENT CARE: The subgroup comprising the 6% of patients having a high or high-intermediate aaIPI and a 70% or less SUVmax reduction at I-PET is of interest for testing new therapy strategies in DLBCL.
Footnotes
Published online Oct. 21, 2021.
- © 2022 by the Society of Nuclear Medicine and Molecular Imaging.
REFERENCES
- Received for publication February 27, 2021.
- Revision received September 29, 2021.
In this issue


Jump to section
Related Articles
Cited By...
- Measuring Total Metabolic Tumor Volume from 18F-FDG PET: A Reality Check
- Prognostic Value of 18F-FDG PET Radiomics Features at Baseline in PET-Guided Consolidation Strategy in Diffuse Large B-Cell Lymphoma: A Machine-Learning Analysis from the GAINED Study
- Prognostic Value of 18F-FDG PET/CT in Diffuse Large B-Cell Lymphoma Treated with a Risk-Adapted Immunochemotherapy Regimen