


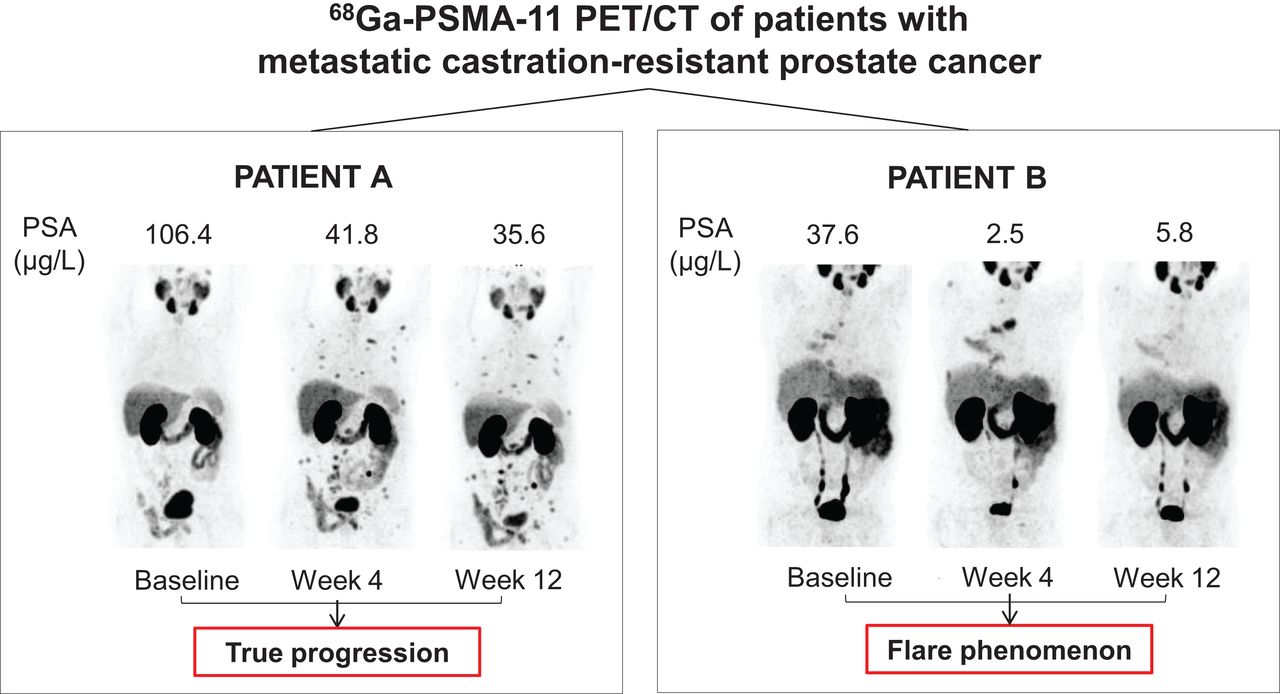
Visual Abstract
Abstract
For patients with metastatic castration-resistant prostate cancer (mCRPC), no reliable biomarkers for predicting therapeutic response or assisting in treatment selection and sequencing are currently available. Using the recent European Association of Urology and European Association of Nuclear Medicine recommendations, we aimed to compare response assessment between prostate-specific membrane antigen (PSMA) PET/CT and conventional imaging in mCRPC patients starting first-line treatment with a novel hormonal agent (NHA) and to perform a sequential comparative analysis of PSMA PET/CT–derived parameters after 4 and 12 wk of therapy. Methods: Data from 18 mCRPC patients who started NHA treatment and underwent 68Ga-PSMA-11 PET/CT before therapy initiation (baseline), at week 4 (W4), and at week 12 (W12) in addition to conventional imaging (bone scintigraphy, CT) at baseline and W12 were retrospectively included. PET/CT images were quantitatively analyzed for maximum and mean SUV and total PSMA ligand–positive lesions. Comparative analysis of PET/CT-derived parameters was performed, and patients were classified as having nonprogressive disease or progressive disease (PD) according to 68Ga-PSMA-11 PET/CT, prostate-specific antigen, and conventional imaging criteria. Results: Treatment response was evaluable by 68Ga-PSMA-11 PET/CT in 16 of 18 patients (89%) and by conventional imaging in 11 of 18 patients (61%). Five of 16 patients classified as having PD by 68Ga-PSMA-11 PET/CT at W12 had already met progression criteria at W4, and substantial agreement was observed between W4 and W12 (κ, 0.74) 68Ga-PSMA-11 PET/CT results. Nonetheless, 2 of 16 patients (13%) were incorrectly classified as having PD because of a flare phenomenon on PSMA PET/CT that disappeared at W12. Conclusion: Volumetric assessments of 68Ga-PSMA-11 PET/CT imaging can improve response evaluation in NHA-treated patients with mCRPC. Although early response assessments at W4 need to be approached with caution because of flare, 68Ga-PSMA-11 PET/CT imaging at W4 and W12 revealed substantial agreement in therapy response assessments; these findings warrant further investigation to distinguish PD from flare at W4 and help improve the understanding of resistance to therapy.
Although new imaging modalities using radionuclides have become available to—for example—evaluate tumor burden, a practical tool for improved staging and clinical decision making in metastatic castration-resistant prostate cancer (mCRPC) is urgently needed. In current clinical practice, therapy response assessment by means of conventional imaging, encompassing CT and bone scintigraphy (BS), is typically performed after 12–16 wk of therapy. However, conventional imaging has limited sensitivity and specificity for small lymph node and bone metastases, especially at low prostate-specific antigen (PSA) levels (1,2). Because of its higher accuracy, prostate-specific membrane antigen (PSMA) PET/CT has gained momentum in staging and recurrence localization compared with conventional imaging (3–5).
Recently, the European Association of Urology (EAU) in collaboration with the European Association of Nuclear Medicine (EANM) recruited a panel of international experts to reach a consensus statement for the use of PSMA PET/CT in assessing therapy response for patients with metastatic disease (6). However, semiquantitative parameters that should be used for PSMA PET/CT interpretation were not clearly defined. Moreover, the expert panel raised awareness for potential “tumor flare” phenomena after the initiation of androgen deprivation therapy and discouraged the use of PSMA PET/CT within 12 wk to avoid the misinterpretation of potential flare as progressive disease (PD).
As PSMA imaging is more widely used in clinical practice, understanding the factors underlying PSMA expression modulation is becoming increasingly important. Interestingly, factors other than exposure to androgen deprivation therapy, such as a DNA damage response gene defect (7) or activation of the PI3K-Akt pathway (8), may modulate PSMA expression. Thus, PSMA PET/CT imaging may indirectly reflect underlying molecular biology and—besides being a prognostic tool—may also serve as a predictive biomarker before biochemical progression or PD on conventional imaging (8–11). Consequently, exploring response endpoints with PSMA PET/CT might improve clinical decision making in—for example—treatment intensification for oligoresistant or oligoprogressive lesions to delay disease progression (11–13).
In the present work, we evaluated 68Ga-PSMA-11 PET/CT for the baseline assessment and monitoring of treatment response in a retrospective series of patients who had mCRPC and were starting first-line treatment with a novel hormonal agent (NHA). Additionally, the therapy response determined by 68Ga-PSMA-11 PET/CT at 12 wk was compared with the earlier response obtained at 4 wk, and individual analysis of 68Ga-PSMA-11 PET/CT–derived parameters using the proposed criteria from the expert-based consensus was performed.
MATERIALS AND METHODS
Patients
From a large internal database, files from mCRPC patients who started first-line treatment with an NHA between January 2018 and May 2021 at the University Hospital of Liège (Liège, Belgium) were retrospectively extracted and reviewed. Additional inclusion criteria comprised patients having undergone 68Ga-PSMA-11 PET/CT before NHA initiation (baseline), at week 4 (W4, ±7 d), and at week 12 (W12, ±7 d) along with conventional imaging at baseline and W12; having histologically confirmed prostate adenocarcinoma; having progressive castration-resistant disease, as defined by castration levels of testosterone (<1.7 nmol/L) and clinical, biologic, or radiographic progression conforming to Prostate Cancer Clinical Trials Working Group 3 (PCWG3) criteria (14); and having documented evidence of metastatic disease (on conventional imaging or 68Ga-PSMA-11 PET/CT) before NHA initiation. Patients who did not meet all inclusion criteria were excluded. This study was approved by the Institutional Review Board of the University Hospital of Liège, and written informed consent was obtained from all patients.
68Ga-PSMA-11 PET/CT
68Ga-PSMA-11 PET/CT images were analyzed by a nuclear medicine specialist (15 y of experience, including 7 y with PSMA PET/CT) who was unaware of the clinical data and BS results (MIM Software, version 7.0.5; MIM Software Inc.). 68Ga-PSMA-11 radiolabeling was performed as previously described (15). Image acquisition and tumor volume delineation techniques are summarized in the supplemental materials (supplemental materials are available at http://jnm.snmjournals.org) (16–19). The following semiquantitative variables were extracted for each patient: SUVmax of the hottest lesion, total PSMA ligand–positive tumor volume (PSMA-TV), SUVmean of PSMA-TV, and total PSMA ligand–positive lesions (PSMA-TL, the product of SUVmean and PSMA-TV) (20,21). In accordance with EAU/EANM recommendations, the parameters used to assess therapy response for tracer uptake and tumor volume were SUVmax and PSMA-TL, respectively.
Conventional Imaging
CT (chest–abdomen–pelvis) and BS images were analyzed according to PCWG3 recommendations (14) by a nuclear medicine specialist and a radiologist (10 y of experience) who were unaware of the clinical data and 68Ga-PSMA-11 PET/CT results. To enable therapy response assessment, patients needed to have measurable disease, defined as the presence of bone lesions on BS or at least 1 measurable lesion on CT, according to RECIST v1.1 (2).
All retrospective image interpretations (68Ga-PSMA-11 PET/CT and conventional imaging) were compared with the protocols issued prospectively as part of the follow-up: if discordances were observed, another nuclear medicine specialist and radiologist who were unaware of the clinical and imaging data were to interpret the images to reach a consensus majority (2 vs. 1).
Therapy Response Assessment
Therapy response was assessed by 68Ga-PSMA-11 PET/CT and conventional imaging using EAU/EANM PSMA PET/CT (6) and PCWG3 (2,14) criteria, respectively (Table 1). The clinical response rates after 4 wk (68Ga-PSMA-11 PET/CT) and 12 wk (68Ga-PSMA-11 PET/CT and conventional imaging) of therapy were calculated for patients with PD and those with nonprogressive disease (non-PD) by adding the numbers of patients with a complete response, a partial response, and a stable response. A biochemical response was defined according to PCWG3 criteria, and patients without PSA progression were classified as having non-PD.
Therapy Response Assessment Criteria Based on Imaging
Statistical Analysis
Categoric variables were described using relative frequencies and percentages. Mean, SD, median, range, and interquartile range (IQR) were used to describe normally and nonnormally distributed data. The primary outcome measure of PSMA PET/CT response endpoints was reported as changes at W4 and W12 by means of waterfall plots. The percentage changes in PSA, SUVmax, SUVmean, and PSMA-TL between baseline and W4 or W12 were calculated using the following formula:
Additionally, the proportions of patients categorized with non-PD or PD using PSA or conventional imaging response endpoints at 4–12 wk were reported and compared with 68Ga-PSMA-11 PET/CT response rates. Cooccurrences of W4 68Ga-PSMA-11 PET/CT, W12 68Ga-PSMA-11 PET/CT, PSA, and conventional imaging response categories were tested using the Cohen κ-coefficient. All statistical tests were performed with RStudio (version 1.1.463; RStudio), and a 2-sided P value of <0.05 was considered statistically significant.
RESULTS
Patients and Imaging
From our database, data for 165 patients who had mCRPC and were starting a first-line treatment with an NHA were extracted. A total of 144 patients were first excluded because 68Ga-PSMA-11 PET/CT was not performed or not at the required time points. Of the 21 remaining patients, 3 were further excluded for the following reasons: 2 patients were registered as having mCRPC by the clinician, but no metastatic disease was detected by either conventional imaging or 68Ga-PSMA-11 PET/CT at the time of NHA initiation, and 1 patient was found to have started his NHA therapy with a 1-mo delay, so the imaging no longer fit the inclusion criteria. Overall, 18 patients could be included for further analysis (Supplemental Fig. 1; Table 2).
Characteristics of 18 Patients at Study Entry
PET/CT scans were obtained 76.5 ± 14.8 min (mean ± SD) after intravenous injection of 154 ± 6.6 MBq of 68Ga-PSMA-11. Median time intervals between NHA initiation and baseline 68Ga-PSMA-11 PET/CT, BS, and CT scans were 10 (IQR, 6–27), 5 (IQR, 4–10), and 5 (IQR, 4–12) d, respectively. Follow-up 68Ga-PSMA-11 PET/CT scans at 4 and 12 wk from NHA initiation were obtained after median time intervals of 29 (IQR, 28–29) and 85 (IQR, 85–85) d, respectively. BS and CT scans at W12 were both acquired at a median time interval of 86 d (IQR for BS scan, 86–86; IQR for CT scan, 86–87). No disagreement was observed in the prospective and retrospective image interpretations.
Baseline Assessment of Tumor Burden and PCWG3 Clinical Subtypes
At baseline, 68Ga-PSMA-11 PET/CT detected metastatic disease in all 18 patients (100%), whereas conventional imaging identified 14 of 18 patients with metastases (78%). Overall, baseline tumor burden quantification (Supplemental Table 1) and subsequent therapy response assessment by 68Ga-PSMA-11 PET/CT could be performed in 16 of 18 patients. Two patients were not evaluable by PSMA PET: for 1 (UPN7), parameters could not be extracted because his PSMA-avid lesions were below the fixed volume threshold for delineation; the unique residual lung nodule for the other (UPN19)—highly suggestive given the diagnosis of biopsy-confirmed lung metastases from prostate cancer 3 y before the study—was visible on CT but did not show PSMA tracer uptake. Individual imaging data are listed in Supplemental Figure 2.
Finally, we determined the PCWG3 clinical subtypes using conventional imaging and 68Ga-PSMA-11 PET/CT (14,22). In 14 of 18 patients (78%), 68Ga-PSMA-11 PET/CT and conventional imaging resulted in concordant PCWG3 subtypes. 68Ga-PSMA-11 PET/CT upstaged the results for 4 of 18 patients (22%) from nonmetastatic by conventional imaging to nodal involvement. Moreover, the results for 3 patients (UPN5, UPN18, and UPN20) were upstaged from oligometastatic by conventional imaging to polymetastatic by 68Ga-PSMA-11 PET/CT.
Comparison of Therapy Response Assessments at W12
On the basis of PSA values at W12, 17 of 18 patients (94%) and 1 of 18 patients (6%) were classified as having non-PD and PD, respectively (Supplemental Table 2). Patients for whom metastatic disease was not detectable by conventional imaging at baseline (4/18) still showed no lesions at W12.
Overall, 16 of 18 patients (89%) had disease measurable by 68Ga-PSMA-11 PET/CT; this result allowed for treatment response assessment in a larger proportion of patients than conventional imaging (11/18 [61%]). The patients who were not evaluable by conventional imaging either had no metastases (4/18 [22%]) or had nonmeasurable disease (3/18 [17%]) (Table 3). Among patients who were evaluable by conventional imaging, 4 of 18 (22%) had RECIST v1.1–measurable disease; in 7 of 18 patients (39%), response assessment was BS driven because disease was not measurable on CT (2/18 [11%]) or was present only in bone (5/18 [28%]).
Therapy Response Assessment at W12 According to PCWG3 Conventional Imaging, Biochemical (PSA), and EAU/EANM PSMA PET/CT Response Criteria
Among the 11 patients who were evaluable by conventional imaging and 68Ga-PSMA-11 PET/CT at W12, we observed discordances between imaging techniques in the response categorization for 4 patients (36%) (Table 3). Three patients categorized as having PD by 68Ga-PSMA-11 PET/CT were responding to therapy according to conventional imaging, and 1 patient was categorized as having PD by conventional imaging but not by 68Ga-PSMA-11 PET/CT. The latter patient (UPN21) demonstrated a 38% increase in the sum of the largest-diameter liver metastases at W12 despite a 42% decline in PSA from baseline. The distinction between true progression and size progression related to necrosis will be clarified with follow-up. Overall, treatment responses according to conventional imaging, 68Ga-PSMA-11 PET/CT, and PSA change were concordantly categorized in 5 of 11 patients (45%). Discordant results were observed in 6 of 11 patients (55%) with PD on either conventional imaging or 68Ga-PSMA-11 PET/CT, despite a PSA response in all but 1 patient (UPN16). Individual patient data are shown in Supplemental Table 2.
Next, changes in 68Ga-PSMA-11 PET/CT–derived parameters at W12 were compared with baseline data (Fig. 1A), and concordances in response categorization according to each parameter were investigated (Supplemental Table 3A). PSMA-TL was concordant with tracer uptake (SUVmax and SUVmean) and with the appearance of ≥2 new lesions in most cases (88%; 14/16 cases), whereas the latter was concordant with SUVmax in only 12 of 16 patients (75%).

Waterfall plots of changes in PSMA PET/CT–derived parameters (SUVmean, SUVmax, PSMA-TL, PSA, and number of new lesions) at W12 (A) and W4 (Fig. 1B) in comparison to baseline PSMA PET/CT (n = 16), stratified according to PSMA-TL and therapy response assessment (i.e., non-PD in black and PD in red, as defined in Table 1). Horizontal dashed line represents ±30% cutoff. Dotted line represents cutoff at n = 2 lesions. Patients are presented in same order in A and B.
Early Therapy Response Assessments (W4) Using PSMA PET/CT
At W4, 17 of 18 patients (94%) were classified as having PSA non-PD, whereas 1 of 18 patients (6%) had PSA PD (Supplemental Table 2). As at W12, 16 of 18 patients (89%) were evaluable by 68Ga-PSMA-11 PET/CT at W4. Although only fair agreement was observed in the response categorization between 68Ga-PSMA-11 PET/CT at W4 and conventional imaging or PSA at W12, substantial agreement (κ = 0.74; P < 0.005) was observed between 68Ga-PSMA-11 PET/CT at W4 and 68Ga-PSMA-11 PET/CT at W12 (Supplemental Table 4). Overall, 7 of 16 patients (44%) were classified as having PD at W4; 5 of 16 (31%) were so classified at W12. Importantly, the 5 patients classified as having PD by 68Ga-PSMA-11 PET/CT at W12 had already fulfilled PD criteria at W4.
When 68Ga-PSMA-11 PET/CT–derived parameters were compared at W4 and W12, a larger number of discordant results was observed at W4, especially between PSMA-TL and SUVmax (Supplemental Table 3). At W4, 4 of 16 patients (25%) demonstrated an increase in the SUVmax of greater than 30%; this increase was sustained until W12 in only 1 patient (UPN12). This flare phenomenon led to incorrectly classifying 2 patients (UPN2 and UPN17) as having PD at W4 (Fig. 1B). For both patients, this flare phenomenon resolved by W12, and the patients were classified as having non-PD (Fig. 1A). Finally, unlike SUVmax, SUVmean showed few modifications at W4 (IQR, −1.0% to +10.8%) and showed no discordance between W4 and W12. It was significant only in patient UPN1, who was confirmed to have PD at W12.
DISCUSSION
Despite EAU/EANM consensus statements on PSMA PET/CT response assessment criteria (6), recommendations or guidelines on which segmentation algorithm or PSMA PET/CT–derived parameter(s) should be used are lacking. Various thresholding techniques, such as using fixed thresholds (mostly, SUVmax of greater than 3) or relative thresholds (e.g., 40%–45% of the SUVmax of the selected lesion), also exist for PET image segmentation (16–18,23). Here, we applied a combined fixed SUVmax of greater than 3 and a lesion volume threshold of greater than 0.5 mL to select and delineate PSMA-positive lesions. Although potential misinterpretation of background foci as small lesions was avoided in this way, this approach underestimated the number of liver metastases in 2 of 16 patients (12.5%) because of the difficulties in delineating lesions from the intense normal liver background activity. Combining liver-based and relative thresholds to limit image sampling errors and compensate for the spillover effect might also overcome the liver background–lesion discrimination issue (20,21). Moreover, as low-dose CT may underestimate small visceral lesions that can also be PSMA negative (24), PSMA imaging should be combined with thin-slice contrast-enhanced CT to optimize tumor burden enumeration and monitoring.
In contrast to tracer intensity of uptake, volumetric parameters were the most adequate for assessing treatment response using EAU/EANM PSMA PET/CT criteria in our dataset and the least influenced by the flare phenomenon (Supplemental Table 3). The underlying mechanism behind PSMA “flare” after androgen deprivation therapy is poorly understood. Similar to BS tumor flare definitions (25), the increase in SUVmax on 68Ga-PSMA-11 PET/CT may also lead to a concomitant increase in PSMA-TV (and, thus, PSMA-TL) because of activity spillover or emergence of previously invisible or nonsignificant lesions at baseline and may result in the misinterpretation of PD, which is why the EAU/EANM did not recommend PSMA PET/CT imaging before 12 wk. The volumetric changes associated with a flare phenomenon may be significant but remain transitory; for example, for patient UPN17, the increase in SUVmax by 54% at W4 led to the appearance of 4 new lesions and an increase in PSMA-TL by 163%. By W12, the SUVmax had decreased by 70% (i.e., 16% lower than baseline), the previously observed new lesions disappeared completely, and PSMA-TL decreased by 49% from baseline (Fig. 1).
When comparing PSMA PET/CT at W4 and W12, we made 3 observations. First, an increase in SUVmax at W4 with a decrease in PSMA-TL, with or without new lesions, was confirmed at W12 to be linked to a flare phenomenon (e.g., for patients UPN2 and UPN14). Second, new lesions at W4 without an increase of greater than 30% in SUVmax, independently of PSMA-TL, were confirmed to be progressive at W12 (e.g., for patients UPN1 and UPN13). Third, when both SUVmax and PSMA-TL increased at W4, with or without new lesions, PD could not be distinguished from flare (e.g., for patients UPN12 and UPN17). Thus, defining PD on the basis of SUVmax alone does not seem to be feasible, and SUVmax should always be evaluated in combination with the other parameters to limit misinterpretation of flare as PD. Although at early time points SUVmax may provide a hint to a nuclear medicine specialist of the presence of a flare phenomenon, no flare was observed after W12, and SUVmax at W12 did not change the therapeutic response evaluation in our cohort.
Furthermore, the EAU/EANM recommendations on the use of uptake thresholds based on PERCIST were arbitrarily chosen, as these have been validated only for 18F-FDG PET. Even though tracer uptake in PSMA imaging does not reflect direct metabolic activity, modified PERCIST criteria were shown to perform better than morphologic criteria such as RECIST in metastatic PC—as molecular changes appeared earlier than morphologic ones (26). Although the aim of the present study was not to validate PERCIST criteria in PSMA imaging, we observed that caution should be taken when those criteria are used, especially for early imaging. Indeed, changes in tracer uptake are not synonymous with PD but rather seem to reflect biomolecular changes leading to modifications in PSMA expression, as indicated by the heterogeneous responses at the patient level, and further highlight the fact that additional data are needed to shed light on the mechanisms of PSMA expression and tracer uptake. Besides flare, the modulation of PSMA expression may also reflect intrinsic tumor tissue modifications conferring potential treatment resistance (10). In our data, the 5 of 16 patients (31%) with PD at W12 according to PSMA PET/CT had already met progression criteria at W4. Two of those patients (UPN12 and UPN13) had PD according to conventional imaging, and 1 patient (UPN16) had PSA progression.
With these EAU/EANM recommendations, patients with non-PD may be further subdivided into those with a stable response, those with a partial response, and those with a complete response, depending on the reductions in both SUVmax and PSMA-TL (Table 1). However, these criteria may need to be revised, as the extent of reduction in SUVmax and volumetric parameters rarely seemed comparable (Fig. 1). For example, at W12, 4 of 11 patients would be classified with a partial response (>30% reductions in both SUVmax and volumetric parameters) and 7 of 11 patients would be classified with a stable response even though 5 of the 7 achieved a significant (>30%) reduction in PSMA-TL. Data are also lacking on the thresholds that should be used, especially to define PD. For example, according to the current recommendations, PD may be defined by a 30% increase in tumor volume, but the recently proposed RECIP criteria have set a lower threshold of 20%; in addition, these parameters have been shown to carry prognostic value after 177Lu-PSMA therapy (27). Moreover, in contrast to PERCIST, RECIP does not include tracer uptake modifications for evaluating response to 177Lu-PSMA therapy. Nonetheless, this parameter could be of potential use for improving patient stratification before therapy initiation and was recently shown to predict a higher likelihood of a response to 177Lu-PSMA therapy than to cabazitaxel (28).
The integration of minimally invasive molecular biomarkers, such as circulating tumor DNA, with novel imaging might facilitate discrimination between PD and flare and guide therapeutic intervention at early response assessment time points. As shown in a recent work, circulating tumor DNA does not seem to rise in patients with an increase in PSA or bone flare on conventional imaging (29). Additionally, the introduction of PSMA PET/CT in mCRPC might improve disease control rates by identifying oligoresistant or oligoprogressive lesions, which could be subjected to—for example—metastasis-directed therapy, while preserving the antitumoral effect of the systemic agent on the responsive lesions (12,13).
Overall, molecular imaging parameters have the potential to act as predictive biomarkers of response to treatment, but whether modifying a treatment plan according to them improves patient outcomes has yet to be determined in larger prospective trials. The main limitations of the present study were the small number of patients who were retrospectively included and the absence of validated criteria for the interpretation of PSMA PET/CT scans and the delineation method.
CONCLUSION
Volumetric assessments of PSMA PET/CT imaging can improve metastasis detection and image-based response assessment in NHA-treated patients with mCRPC. At early imaging time points, flare phenomena can be observed, typically denoted by an increase in SUVmax that resolves by W12. Overall, although early response assessments at W4 need to be approached with caution, our comparative analysis of PSMA PET/CT imaging at W4 and W12 revealed substantial agreement in the therapy response assessments, thus warranting further investigation to distinguish PD from flare at W4.
DISCLOSURE
The study was funded by a Belgium Multidisciplinary Meeting on Urological Cancers (BMUC) research grant. No other potential conflict of interest relevant to this article was reported.
KEY POINTS
QUESTION: Is the use of EAU/EANM recommendations for PSMA PET/CT feasible for therapy assessment of mCRPC patients, and can early imaging detect resistance to treatment?
PERTINENT FINDINGS: EAU/EANM recommendations improve PSMA imaging reporting and evaluation of NHA-treated mCRPC patients, but caution should be taken in the interpretation of SUVmax in early imaging. Early PSMA uptake modifications occurred as early as 4 wk after therapy and showed substantial agreement with imaging at W12.
IMPLICATIONS FOR PATIENT CARE: Early imaging may contribute to improving therapy selection and sequencing in the mCRPC context, and adding biologic biomarkers may provide further insight into the biology behind PSMA expression and help distinguish early progressive disease from flare.
Footnotes
Published online Apr. 21, 2022.
- © 2022 by the Society of Nuclear Medicine and Molecular Imaging.
REFERENCES
- Received for publication December 2, 2021.
- Revision received April 18, 2022.


