


Abstract
Tau protein aggregations are a hallmark of amyloid-associated Alzheimer disease and some forms of non–amyloid-associated frontotemporal lobar degeneration. In recent years, several tracers for in vivo tau imaging have been under evaluation. This study investigated the ability of 18F-flortaucipir PET not only to assess tau positivity but also to differentiate between amyloid-positive and -negative forms of neurodegeneration on the basis of different 18F-flortaucipir PET signatures. Methods: The 18F-flortaucipir PET data of 35 patients with amyloid-positive neurodegeneration, 19 patients with amyloid-negative neurodegeneration, and 17 healthy controls were included in a data-driven scaled subprofile model (SSM)/principal-component analysis (PCA) identifying spatial covariance patterns. SSM/PCA pattern expression strengths were tested for their ability to predict amyloid status in a receiver-operating-characteristic analysis and validated with a leave-one-out approach. Results: Pattern expression strengths predicted amyloid status with a sensitivity of 0.94 and a specificity of 0.83. A support vector machine classification based on pattern expression strengths in 2 different SSM/PCA components yielded a prediction accuracy of 98%. Anatomically, prediction performance was driven by parietooccipital gray matter in amyloid-positive patients versus predominant white matter binding in amyloid-negative patients. Conclusion: SSM/PCA-derived binding patterns of 18F-flortaucipir differentiate between amyloid-positive and -negative neurodegenerative diseases with high accuracy. 18F-flortaucipir PET alone may convey additional information equivalent to that from amyloid PET. Together with a perfusion-weighted early-phase acquisition (18F-FDG PET–equivalent), a single scan potentially contains comprehensive information on amyloid (A), tau (T), and neurodegeneration (N) status as required by recent biomarker classification algorithms (A/T/N).
Aggregation of specific proteins is a hallmark of two of the most common forms of neurodegenerative dementia, Alzheimer disease (AD) and frontotemporal lobar degeneration (FTLD). It is assumed that in AD, abundant extracellular β-amyloid plaques are present in the brain many years before symptomatic disease onset, whereas spreading of intracellular neurofibrillary tau tangles across the cortex appears to be more closely associated with neuronal injury and, thus, clinical symptoms (1,2). The advent of amyloid and tau PET tracers has therefore been a major breakthrough for accurate and early diagnosis of AD. In FTLD, on the other hand, amyloid pathology is typically absent and most cases are tau-positive, whereas most tau-negative forms are related to TAR DNA-binding protein (TDP) protein pathology (3).
However, ultrastructurally, tau protein aggregations are not uniform across disease entities. In short, in amyloid-associated disease, tau protein aggregates occur in the variant of paired helical filaments, whereas in the non–amyloid-associated disease, mainly straight filaments are present (4,5).
Recently, 18F-flortaucipir and other tau PET tracers demonstrated great potential to identify tau pathology in the living human brain (6,7). 18F-flortaucipir had originally been developed as a tracer for pathology in tau AD (paired-helical-filament tau), generally showing strong binding in affected cortical areas (6,7). 18F-flortaucipir also seems to be sensitive for non-AD tau pathology (straight-filament tau). In the behavioral variant of frontotemporal dementia, a disease mostly associated with straight-filament tau, 18F-flortaucipir shows increased binding in the cortex and subcortical white matter (WM) and gray matter (GM) (8). Complementing these findings, binding also has been demonstrated in familial cases with confirmed mutations of the microtubule‐associated protein tau (MAPT) gene (9,10). Moreover, a recent study has shown increased 18F-flortaucipir binding in the nonfluent variant of primary progressive aphasia (11), a syndrome caused by non–amyloid-related tau protein pathology in about 50% of the cases (12).
Interestingly, there is also evidence that 18F-flortaucipir has a similar affinity to TDP-43 pathology, because patients with the semantic variant of primary progressive aphasia (mostly caused by TDP-43 pathology) exhibit elevated 18F-flortaucipir binding in affected brain areas. The binding intensities in non–amyloid-associated neurodegenerative diseases seem generally lower than in AD variants (13–15).
Regardless of binding specificity to a certain type of protein pathology, 18F-flortaucipir PET might still be helpful for biomarker classification according to the A/T/N system (16). On the basis of the aforementioned data, we expect high cortical 18F-flortaucipir binding in amyloid-positive (A+/T+/N+) cases, elevated 18F-flortaucipir binding in cortical and subcortical GM and WM in amyloid-negative cases (A−/[T+]/N+), and no elevated binding in healthy subjects (T status in brackets, since 18F-flortaucipir binding does not sufficiently differentiate between the presence of tau and TDP-43 pathology). This study investigates the ability of 18F-flortaucipir PET to predict amyloid status in typical and atypical AD as well as behavioral and language variants of FTLD-type neurodegenerative diseases by a conventional voxelwise mass univariate approach, by a data-driven principal-component-analysis–based approach, and by application of a support-vector-machine–based supervised learning model.
MATERIALS AND METHODS
The protocol for the study received prior approval by the Institutional Review Board. Written informed consent was obtained from each subject.
Fifty-four patients were clinically diagnosed with typical or atypical AD (i.e., the logopenic variant of primary progressive aphasia or the behavioral variant of AD) or a variant of FTLD at the interdisciplinary center for memory disorders of the University Hospital Cologne and the Department of Psychiatry, University Hospital Bonn. The diagnosis was supported by the diagnostic 18F-FDG and amyloid PET imaging results and by the results of cerebrospinal fluid (CSF) analysis measuring amyloid and tau protein concentration. Amyloid and 18F-flortaucipir PET scans were unanimously visually classified as positive or negative by 3 experienced raters. In 13 cases (FTLD, 7; AD, 4; atypical AD, 2), CSF amyloid information but no amyloid PET data was available. The cutoff for amyloid positivity was a CSF amyloid-β 1-42 concentration of 650 pg/mL. The patient characteristics are listed in Table 1.
Patient Characteristics
The patients underwent 18F-flortaucipir (n = 54) and 18F-FDG PET (n = 51) imaging. All scans were performed at the Department of Nuclear Medicine, University Hospital Cologne, with a Biograph mCT Flow 128 Edge scanner (Siemens). A low-dose CT scan was performed for attenuation correction before the PET acquisition. All PET scans were iteratively reconstructed using a 3‐dimensional ordered-subsets expectation maximization algorithm (4 iterations, 12 subsets, gaussian filter of 5 mm in full width at half maximum, 400 × 400 matrix, and slice thickness of 3 mm). For 18F-FDG PET, a 10-min acquisition was performed 30 min after injection of 200 MBq of 18F-FDG. 18F-flortaucipir PET was acquired for 15 min, 90 min after injection of 250 MBq of 18F-flortaucipir.
All scans were processed using Statistical Parametric Mapping (SPM), version 12. PET images were registered with their corresponding attenuation-correction CT images, which were spatially normalized to the Neuro Imaging Tools and Resources Collaboratory CT template (https://www.nitrc.org/projects/clinicaltbx/). Normalization parameters were subsequently applied to the PET images. All calculations were performed in template-derived Montreal Neurological Institute 152 anatomic space. SUV ratio (SUVR) images were calculated using in-house scripts in MATLAB, version R2016a (MathWorks), using the cerebellar GM of the Hammersmith n30r83 atlas (17) as a reference region. The MRI scans were performed in the routine clinical workup of the dementia syndromes, and major vascular components were excluded before the patients were referred to the nuclear medicine department for PET imaging. However, these scans were not acquired according to a standardized protocol and therefore could not be used for image preprocessing.
18F-Flortaucipir Binding in Most Affected Regions
All regions of the atlas were divided in a WM and GM portion by voxelwise multiplication with SPM binarized tissue probability maps (threshold, 0.50) and then used in volume-of-interest analysis. For each subject and atlas region, average 18F-FDG and 18F-flortaucipir SUVR were extracted separately for WM and GM. For each subject, the GM atlas region that was most affected by neurodegeneration was identified via a search for the individually lowest SUVR in 18F-FDG PET images. Individual regions of highest cortical 18F-flortaucipir SUVR were identified analogously. GM and WM SUVRs, as well as GM/WM SUVR ratios, were compared between the A+/T+/N+ and A−/[T+]/N+ groups with 2-sample t tests.
Whole-Brain Comparisons
A voxelwise t test comparing 18F-flortaucipir SUVR images of the A+/T+/N+ and the A−/[T+]/N+ groups was performed in SPM. Familywise-error–corrected P values of less than 0.05 were considered significant. Groupwise t tests were performed comparing the average tracer binding of both groups against a previously established set of 17 healthy controls (2,18,19) and comparing binding between A+/T+/N+ and A−/[T+]/N+ patients.
Classification Using Data-Driven Patterns
As a data-driven approach, scaled subprofile model (SSM)/principal-component analysis (PCA) was implemented. This method was initially developed to identify disease-specific cerebral metabolic covariance patterns in 18F-FDG PET images (20). Measuring the individual expression strength of disease-related patterns has proven helpful in the early diagnosis of several neurodegenerative disorders (21). We performed a similar approach to all 71 18F-flortaucipir scans to identify covariance patterns possibly capable of group differentiation. Components derived from 18F-flortaucipir SSM/PCA explaining at least 10% of the variance in the dataset were tested for their ability to predict amyloid status by measuring individual pattern expression. Pattern expression scores were calculated as scalar products of PET image matrices and PCA components, similarly to our previous work (22). A receiver-operating-characteristic analysis was performed to identify a threshold of pattern expression score with optimal sensitivity and specificity. Areas under the receiver-operating-characteristic curves (AUCs) were calculated as a measurement of prediction accuracy. Receiver-operating-characteristic and AUC analyses were cross-validated with a leave-one-out approach.
In a second step, SSM/PCA was performed separately in subgroups consisting of either only A+/T+/N+ patients and controls or only A−/[T+]/N+ patients and controls to identify the most dominant patterns characterizing areas of highest variance in the respective subgroup. For these 2 patterns, expression scores were calculated for each subject. PCA patterns explaining more than 10% of the variance were included in the subsequent analyses. A support vector machine model for prediction of amyloid status based on the 2-dimensional pattern expression scores was set up. The accuracy of predicting the amyloid status for pairs of PCA patterns was determined and validated in a leave-one-out approach.
RESULTS
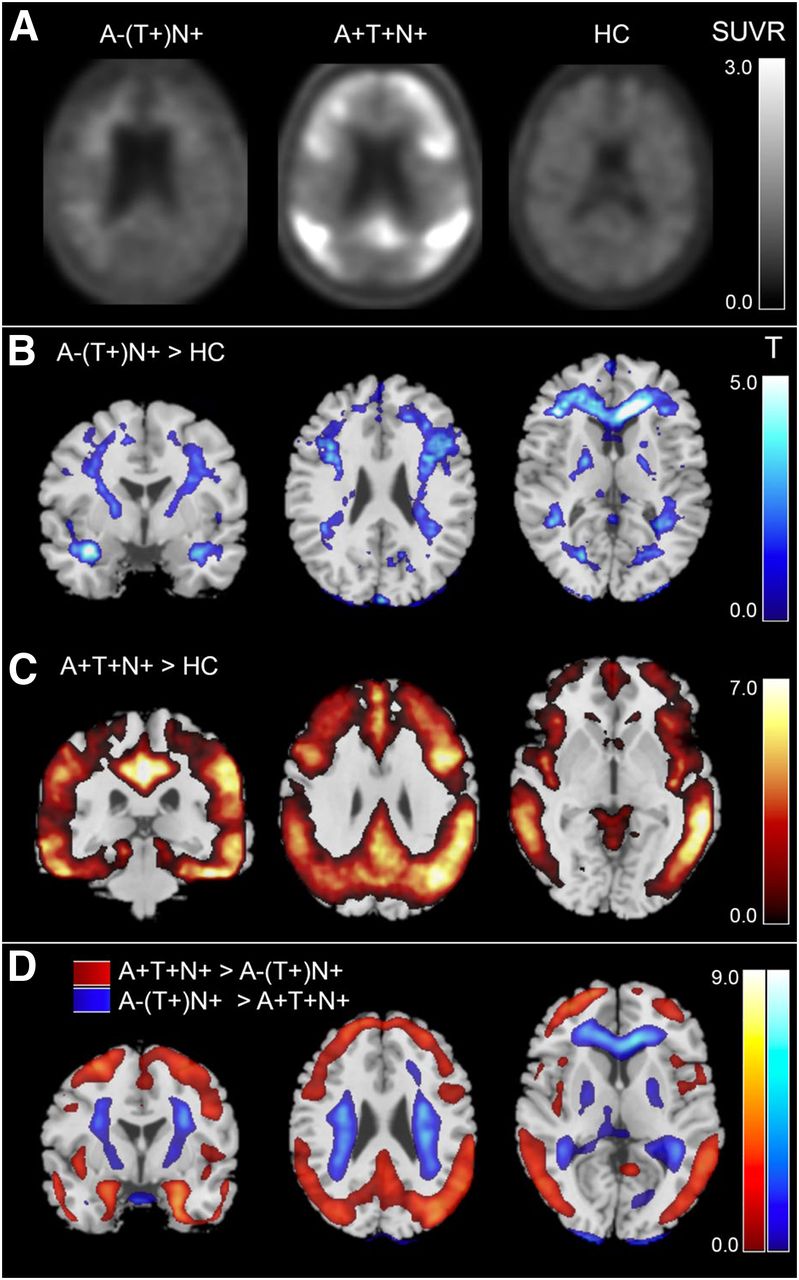
18F-flortaucipir PET scans of both the A+/T+/N+ group and the A−/[T+]/N+ group were visually rated as containing increased regional binding relative to background level. Representative cases (Fig. 1) with elevated 18F-flortaucipir binding are shown in Figure 1A for both groups, as well as a scan of a healthy control subject. Voxelwise comparisons of average tracer binding in A−/[T+]/N+ and A+/T+/N+ patients against healthy controls are depicted in Figures 1B and 1C. A+/T+/N+ patients showed a typical AD pattern with predominant 18F-flortaucipir binding in the posterior cingulate cortex, the parietotemporal cortex, and the frontal cortex. In the A−/[T+]/N+ group, the comparison to healthy controls revealed an elevated average binding in the cerebral WM, most prominently in frontal and temporal regions.

(A) 18F-flortaucipir binding in representative cases (A−/[T+]/N+, healthy controls). Displayed are SUVRs relative to cerebellar GM. (B and C) Results of groupwise comparison of average 18F-flortaucipir signal against healthy controls: amyloid-negative group > healthy controls (B) and amyloid-positive group > healthy controls (C). (D) Results of between-group comparison of average 18F-flortaucipir signal in A+/T+/N+ vs. A−/[T+]/N+ patients (red: A+ > A−; blue: A− > A+). T values above 5.29 are statistically significant. HC = healthy control.
The voxelwise t test comparing A+/T+/N+ patients with A−/[T+]/N+ patients revealed a higher average 18F-flortaucipir binding in the precuneus, the parietotemporal cortex, and the frontal cortex in A+/T+/N+ patients, whereas in the A−/[T+]/N+ patients, average tracer binding was higher in the cerebral WM in the semioval center, the pallidum, and the substantia nigra (T maps are depicted in Fig. 1D; detailed voxelwise t test results and coordinates can be found in the supplemental material in the form of SPM output graphics, i.e., Supplemental Figs. 1 and 2 [supplemental materials are available at http://jnm.snmjournals.org]).
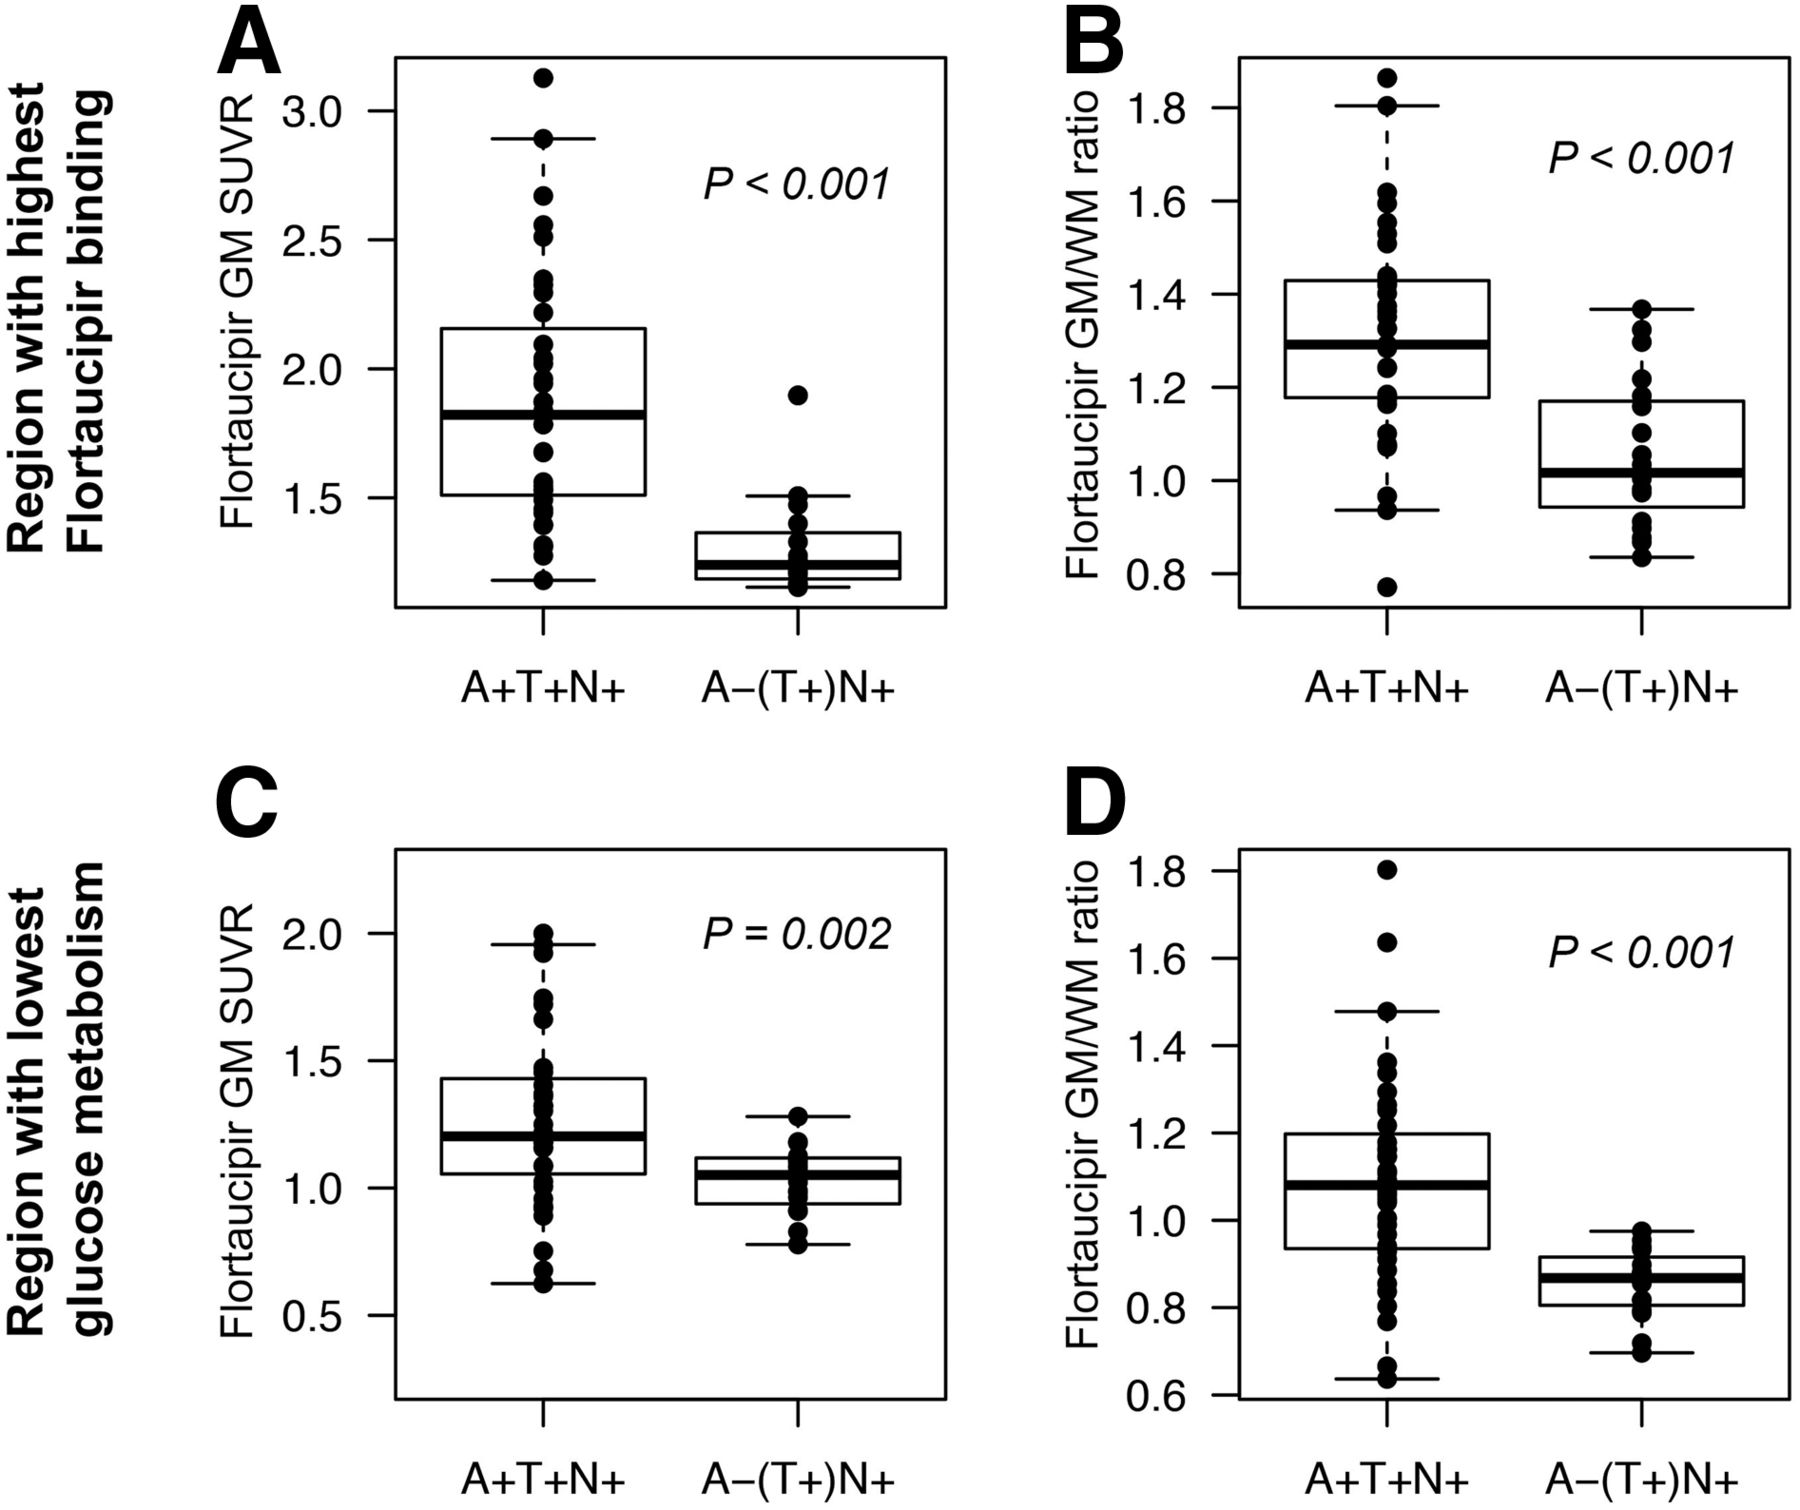
Regional SUVRs and GM/WM ratios in the regions most strongly affected by pathology, as defined by either the lowest 18F-FDG metabolism or the highest 18F-flortaucipir binding, are depicted in Figure 2. GM 18F-flortaucipir uptake in regions with decreased 18F-FDG metabolism was significantly higher in A+/T+/N+ than in A−/[T+]/N+ patients (Fig. 2C, P = 0.002). This group differentiation was even stronger for GM/WM ratios in areas with decreased 18F-FDG metabolism (Fig. 3D, P < 0.001), indicating relatively high WM uptake in these regions.

18F-flortaucipir binding in most affected regions. (A) Highest regional cortical GM 18F-flortaucipir SUVR. (B) GM/WM ratio of 18F-flortaucipir SUVR in atlas region with highest 18F-flortaucipir signal. (C) Cortical GM 18F-flortaucipir SUVR in atlas region with lowest glucose metabolism. (D) GM/WM ratio of 18F-flortaucipir SUVR in region with lowest glucose metabolism.

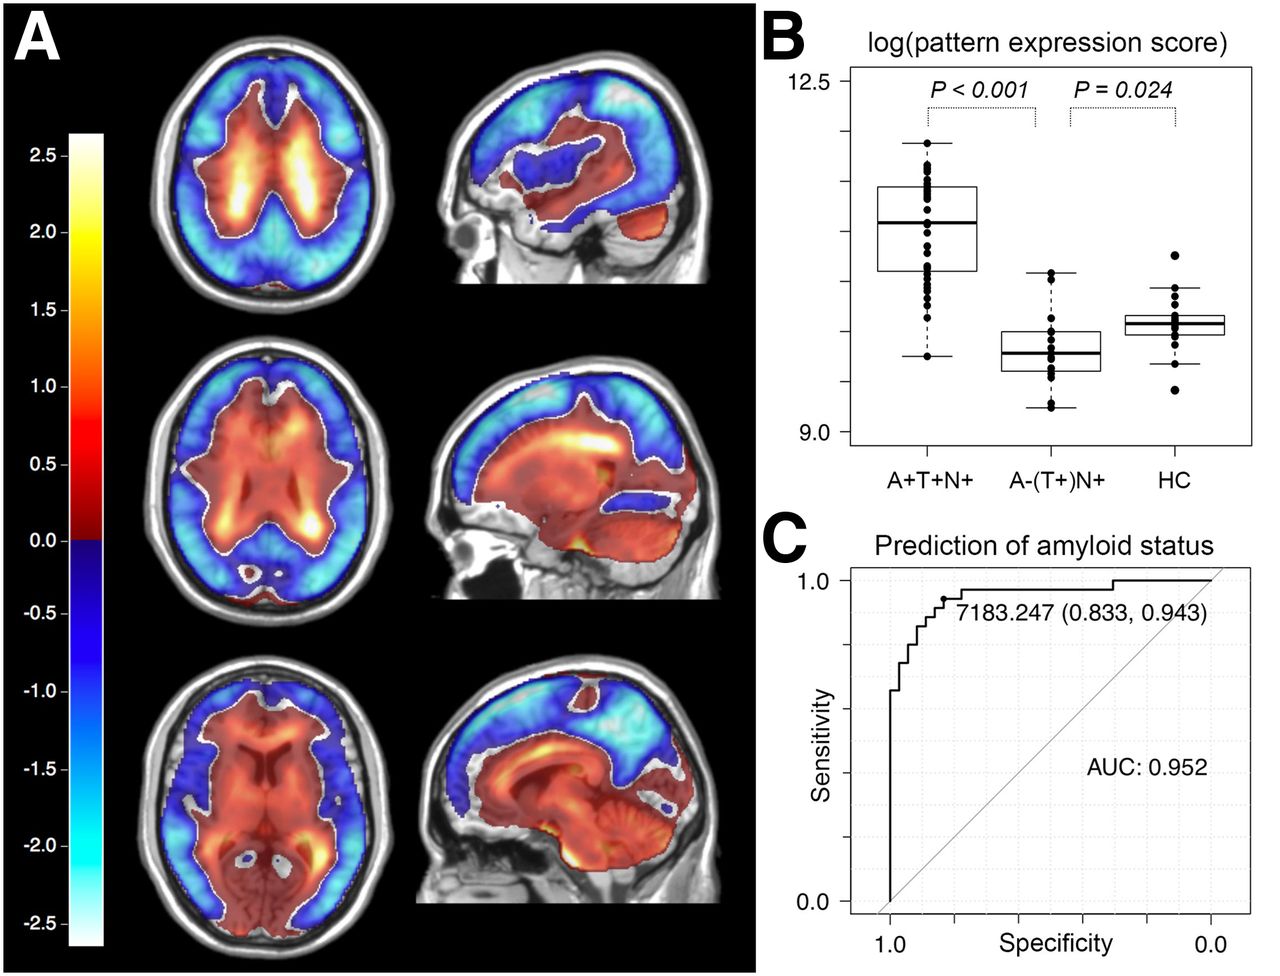
(A) First component derived from SSM/PCA (explaining 29.5% of variance in dataset), mainly consisting of positive values in cerebral WM and negative values predominantly in cortical areas that are typically affected in AD, that is, precuneus, parietotemporal cortex, and frontolateral cortex. (B) Pattern expression scores of first SSM/PCA component in amyloid-positive and -negative patients and in healthy controls (log-transformed for better visibility). (C) Receiver-operating-characteristic curve for prediction of amyloid status in all cases via pattern expression score of first SSM/PCA component.
A combination of the first 4 components derived from SSM/PCA explained more than 50% (first component, 29.5%; second component, 10.1%; third component, 7.7; and fourth component, 5.3) of the variance in the full set comprising 71 18F-flortaucipir PET scans. Component 1 consisted mainly of positive values in the cerebral WM and negative values predominantly in cortical areas that are typically affected in AD, that is, precuneus, parietotemporal cortex, and frontolateral cortex (Fig. 3A).
The expression of component 1 was able to predict amyloid status with a sensitivity of 0.94 and a specificity of 0.83 (AUC, 0.95; Fig. 3C), whereas the expression of the second PCA pattern predicted amyloid status with a sensitivity of 0.46, a specificity of 0.95, and an AUC of 0.64. Amyloid status prediction with components of higher orders resulted in lower values for sensitivity, specificity, and AUC. A leave-one-out cross validation with expression scores for the first PCA pattern yielded a sensitivity of 0.78, specificity of 0.84, and AUC of 0.81 for amyloid status prediction.
The 2-dimensional approach (Fig. 4) generated separate sets of patterns in a subgroup SSM/PCA of only A+/T+/N+ patients and controls and in a subgroup SSM/PCA of A−/[T+]/N+ patients and controls. A GM-dominant pattern in the A+/T+/N+/control subgroup analysis explained 27% of total variance in the dataset and was selected as a pattern of first dimension. A WM-dominant pattern derived from the A−/[T+]/N+/control subgroup explained 12% of variance and was selected as a pattern of second dimension. The selected PCA patterns are depicted in Figure 4B; the 2-dimensional pattern expression scores (square-root–transformed for better visibility) are shown in Figure 4B. Amyloid status prediction based on 2-dimensional pattern expression yielded an accuracy of 98.5%. The leave-one-out cross validation resulted in a minor reduction of prediction accuracy, to 94.0%.
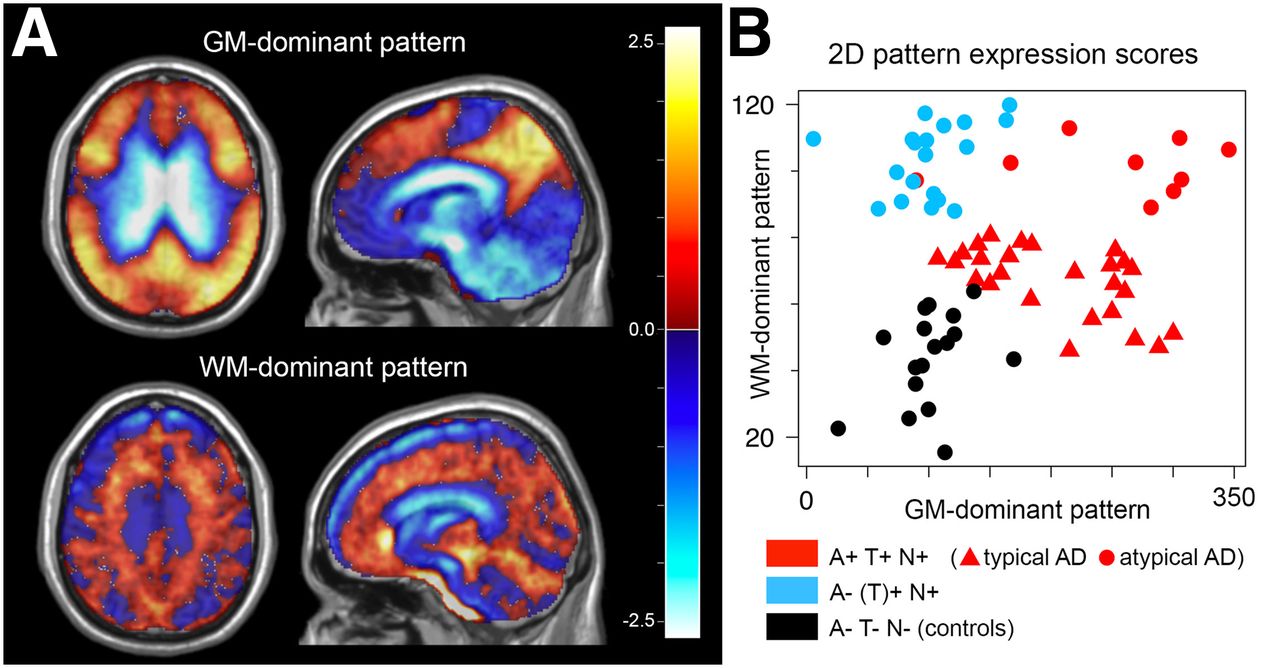
(A) GM-dominant pattern derived from SSM/PCA of subgroup containing A+/T+/N+ patients and healthy controls and WM-dominant pattern derived from SSM/PCA of A−/[T+]/N+ patient controls. (B) Two-dimensional pattern expression scores used to predict amyloid status (square-root–transformed for better visibility). Interestingly, expression of WM-dominant pattern is higher in atypical AD cases but relatively low in typical AD cases.
DISCUSSION
Here, we demonstrate for the first time, to our knowledge, that 18F-flortaucipir PET not only can detect tau-related pathology but also can be used to infer the probable amyloid status by analyzing 18F-flortaucipir PET signal intensity and distribution across WM and GM. Specifically, we could distinguish with high accuracy between amyloid-positive and -negative cases in a mixed group of patients with typical and atypical AD as well as behavioral and language variants of FTLD-type neurodegenerative diseases.
According to the first available studies, tau PET may be less sensitive than amyloid PET in the early diagnosis of AD (23); however, typical and atypical AD cases show a distinct 18F-flortaucipir binding pattern that clearly separates patients from healthy controls (2,18,24). The 18F-flortaucipir binding in patients with the behavioral variant of frontotemporal dementia is distinct from the AD pattern and seems to be expressed predominantly in subcortical WM and GM and to be generally lower in signal intensity (8,13,14). The presence of tau pathology in both WM and GM in patients with the behavioral variant of FTLD has been confirmed in histopathologic studies (5,25). Although there is evidence of a correlation between antemortem 18F-flortaucipir PET imaging and postmortem histopathologic findings in 3 AD patients (26), data on other diseases, such as the behavioral variant of FTLD, are limited. A combined immunohistochemical and autoradiographic study analyzing postmortem samples of patients with AD and non-AD tauopathies found only limited sensitivity to tau protein aggregations in early disease stages and a high variability in 18F-flortaucipir binding between and within cases (27). Marquié et al. reported no postmortem binding of 3H-flortaucipir in autoradiography in cases of histopathologically confirmed non-AD tauopathies, including a case of MAPT P301L mutation leading to frontotemporal dementia (28). However, artifacts caused during the process of tissue fixation and deparaffinization might be responsible for this discrepancy between in vivo and in vitro findings.
Histopathologically, tau pathology occurs predominantly in the cortex in AD (29), whereas in FTLD variants, a severe WM tau burden is present (30,31). This difference might account for the fundamentally different binding behavior in amyloid-positive and amyloid-negative patients regarding subcortical regions. To date, it remains unclear whether the 18F-flortaucipir binding in FTLD is due to a specific affinity of the tracer to isoforms of tau protein aggregates as they occur in these diseases or to an unspecific affinity to any kind of copathology occurring simultaneously and in similar regions. However, the lower 18F-flortaucipir SUVRs in the cortex than in subcortical regions in A−/[T+]/N+ patients might be suggestive of a binding target that is not directly related to tau protein and occurs more dominantly in WM together with cortical and subcortical tau pathology, as it can be present in amyloid-negative forms of neurodegeneration.
There is increasing evidence that 18F-flortaucipir also has a binding affinity to monoamine oxidase isoforms, as confirmed by enzyme inhibition assays, autoradiography, and in vivo PET (32–34). A recent in vitro study showed a comparable binding strength of 18F-flortaucipir to tau fibrils and monoamine oxidases (35). However, Hansen et al. found that 18F-flortaucipir PET signal cannot be decreased by administration of monoamine oxidase inhibitors (36). In comparison to THK5351, another ligand initially developed to specifically bind to tau protein accumulations in AD, 18F-flortaucipir’s off-target binding caused by monoamine oxidase isoforms appears relatively low (37,38).
Value of 18F-Flortaucipir PET
In this study, we showed that it may be possible with 18F-flortaucipir PET to discriminate amyloid-positive from amyloid-negative forms of neurodegeneration. This distinction can be performed by evaluating the expression strength of the distinctive pattern derived from SSM/PCA according to the concept of disease-specific patterns as first described by the Eidelberg group (20). Given the data suggesting that 18F-flortaucipir may bind not only to tau protein aggregations but potentially also to TDP-43 protein pathology, a definite proof of the presence of tau pathology cannot be derived from a 18F-flortaucipir scan. Thus, the accuracy of predicting amyloid status with the SSM/PCA-based 2-dimensional pattern expression score was achieved not necessarily by 18F-flortaucipir binding to specific molecular targets but rather by distinct patterns of a mixture of on-target and off-target binding that are characteristic of different neurodegenerative conditions that themselves are associated with different degrees of amyloid deposition.
In the context of molecular therapy strategies specifically targeting protein aggregations, the data presented in this study may not be sufficient to decide on the suitability of patients for specific therapy trials. First, that is the case for tau protein aggregations whose presence cannot definitely be determined by 18F-flortaucipir PET in non-AD tauopathies because of possible off-target binding. Second, even though we have shown that 2-dimensional-pattern expression scores work well in discriminating 18F-flortaucipir distribution patterns of diseases that are associated with different degrees of amyloid pathology, the data presented in this study do not allow a generalization for prediction of quantitative amyloid biomarkers based solely on 18F-flortaucipir distribution patterns.
However, 18F-flortaucipir can still be of great value in the diagnosis of neurodegeneration. According to the present literature, a quantification of tau pathology in amyloid-positive forms of neurodegeneration is possible with 18F-flortaucipir PET (39,40). Our group has shown before that early acquisition phases with 18F-flortaucipir provide information on neuronal integrity equivalent to that from additional 18F-FDG PET (41). In addition, combined early and late acquisition windows might be more sensitive in early phases of amyloid-positive neurodegeneration (42). The results from this study suggest that additional nonquantitative information about the probable amyloid status can be derived without an additional amyloid PET examination.
These findings together provide the opportunity for a 1-stop-shop diagnostic approach in which a single 18F-flortaucipir PET scan with a combined early and late acquisition phase might render both additional 18F-FDG and amyloid PET scans redundant. Consequently, such a single-tracer scan procedure may possibly provide comprehensive information on probable amyloid status (A), tau positivity (T), and level of neurodegeneration (N) as required by recent biomarker classification algorithms (A/T/N).
Limitations
Although the distinctive pattern that we established in this study seems able to distinguish amyloid-positive from amyloid-negative patients with neurodegenerative diseases, it does not allow for a final diagnosis of a specific neurodegenerative disease (e.g., the behavioral variant of FTLD or FTLD variants primarily affecting language). This limitation is due to the small sample size and the heterogeneous composition of the group of amyloid-negative patients. Because of the rather low prevalence of those diseases and the retrospective nature of this study, we had to compose this group from a set of patients with different neurodegenerative diseases all sharing amyloid negativity as determined mostly by amyloid PET (7/19 amyloid-negative cases had only CSF information available) as a common denominator. Especially in the amyloid-negative group, diagnoses were based mostly on only clinical impression, PET findings, and CSF status and lacked a definitive confirmation of pathology. This factor might have introduced a certain diagnostic bias into the study. For example, it cannot be ruled out entirely that misclassification occurred in cases in early stages of atypical AD with still-normal CSF amyloid levels, no amyloid PET data available, and a non–AD-characteristic hypometabolism 18F-FDG PET pattern.
Even though there was no significant age difference between A+/T+/N+ and A−/[T+]/N+ patients, a potential influence of age on the binding pattern of 18F-flortaucipir cannot be ruled out.
SUVR calculation to an average activity concentration in a reference region always bears the risk of causing normalization artifacts. To date, no standard reference region has been established for 18F-flortaucipir across various disease entities. To minimize artifacts due to elevated 18F-flortaucipir binding of subcortical nuclei in the cerebellum, as has been described in amyloid-negative forms of neurodegeneration, we decided to pick the cerebellar GM as a reference region for SUVR calculation. However, the SSM/PCA procedure contains a normalization routine in itself that uses all included brain voxels as an intensity reference. The basically comparable distinction patterns derived from both the SSM/PCA approach and the classic voxelwise SPM-based approach suggest that normalization artifacts did not strongly affect our data.
In 13 cases, no amyloid PET images were available, and information on amyloid status could be obtained only from CSF analyses. Although there was a very high concordance between PET and CSF-derived amyloid status, especially in amyloid-positive cases, a small number of inaccurate group assignments (A+ vs. A−) cannot be ruled out.
Lastly, this study only included symptomatic patients. Therefore, on the basis of the study results, no statement can be made on whether a prediction of amyloid status with 18F-flortaucipir PET might be possible for presymptomatic or very early stages of neurodegenerative diseases.
CONCLUSION
18F-flortaucipir PET is able to differentiate between amyloid-positive and amyloid-negative forms of neurodegeneration, possibly eliminating the need for an additional amyloid PET scan or a CSF examination. When performed as a dual-phase scan with an additional early perfusion-weighted acquisition window replacing an additional 18F-FDG PET scan, 18F-flortaucipir PET holds the potential to significantly reduce radiation exposure and the complexity of the diagnostic workup in patients with suspected neurodegenerative diseases, allowing comprehensive information on A/T/N classification to be obtained in a single examination.
DISCLOSURE
This study was supported by grant DR 445/9-1 from the Deutsche Forschungsgemeinschaft (DFG). Alexander Drzezga receives research support and speaker honoraria from Avid/Lilly Radiopharmaceuticals, which owns patent rights to 18F-flortaucipir, and from Siemens Healthineers. Thilo van Eimeren receives lecture and consulting honoraria from Avid/Lilly Radiopharmaceuticals. No other potential conflict of interest relevant to this article was reported.
KEY POINTS
QUESTION: Is prediction of amyloid status in patients with neurodegenerative diseases possible with 18F-flortaucipir PET?
PERTINENT FINDINGS: Binding patterns of 18F-flortaucipir predict amyloid status in neurodegenerative diseases with high accuracy. 18F-flortaucipir PET alone may convey additional information equivalent to that from amyloid PET.
IMPLICATIONS FOR PATIENT CARE: The ability to derive information on amyloid status from 18F-flortaucipir PET possibly eliminates the need for an additional amyloid PET scan or a CSF examination.
Footnotes
Published online Jul. 3, 2020.
- © 2021 by the Society of Nuclear Medicine and Molecular Imaging.
REFERENCES
- Received for publication February 24, 2020.
- Accepted for publication May 30, 2020.


