


Abstract
The value of 18F-FDG PET for predicting conversion from mild cognitive impairment (MCI) to Alzheimer dementia (AD) is currently under debate. We used a principal components analysis (PCA) to identify a metabolic AD conversion–related pattern (ADCRP) and investigated the prognostic value of the resulting pattern expression score (PES). Methods: 18F-FDG PET scans of 544 MCI patients were obtained from the Alzheimer Disease Neuroimaging Initiative database and analyzed. We implemented voxel-based PCA and standard Statistical Parametric Mapping analysis (as a reference) to disclose cerebral metabolic patterns associated with conversion from MCI to AD. By Cox proportional hazards regression, we examined the prognostic value of candidate predictors. Also, we constructed prognostic models with clinical, imaging, and clinical and imaging variables in combination. Results: PCA revealed an ADCRP that involved regions with relative decreases in metabolism (temporoparietal, frontal, posterior cingulate, and precuneus cortices) and relative increases in metabolism (sensorimotor and occipital cortices, cerebellum, and left putamen). Among the predictor variables age, sex, Functional Activities Questionnaire, Mini-Mental State Examination, apolipoprotein E, PES, and normalized 18F-FDG uptake (regions with significant hypo- and hypermetabolism in patients with conversion vs. those without conversion), PES was the best independent predictor of conversion (hazard ratio, 1.77, per z score increase; 95% CI, 1.24–2.52; P < 0.001). Moreover, adding PES to the model including the clinical variables significantly increased its prognostic value. Conclusion: The ADCRP expression score was a valid predictor of conversion. A combination of clinical variables and PES yielded a higher accuracy than each single tool in predicting conversion from MCI to AD, underlining the incremental utility of 18F-FDG PET.
People with mild cognitive impairment (MCI) have a high risk of conversion to Alzheimer dementia (AD), but they can also develop a different type of dementia, remain stable, or even regress to a normal aging process (1). Various studies have shown that MCI patients exhibit metabolic changes that can be detected with 18F-FDG PET (2–5). However, a limited accuracy of prediction by 18F-FDG PET of conversion from MCI to AD was reported in some studies (6–8). Likewise, a Cochrane review did not recommend using 18F-FDG PET for this purpose (9), although this recommendation has been a matter of controversy (10).
Principal components (PC) analysis (PCA) was proposed as an alternative voxelwise approach to image analysis for the diagnosis of neurodegenerative disorders. PCA has shown value in the development of disease-specific spatial covariance patterns of regional metabolism characterizing disorders such as Parkinson disease, multiple-system atrophy, progressive supranuclear palsy, and corticobasal degeneration (11–15). Moreover, a high predictive value of PCA for Parkinson disease with cognitive decline was shown, suggesting that the pattern expression score (PES) of a cognition-related pattern in Parkinson disease is a useful biomarker for the prediction of conversion from Parkinson disease–MCI to Parkinson disease with dementia (16,17). In this study, we used PCA and 18F-FDG PET to determine whether there is a specific metabolic pattern associated with conversion from MCI to AD (termed the AD conversion–related pattern [ADCRP]). In particular, we aimed to examine the potential of ADCRP expression alone and in combination with clinical variables for predicting conversion from MCI to AD.
MATERIALS AND METHODS
Patients’ Data and Diagnoses
18F-FDG PET scans obtained from the Alzheimer Disease Neuroimaging Initiative (ADNI; ClinicalTrials.gov Identifier: NCT00106899) were used in this study. The ADNI was launched in 2003 as a public–private partnership led by principal investigator Michael W. Weiner, MD. Information about study protocols and the ADNI project can be found at www.adni-info.org. This study was approved by the ADNI, and written informed consent was obtained by the ADNI from all patients before protocol-specific procedures were performed.
For the present analysis, we used the ADNI 1, ADNI 2, and ADNI GO cohorts. Participants (n = 576) were evaluated at baseline and at 6- to 12-mo intervals after initial evaluation for up to 10 y. We used 18F-FDG PET scans acquired at the baseline visit. We included patients who were diagnosed with MCI and had a Mini-Mental State Examination (MMSE) score of at least 24 points at the time of PET imaging (6 patients were excluded). Additionally, we requested a minimal follow-up time of at least 6 mo (20 patients were excluded, among them 10 without follow-up). Furthermore, 6 patients with a bidirectional change in diagnosis (MCI to AD and back to MCI) within the follow-up time were excluded. The remaining 544 patients were dichotomized into patients who converted to AD (MCI converters [MCI-c]) and those who did not convert to AD (MCI nonconverters [MCI-nc]).
The data were randomly split into training and test datasets of equal sizes (n = 272). Age, sex, MMSE score, and median follow-up time did not differ significantly between the 2 datasets (P > 0.1). As expected, the rate of apolipoprotein E (APOE) ε4 carriers was significantly higher and Functional Activities Questionnaire (FAQ) scores were significantly lower for MCI-c than for MCI-nc in each of the datasets, but these values were comparable per subgroup between the 2 datasets. The clinical and demographic characteristics of the datasets are shown in Table 1.
Clinical and Demographic Characteristics of Training and Test Datasets
PET Imaging
The PET data acquisition details can be found in the study protocols of the ADNI project at www.adni-info.org. In 487 cases, dynamic 3-dimensional scans with six 5-min frames were acquired 30 min after the injection of 185 ± 18.5 MBq of 18F-FDG. In the remaining 57 cases, patients were scanned with a static 30-min acquisition. For dynamic scans, all frames were motion-corrected to the first frame and then summed to create a single image file.
Individual scans were spatially normalized to an in-house 18F-FDG PET template in Montreal Neurological Institute brain space and smoothed with an isotropic gaussian kernel of 12 mm at full width at half maximum. All preprocessing was implemented with an in-house pipeline in MATLAB (The MathWorks, Inc.) and Statistical Parametric Mapping (SPM) software (SPM12; www.fil.ion.ac.uk/spm) in accordance with recommendations for the optimal statistical analysis of brain 18F-FDG PET scans in the context of MCI-to-AD conversion (18).
Multivariate PCA
Scaled subprofile model PCA was used to generate a scaled subprofile model pattern on the basis of group discrimination between MCI-c and MCI-nc. It was implemented on the training dataset of 272 subjects using the Scanvp/SSMPCA toolbox (19). Each subject’s 3-dimensional image data were first converted to a continuous row vector and then embedded in a group data matrix. Each data entry was transformed to logarithmic form, and the data matrix was centered by each row mean value. The deviation from both subject and group means represented the resulting subject residual profile image. PCA was applied to the covariance matrix to derive orthogonal eigenvectors and associated eigenvalues. The spatial eigenvectors were PC image patterns given by the scaled subprofile model PCA.
PC related to the explored group difference were associated with the highest total variance accounted for by the eigenvector. To delineate topographies associated with conversion from MCI to AD, we performed voxelwise PCA on a combination of the MCI-c and MCI-nc groups from the training dataset. To identify a significant pattern, different combinations of PC were tested on the basis of the following statistical criteria: the analysis was limited to the first set of contiguous PC that accounted for the top 50% of the variability in the dataset, and the best combination of these PC was selected by a logistic regression analysis with group (i.e., MCI-c and MCI-nc) as the dependent variable and subject scores for the PC as the independent variable. The obtained ADCRP represented spatially covariant voxels associated with the conversion to AD, with each voxel being specifically weighted toward its relative contribution. For both the training dataset and the test dataset, each individual’s PES for the ADCRP was evaluated by the topographic profile rating algorithm involving computation of the internal vector product of the subject’s residual profile vector and the pattern vector (20).
Additionally, we performed a voxelwise 2-sample t test between 18F-FDG scans of MCI-c and 18F-FDG scans of MCI-nc from the training dataset by SPM. In this analysis, differences in normalized 18F-FDG uptake were compared by applying proportional scaling to minimize the effect of the intersubject variability of global 18F-FDG uptake. The P value adjustment for contrasts was set to a familywise error–corrected P value of less than 0.05. The resulting SPM volumes of interest (VOIs) comprising all significant clusters of relative hypo- and hypermetabolism were then used to extract the individual normalized 18F-FDG uptake inside these SPM VOIs after the subject’s scan was normalized using a predefined mask of brain parenchyma. Mean uptake in hypometabolic VOIs and that in hypermetabolic VOIs were linearly combined, with weighting defined by logistic regression. Mean uptake in only hypometabolic clusters was also included for comparison given that this is a commonly used measure of abnormal brain regions in clinical dementia imaging.
Cox Model Analysis
For each individual, the baseline time was considered to be the time of PET imaging, and the endpoint was chosen to be the time of AD diagnosis for MCI-c or last follow-up time for MCI-nc. Cox proportional hazards regression models were calculated in R (http://www.R-project.org/) using the “Survival” package (21) to test the predictive value of the following 18F-FDG PET variables and clinical variables for conversion from MCI to AD: PES (ADCRP from PCA), mean normalized 18F-FDG uptake (within SPM VOIs), FAQ, APOE ε4 genotype (positive or negative for the presence of at least 1 ε4 allele), and MMSE. Cox model analyses were adjusted for age at baseline (years) and sex (1 for male, 0 for female). All continuous covariates were z transformed such that the hazard ratio reflected risk changes per SD increase.
First, to compare the hazard ratios of independent predictor variables, we computed a Cox model including all predictors (PES, normalized 18F-FDG uptake, FAQ, APOE, MMSE, age, and sex) for the training dataset using the ridge regression option to account for multicollinearity.
Second, for the training dataset, we examined the identified significant predictors grouped to construct a clinical model (FAQ, APOE, and MMSE), imaging model (PES of ADCRP), and combined model (FAQ, APOE, MMSE, and PES), all adjusted for age and sex. The prediction accuracies of the models were statistically compared using the Harrell concordance index (Harrell C index).
For the sake of validation of the constructed models, the results of each Cox model were independently applied to the test dataset via calculation of the prognostic index (PI) for each subject (22). Here, the PI is the sum of the product of the regression coefficients βi and predictor variables  (with i being the index for the order of predictors in the model), as follows:
On the basis of the PI values, the test dataset was stratified into 3 equally sized risk groups. Separation of the models was evaluated using Kaplan–Meier survival curves and the Akaike information criterion (AIC). Risk group separation based on the PI values of the model with combined variables (FAQ, APOE, MMSE, and PES) (i.e., the combined model) was compared with that based on PES values only (i.e., “raw” values of PES, not PI).
RESULTS
AD Conversion–Related Pattern
We limited the PC estimated by our scaled subprofile model PCA to the first 7 PC that accounted for 52.05% of the total variance. However, only PC 2, 3, 6, and 7 (PC2, PC3, PC6, and PC7, respectively) were selected by logistic regression and showed a significant between-group difference after Bonferroni adjustment (P < 0.05). The logistic regression model including these PC yielded the highest significance and lowest AIC in comparison to the other combinations. Therefore, PC2, PC3, PC6, and PC7 were linearly combined to yield the ADCRP (Fig. 1A), which allowed for a significant separation of the MCI-c and MCI-nc groups (P = 9 × 10⁻¹³). For comparison, the more restricted, although overlapping, SPM-derived pattern of regions with significant hypo- and hypermetabolism in MCI-c versus MCI-nc is shown in Figure 1B.
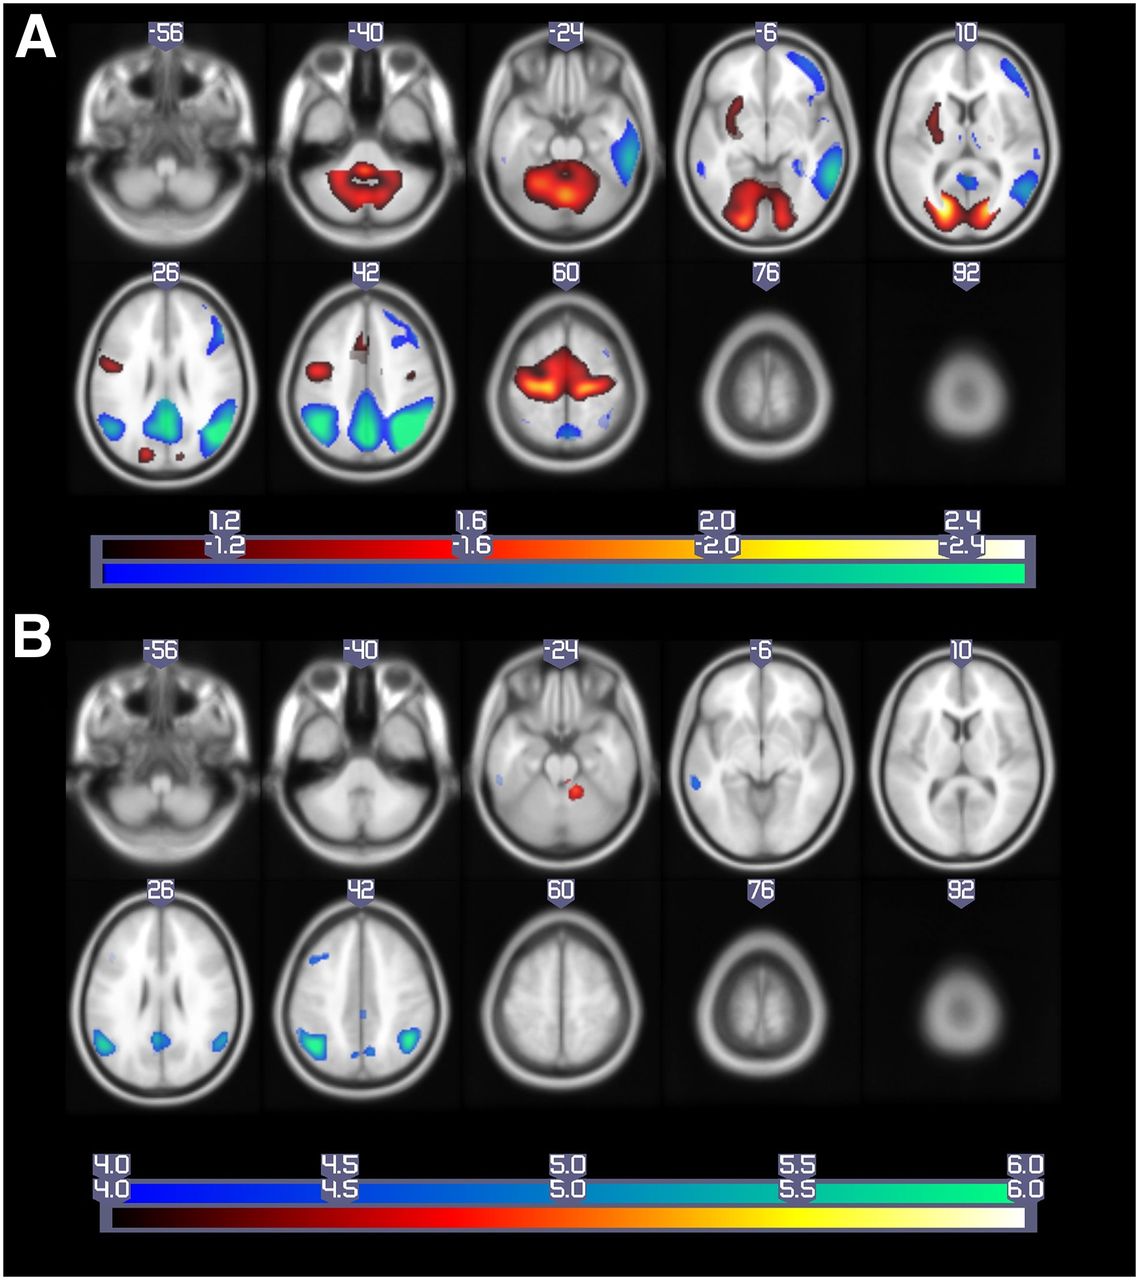
Patterns of regional brain metabolism. (A) ADCRP derived by PCA (P < 0.05) and (B) significant regions derived by SPM t test (familywise error–corrected P < 0.05), overlaid on MRI template image. Voxels with negative region weights and hypometabolism are shown in “cool” colors, and regions with positive region weights and hypermetabolism are depicted in “hot” colors. Data are presented in neurologic orientation.
The most prominent decreases in metabolism in MCI-c compared with MCI-nc on ADCPR were found in the temporoparietal cortex as well as the precuneus/posterior cingulate cortex. Furthermore, decreases were also found in the right frontal cortex, but with a lower factor loading to the pattern in total. Relative increases (probably corresponding to regions with preserved metabolic activity) were detected in the sensorimotor and occipital cortices, cerebellum, and left putamen.
Topographic profile rating of the ADCRP for each subject in the training and test datasets resulted in a PES that could be used to assess the degree to which a subject expressed that pattern. There was no difference in PESs between the 2 MCI-c groups (training vs. test dataset; P > 0.1) or between the 2 MCI-nc groups (training vs. test dataset, P > 0.1). On the basis of receiver operating characteristic analyses, the area under the receiver operating characteristic curve for separation of the MCI-c and MCI-nc groups reached 0.749 for the training dataset and 0.761 for the test dataset; these results verified the high stability of the pattern across the subject cohorts. Similar separation was achieved on the basis of the mean normalized 18F-FDG uptake values obtained with the linear combination in both hyper- and hypometabolic SPM VOIs: normalized 18F-FDG uptake = −4.82 + (12.52 × mean 18F-FDG uptake in hypometabolic clusters) − (9.52 × mean 18F-FDG uptake in hypermetabolic clusters); the area under the receiver operating characteristic curve for the training dataset was 0.758, and that for the test dataset was 0.760. The area under the receiver operating characteristic curve for normalized 18F-FDG uptake in the hypometabolic VOI alone was smaller but was included for comparison because it is a commonly used measure of abnormal brain regions (Supplemental Fig. 1) (supplemental materials are available at http://jnm.snmjournals.org).
Cox Models
First, for the training dataset, the Cox proportional hazards regression with age, sex, FAQ, MMSE, APOE, PES, and normalized 18F-FDG uptake as predictors was computed and penalized by ridge regression to suppress collinearity among predictors (Fig. 2). PES (ADCRP), normalized 18F-FDG uptake (SPM VOIs), FAQ, and MMSE were significant predictors, with PES having the highest hazard ratio, 1.77 (95% CI, 1.24–2.52; P < 0.001).
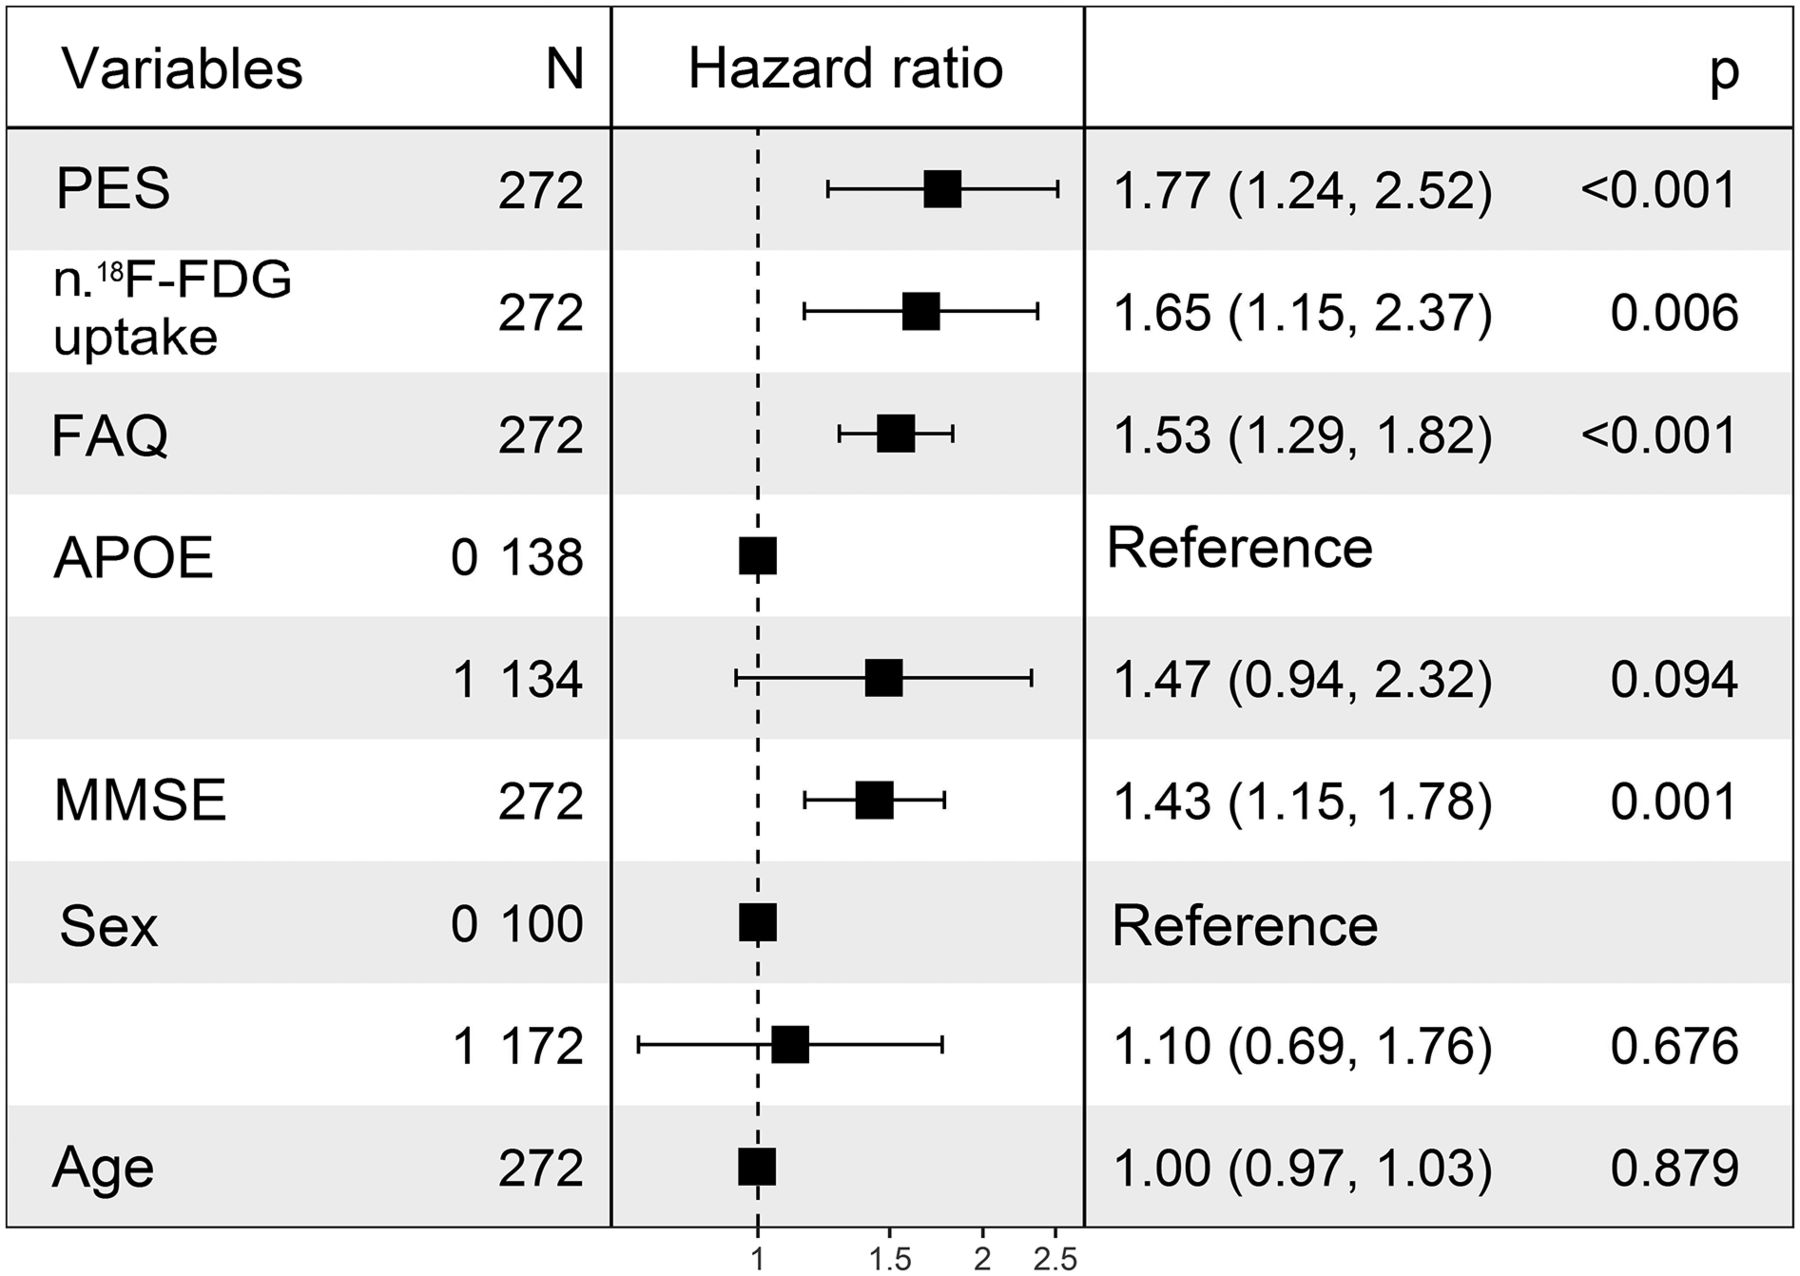
Hazard ratios for different predictors, penalized by ridge regression to suppress effects of multicollinearity among them. Normalized 18F-FDG uptake stems from linear combination of normalized 18F-FDG uptake in VOIs with significant hypometabolism and that in VOIs with significant hypermetabolism. APOE reference: APOE positive; sex reference: female. FAQ = FAQ total score; N = number of subjects; n. = normalized. All continuous variables were z transformed.
Next, we examined imaging and clinical models and later joined them into a combined Cox model to investigate a possible additive prognostic value of PES to the clinically established predictors APOE, FAQ, and MMSE. The variables included in each model and their corresponding hazard ratios are shown in Table 2. The results of the imaging Cox model revealed PES to be a significant predictor for conversion from MCI to AD, with a hazard ratio for z transformed PES of 2.96 (95% CI, 2.35–3.74; P = 2 × 10⁻¹⁶). Age and sex were not significant predictors in any of the models.
Characteristics of Cox Regression Models
Although the clinical model (Harrell C index, 0.80) had a higher accuracy than the imaging model (Harrell C index, 0.76), adding PES to the clinical variables significantly (P < 0.001) increased the prognostic value (Harrell C index for clinical variables combined with PES, 0.84). The quality of the statistical models was tested with the AIC test (combined model AIC value, 749.6; imaging model AIC value, 783.3; clinical model AIC value, 797.2); the combined model was significantly better than the imaging model (P < 0.001), and the imaging model was found to be significantly better than the clinical model (P = 0.007). Thus, the combined model is the preferred model, with the minimum AIC value.
Second, Cox models were validated for the test dataset. We obtained PI values that were used for the survival analysis. As with the training dataset, the clinical model for the test dataset had a higher Harrell C index than the imaging model (0.77 and 0.73, respectively). The increase in the prognostic value of the clinical model when PES was added as a predictor to yield the combined model was also confirmed for the test dataset (combined model Harrell C index, 0.81).
Normalized 18F-FDG uptake (SPM VOIs) as a single predictor had a hazard ratio and a significance level lower than those of PES (ADCRP) (Fig. 2). However, because it is a commonly used measure in neuroimaging analysis, we constructed similar clinical, imaging, and combined Cox models with normalized 18F-FDG uptake (analogous to those with PES). A significant increase in the predictive value of the clinical model (Harrell C index for the training and test datasets, 0.80 and 0.77, respectively) was observed when 18F-FDG uptake was added as a predictor (imaging model Harrell C index for the training and test datasets, 0.76 and 0.73, respectively; combined model Harrell C index for the training and test datasets, 0.84 and 0.81, respectively), and the AIC test indicated that the combined model was the best model.
The combined model with normalized 18F-FDG uptake (SPM VOIs) had a significantly lower predictive value than the combined model with PES (for the combined model with PES, the AIC value was 749.6; for the combined model with normalized 18F-FDG uptake, the AIC value was 751.6; P < 0.001 [likelihood ratio test]). The detailed results for the clinical, imaging, and combined Cox models with normalized 18F-FDG uptake for the training and test datasets are shown in Supplemental Table 1.
Risk Group Stratification
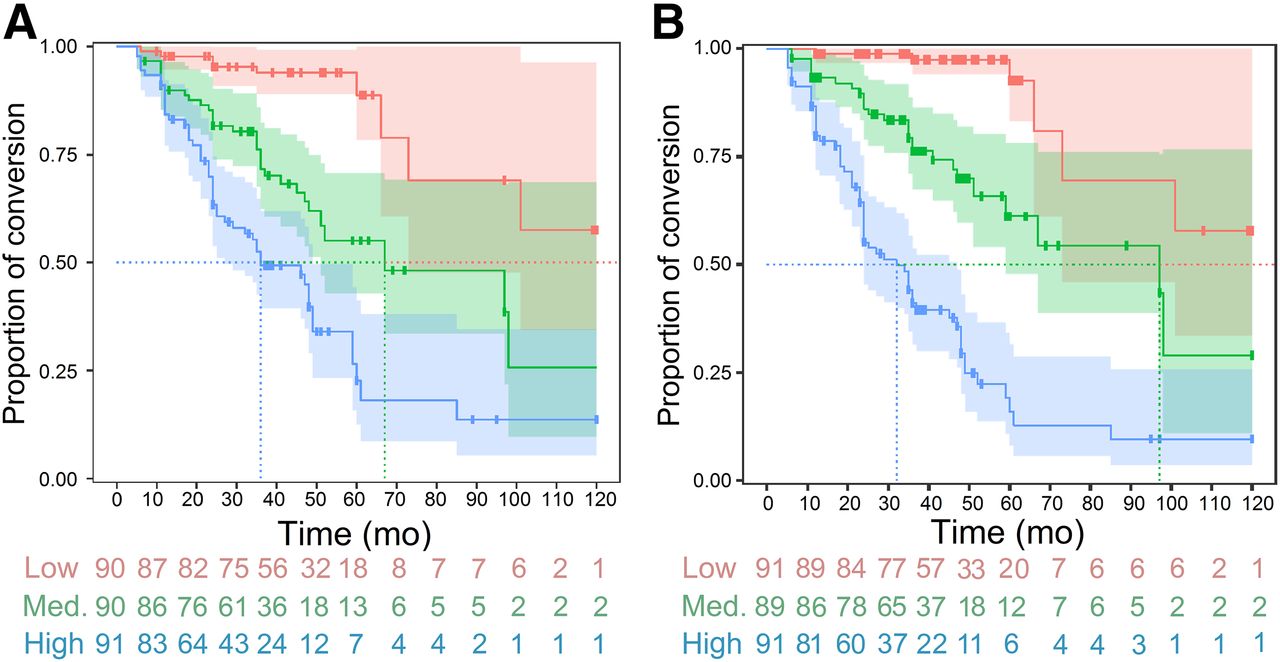
For the test dataset, we tested whether risk groups were better separated by the PI derived from the combined model (including PES values) or by PES values alone (Fig. 3). Both models demonstrated good separation of groups with high, medium, and low risks of conversion to AD. The best stratification was reached with the PI resulting from the combined model. This method allows for the accounting of all available variables at once, including time to conversion of the training dataset used for the definition of the Cox model. The most noticeable difference was observed in the first 60 mo, and comparison of the risk strata was statistically limited after this time point because of the small number of subjects (Table 3).

Kaplan–Meier curves for test dataset. (A) Risk strata determined using PES values alone. (B) Risk strata determined using PI derived from combined model (including PES values). Med. = medium.
Separation of Risk Strata by Different Models
DISCUSSION
Using 18F-FDG PET data in combination with voxel-based PCA, we identified a metabolic pattern associated with conversion from MCI to AD. Aside from constructing the ADCRP, we estimated its predictive accuracy in a large cohort of subjects and prospectively confirmed its validity for the test dataset.
The obtained network topography is consistent with previously published hypo- and hypermetabolic regions identified in AD (3,17,23,24). We found that conversion to AD is characterized by a significant decrease in metabolic activity in the temporoparietal regions, right frontal cortex, posterior cingulate, and precuneus cortex, whereas the occipital cortex, sensorimotor cortex, cerebellum, and left putamen showed relatively increased metabolic activity. The latter most likely corresponds to preserved metabolic activity, given that proportional scaling by global uptake was performed. We also analyzed the same groups of subjects with the SPM t test, which indicated overlapping regions of hypo- and hypermetabolism; however, these regions were much more restricted.
Although we observed some similarities between the topography of ADCRP and the distribution of regional metabolic differences depicted by SPM in the present study, these results portray very different measures of brain function. Indeed, the ADCRP from spatial covariance analysis is based on variance information about glucose metabolism measured on 18F-FDG PET. In contrast, maps of the SPM t test revealed regional differences in mean values of normalized glucose metabolism. It has been shown consistently that the PCA approach has a higher sensitivity than SPM group comparisons for the detection of brain regions with metabolic changes in neurodegenerative disorders such as AD (23) and Parkinson disease (25) or in subjects with idiopathic rapid eye movement sleep behavior disorder (26,27). These data are further supported by the observation that the PES of the AD-related pattern had a higher accuracy in group discrimination than metabolic changes measured in regions of interest (23,28). The superior performance of the PES as a predictor over that of normalized uptake in SPM VOIs in the present study is consistent with these prior results. Moreover, the computation of the degree of pattern expression in individual patients is performed automatically and without clinical information. Thus, this approach is potentially more objective than any diagnostic categorization achieved by visual interpretation or predefined ROI analysis.
In contrast to the AD-related pattern of Teune et al. (24), we focused our study not on the differences between AD and normal elderly controls but on the prodromal phase of AD. The metabolic pattern at the MCI stage may be particularly influenced by compensatory neural mechanisms (29). However, Meles et al. (30) investigated the expression of the AD-related pattern (24) in an MCI cohort and reported a comparable area under the receiver operating characteristic curve (0.80). Like those investigators, we observed a significant inverse correlation between the PES and the MMSE (r = −0.27; P < 0.001). In addition, we found a significant positive correlation between the PES and the Clinical Dementia Rating Scale Sum of Boxes (r = 0.37; P < 0.001) and between the PES and the Alzheimer Disease Assessment Scale (sum of 11 cognitive subscale scores) (r = 0.36; P < 0.001), indicating a significant association between the expression of the detected pattern and cognitive impairment (data not shown). No correlation was found between the PES and sex or age in both datasets (not shown in detail).
Although various biomarkers have already been examined as predictors in regression models, in the present study we examined imaging (PES; normalized 18F-FDG uptake in linearly combined VOIs with significant hypo- and hypermetabolism) along with genetic (APOE), sociodemographic (age, sex), and cognitive (FAQ, MMSE) variables in Cox model analyses to rate the progression from MCI to AD. As a single predictor, the PES had a higher hazard ratio than the FAQ, MMSE, APOE, or normalized 18F-FDG uptake. We found that the imaging Cox model with the PES was comprehensive and provided a significant enhancement in predicting conversion when combined with clinical variables. Because receiver operating characteristic analysis does not include time-to-event information, the AIC and Harrell C index were used instead to evaluate the performance of the prediction. The combination of imaging and clinical variables provided the best prediction; this result was similar to that of Liu et al. (3).
It was shown that PES could be applied to a new subject on a single-case basis, despite the fact that subjects were scanned on different PET systems (12,30). The benefit of the present study is the ability to combine the disease-related network pattern with the clinical variables to obtain a quantifiable PI for conversion from MCI to AD per subject. Although the PES itself is a good predictor and can be used to predict conversion, the combination of the PES with clinical variables and the calculation of the PI provide better stratification; this approach may be particularly attractive for single-subject predictions (Fig. 3). For instance, a subject may be assigned to 1 of the defined groups on the basis of the PI, and acquainted with its most probable median “conversion-free” time. These results are of great importance not only from a research standpoint (e.g., patient involvement in clinical trials) but also for clinical purposes.
CONCLUSION
Our results confirm the predictive value of 18F-FDG PET in patients with MCI. The PCA technique showed its applicability for differentiating between MCI subjects who converted to AD and stable MCI subjects. The PES of the ADCRP was identified as a valid predictor of conversion, and the combination of clinical variables with the PES yielded a higher predictive value than each single tool.
DISCLOSURE
Data used in the preparation of this article were obtained from the Alzheimer’s Disease Neuroimaging Initiative (ADNI) database (adni.loni.usc.edu). As such, the investigators within the ADNI contributed to the design and implementation of the ADNI or provided data but did not participate in analysis or writing of this report. No other potential conflict of interest relevant to this article was reported.
Footnotes
Published online Nov. 2, 2018.
- © 2019 by the Society of Nuclear Medicine and Molecular Imaging.
REFERENCES
- Received for publication August 9, 2018.
- Accepted for publication October 15, 2018.


Jump to section
Related Articles
Cited By...
- Artificial intelligence for diagnosis and prognosis in neuroimaging for dementia; a systematic review
- Principal-Component Analysis-Based Measures of PET Data Closely Reflect Neuropathologic Staging Schemes
- Validation of the Alzheimer Disease Dementia Conversion-Related Pattern as an ATN Biomarker of Neurodegeneration
- Brain amyloid {beta}, cerebral small vessel disease, and cognition: A memory clinic study
- Predictive Value of 18F-Florbetapir and 18F-FDG PET for Conversion from Mild Cognitive Impairment to Alzheimer Dementia