


Abstract
Although PET with 15O-water is the gold standard for imaging cerebral blood flow (CBF), quantification requires measuring the arterial input function (AIF), which is an invasive and noisy procedure. To circumvent this problem, we propose a noninvasive PET/MRI approach that eliminates the need to measure AIF by using global CBF determined by phase-contrast (PC) MRI as a reference region. This approach not only is noninvasive but also involves no additional imaging time, because PC MRI and 15O-water PET are acquired simultaneously. The purpose of this study was to test the accuracy of this hybrid method in an animal model in which AIF was measured directly and CBF was varied by changing the arterial CO2 tension. Methods: PET and MRI data were simultaneously acquired in juvenile pigs at hypocapnia (n = 5), normocapnia (n = 5), and hypercapnia (n = 4). CBF was measured by the MRI reference method and by PET alone using an MRI-compatible blood sampling system to measure AIF. Results: Global CBF estimates from PC MRI and 15O-water PET agreed well, with a correlation coefficient of 0.9 and a slope of 0.88. Strong positive correlations (R2 > 0.96) were also found between regional CBF generated by the PET-only and the MRI-reference methods. Conclusion: These findings demonstrate the accuracy of this hybrid PET/MRI approach, which might prove useful in patients for whom obtaining accurate CBF measurements is challenging.
Given the critical role that proper regulation of cerebral blood flow (CBF) plays in maintaining good brain health and function, there continues to be a search for perfusion imaging techniques that are both quantitative and minimally invasive. The gold standard for measuring CBF in humans remains PET using radiolabeled water (15O-water) (1). However, quantification requires measuring the arterial input function (AIF), which not only is an invasive procedure with a potential risk of complications but also is sensitive to noise (2–4). An MRI technique, arterial spin labeling, is an attractive noninvasive alternative; in many respects it is the MRI analog of PET, since it uses labeled water as a flow tracer (5). Several validation studies have shown reasonable agreement between CBF measurements from PET and arterial spin labeling (6–9); however, despite more efficient labeling approaches and improvements in MRI technologies, the precision of arterial spin labeling can still be limited by a low signal-to-noise ratio, and its accuracy is hampered by arterial transit time effects (10,11). These issues become increasingly important when a low CBF is being imaged, such as in white matter, older populations, and patients with cerebrovascular disease (12–14).
Considering these current limitations of arterial spin labeling, a PET-based approach that does not require invasive arterial sampling but can still generate quantitative CBF images would be useful for measuring CBF in challenging populations. One approach for circumventing arterial catheterization is to extract an image-derived input function from dynamic PET images (15). The accuracy of this approach depends on careful correction for partial-volume effects—a task that is particularly challenging when an image-derived input function is derived from carotid arteries, given their relatively small size and the limited resolution of PET scanners (16–18). More recently, there has been a focus on minimizing partial-volume effects by coregistering anatomic MR images with PET images to aid with segmenting the feeding arteries (19). The development of hybrid PET/MRI is attractive for this approach because potential registration errors are reduced by simultaneous imaging (20).
An alternative PET/MRI method eliminating the need to measure AIF would be a reference-tissue approach. That is, CBF in a given voxel or region of interest can be determined by relating its time–activity data to those of a reference region with known blood flow. The concept of using a reference-based method for 15O-water PET imaging has been previously proposed (21), but this method required that a known value of global CBF be assumed. With PET/MRI, this assumption is not necessary, given that CBF, either global or in a chosen reference region, can be simultaneously measured by an MRI-based perfusion method. This paper presents a variation of this hybrid approach that uses an estimate of whole-brain CBF measured by phase-contrast (PC) MRI (22) as a reference region. The purpose of the study was to evaluate the accuracy of this hybrid imaging method using an animal model in which global CBF was varied by manipulating arterial CO2 tension (PaCO2). For validation, CBF was also determined independently of the PET data by direct measurement of AIF.
MATERIALS AND METHODS
Validation Study
Animal experiments were conducted according to the guidelines of the Canadian Council on Animal Care and approved by the Animal Use Committee at Western University. Eight female juvenile Duroc pigs were obtained from a local supplier (age range, 8–10 wk; mean weight ± SD, 19.6 ± 3.0 kg). Under 3% isoflurane anesthesia, the animals were tracheotomized and mechanically ventilated on a mixture of oxygen and medical air. Catheters were inserted into the cephalic veins for 15O-water injections and into the femoral arteries for intermittent blood sampling, measurement of PaCO2 and arterial O2 tension, monitoring of blood pressure, and measurement of AIF. After the preparation and the surgical procedures, the animals were transported to the PET/MRI suite on a custom immobilization platform and allowed to stabilize for approximately 1 h before the experiment started. While in the scanner, the animals were anesthetized with a combination of isoflurane (1%–3%) and an intravenous infusion of propofol (6–25 mL/kg/h). A pulse oximeter was used to monitor arterial oxygen saturation and heart rate. At the end of the experiment, the animals were euthanized according to the animal care guidelines.
Study Protocol
The study consisted of simultaneously collecting 15O-water PET and PC MRI data. CBF was changed by adjusting the ventilator breathing rate and tidal volume to vary PaCO2 from hypo- to hypercapnia. For each animal, CBF measurements were obtained under 2 of 3 possible PaCO2 levels (hyper-, normo-, and hypercapnia), which were randomly selected per experiment. The number of conditions was limited to 2 per animal because of considerations regarding the duration of each experiment and blood loss, which was primarily related to measuring AIF. Before and immediately after each CBF measurement, arterial blood samples were collected to record PaCO2. The experiments were conducted on a 3-T Biograph mMR PET/MRI system using a 12-channel PET-compatible head coil (Siemens GmbH). 15O-water was produced by an onsite cyclotron (PETtrace 800, 16.5 MeV; GE Healthcare) by the (d,n) 14N reaction. Before CBF data acquisition, sagittal T1-weighted images, which were subsequently used as an anatomic reference and to create whole-brain masks, were acquired using a 3-dimensional magnetization-prepared rapid gradient-echo sequence (repetition time/echo time [TR/TE], 1,780/2.45 ms; inversion time, 900 ms; flip angle, 9°; field of view, 180 × 180 mm; 176 slices; isotropic voxel size, 0.7 mm3), followed by 3-dimensional time-of-flight (TOF) MR angiography (TR/TE, 22/3.6 ms; matrix, 320 × 320 × 105; voxel size, 0.8 × 0.8 × 1.5 mm) (Fig. 1). Finally, to align the CT data used for attenuation correction to the PET data, ultrashort echo time contrast images were acquired (TR TE/first TE/second, 11.94/0.07/2.46 ms; field of view, 300 × 300 mm; 192 slices; isotropic voxel size, 1.6 mm3).
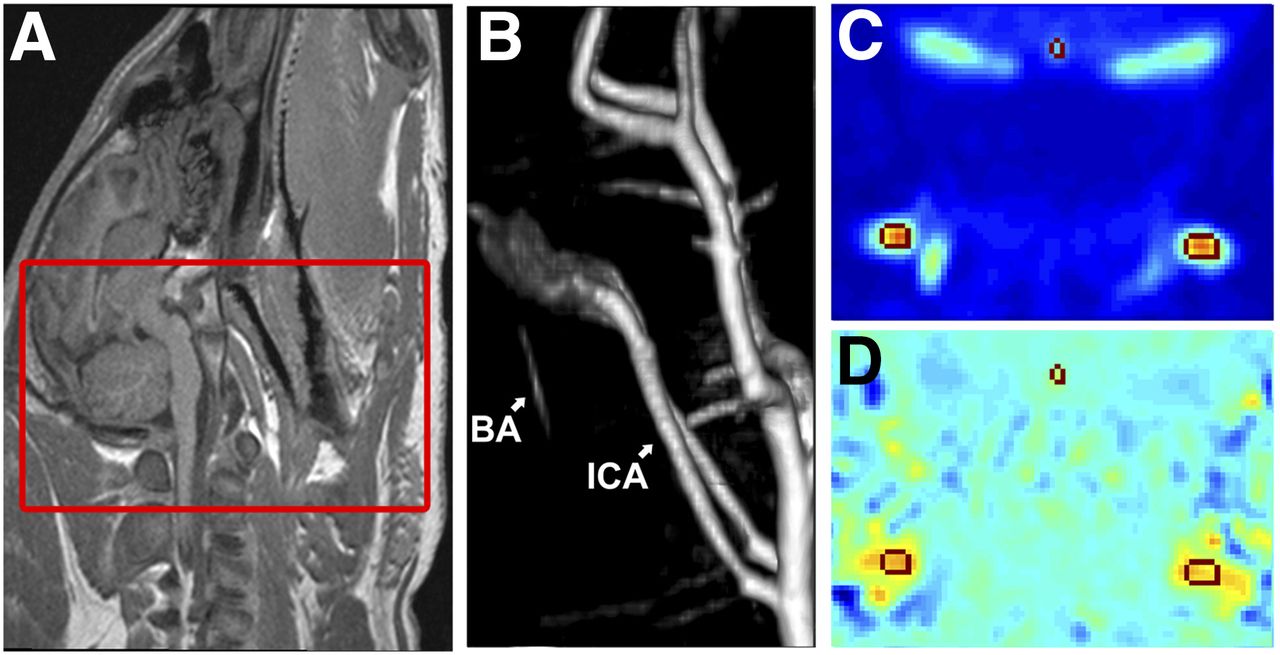
CBF measurement by PC. (A) Sagittal T1-weighted image for anatomic reference, with boxed area representing imaging region for TOF MR angiography. (B) TOF MR angiography, which was used for planning PC acquisition. (C) Example magnitude image. (D) Example phase image. Regions of interest on basilar artery (BA) and internal carotid arteries (ICA) were contoured on magnitude image and copied to phase image.
A flow experiment was performed once PaCO2 was considered stable as confirmed by 2 readings within 2 mm Hg of each other. The experiment began with a manual intravenous bolus injection of 15O-water (423 ± 130 MBq, 8 mL). A saline flush followed (10 mL), and then dynamic 15O-water PET and PC MRI data were acquired simultaneously. After data acquisition, PaCO2 was altered to achieve a different CBF level, and the procedure was repeated after a delay of at least 20 min to allow sufficient decay of 15O activity and to ensure PaCO2 had stabilized to its new level. At the end of the 2 conditions, the pig was transported on an immobilization platform to either a Revolution CT scanner (GE Healthcare) or a Discovery VCT PET/CT scanner (GE Healthcare) to obtain a CT-based attenuation correction map (protocols were identical) (slice thickness, 1.25 mm; energy, 140 kV; field of view, 1,024).
PC MRI Acquisition and Postprocessing
At each PaCO2 level, gated PC images were acquired (TR/TE, 34.4/2.87 ms; matrix, 320 × 320; voxel size, 0.625 × 0.625 × 5 mm; velocity encoding, 80 cm/s in the through-plane direction (23,24); 8 averages; 8 segments; duration, 7 min) simultaneously with a 15O-water PET acquisition (25).
PC data were converted into global CBF (23,26) using an in-house–written MATLAB (MathWorks) script. The contours of the basilar and internal carotid arteries for each segment of the cardiac cycle were manually delineated on the magnitude image and copied to the phase image (Fig. 1). Vessels were contoured 3 times to obtain an average measurement, which was then used to calculate global CBF.
15O-Water PET Acquisition and Postprocessing
After the 15O-water injection, 5 min of list-mode data were acquired (27). An MRI-compatible automated blood sampling system (Swisstrace GmbH) was connected to a catheter in a femoral artery to measure AIF. The sampling system was attached to a pump set to a withdrawal rate of 5 mL/min, and activity was recorded at a temporal resolution of 1 s. The system was started approximately 15 s before the injection of 15O-water and continuously recorded 15O-water activity throughout the scan. The tubing connecting the arterial catheter to the detector was 15 cm long. A calibration experiment was performed before the study and showed that the effect of dispersion was negligible at the withdrawal rate and tubing length that were used.
The PET images were reconstructed offline using the Siemens e7-tools suite for Biograph mMR data. Raw PET data were corrected for scatter, random incidences, detector normalization, and data rebinning. Attenuation was corrected using CT-based attenuation correction maps that were rescaled to the annihilation emission energy (511 keV) (28) and aligned to the ultrashort echo time images. PET data were reconstructed into 37 dynamic frames (3 s × 20, 5 s × 6, 15 s × 6, 30 s × 5) using 3-dimensional ordered-subset expectation maximization with 4 iterations and 21 subsets (29). The reconstructed PET images (matrix size, 344 × 344 × 127; voxel size, 0.8 × 0.8 × 2 mm; zoom factor, 2.5) were smoothed by a 6-mm gaussian filter.
Dynamic PET images were analyzed in 2 ways using an in-house–developed MATLAB-based program to generate separate sets of CBF images. First, by the standard PET-only method using the measured AIF: Eq. 1where
  is the clearance rate constant, Ca(t) is AIF, and CBVa is arterial blood volume. The delay between AIF and PET tissue activity data was corrected by aligning the initial rise (approximately the first 10 s) of AIF to an image-derived input function derived from the carotid arteries of the corresponding dynamic PET data. Spill-in and spill-out corrections were not performed because only the initial appearance of 15O-water was of interest. With the 2 datasets aligned, the MATLAB routine for nonlinear optimization (fmincon) was used to fit Equation 1 to the tissue activity curve to generate best-fit estimates of CBF, k2, and CBV. This analysis was conducted using the whole-brain time–activity curve for comparison to whole-brain CBF (fwb) from PC MRI and at the voxel level to generate CBF images.
The MRI-reference region approach for generating CBF images is given by Equation 2 (21,30): Eq. 2where Ci(t) and fi are the tissue 15O-water concentration and CBF, respectively, in the ith voxel/region; Cwb(t) is the whole-brain tissue 15O-water concentration; and λ is the partition coefficient of water. An important distinction between the PET-only and MRI-reference methods is that the latter assumes that arterial blood-borne activity has negligible effects on the calculation of CBF in the ith voxel/region (fi).
Statistics
Agreement between whole-brain CBF measurements from 15O-water and PC was assessed by linear regression analysis and Bland–Altman plots. Linear regression was also used to assess spatial agreement between CBF images created by the 2 methods. To minimize the effects of spatial correlation, the analysis was conducted using large regions of interest that encompassed cortical tissue, deep gray matter, and cerebellum. These regions of interest were based on T1-weighted images and were averaged over adjacent slices to minimize spatial correlation in the axial direction as well. To assess whether the slope and intercept were significantly different from 1 and 0, respectively, t tests were conducted, with a P value of less than 0.05 considered significant. For all measurements, mean ± SD is reported.
RESULTS
Validation Study: Porcine Model
Data were acquired in juvenile pigs at hypocapnia (n = 5, PaCO2 = 29.0 ± 3.6), normocapnia (n = 5, PaCO2 = 39.7 ± 2.2), and hypercapnia (n = 4, PaCO2 = 54.3 ± 7.3). Each animal was scanned at 2 arterial CO2 tensions ranging between 23 and 63 mm Hg. For 2 animals, data from one PaCO2 condition was excluded—because of failure of the blood sampling system in one animal and unexpected death in the other.
Whole-Brain CBF
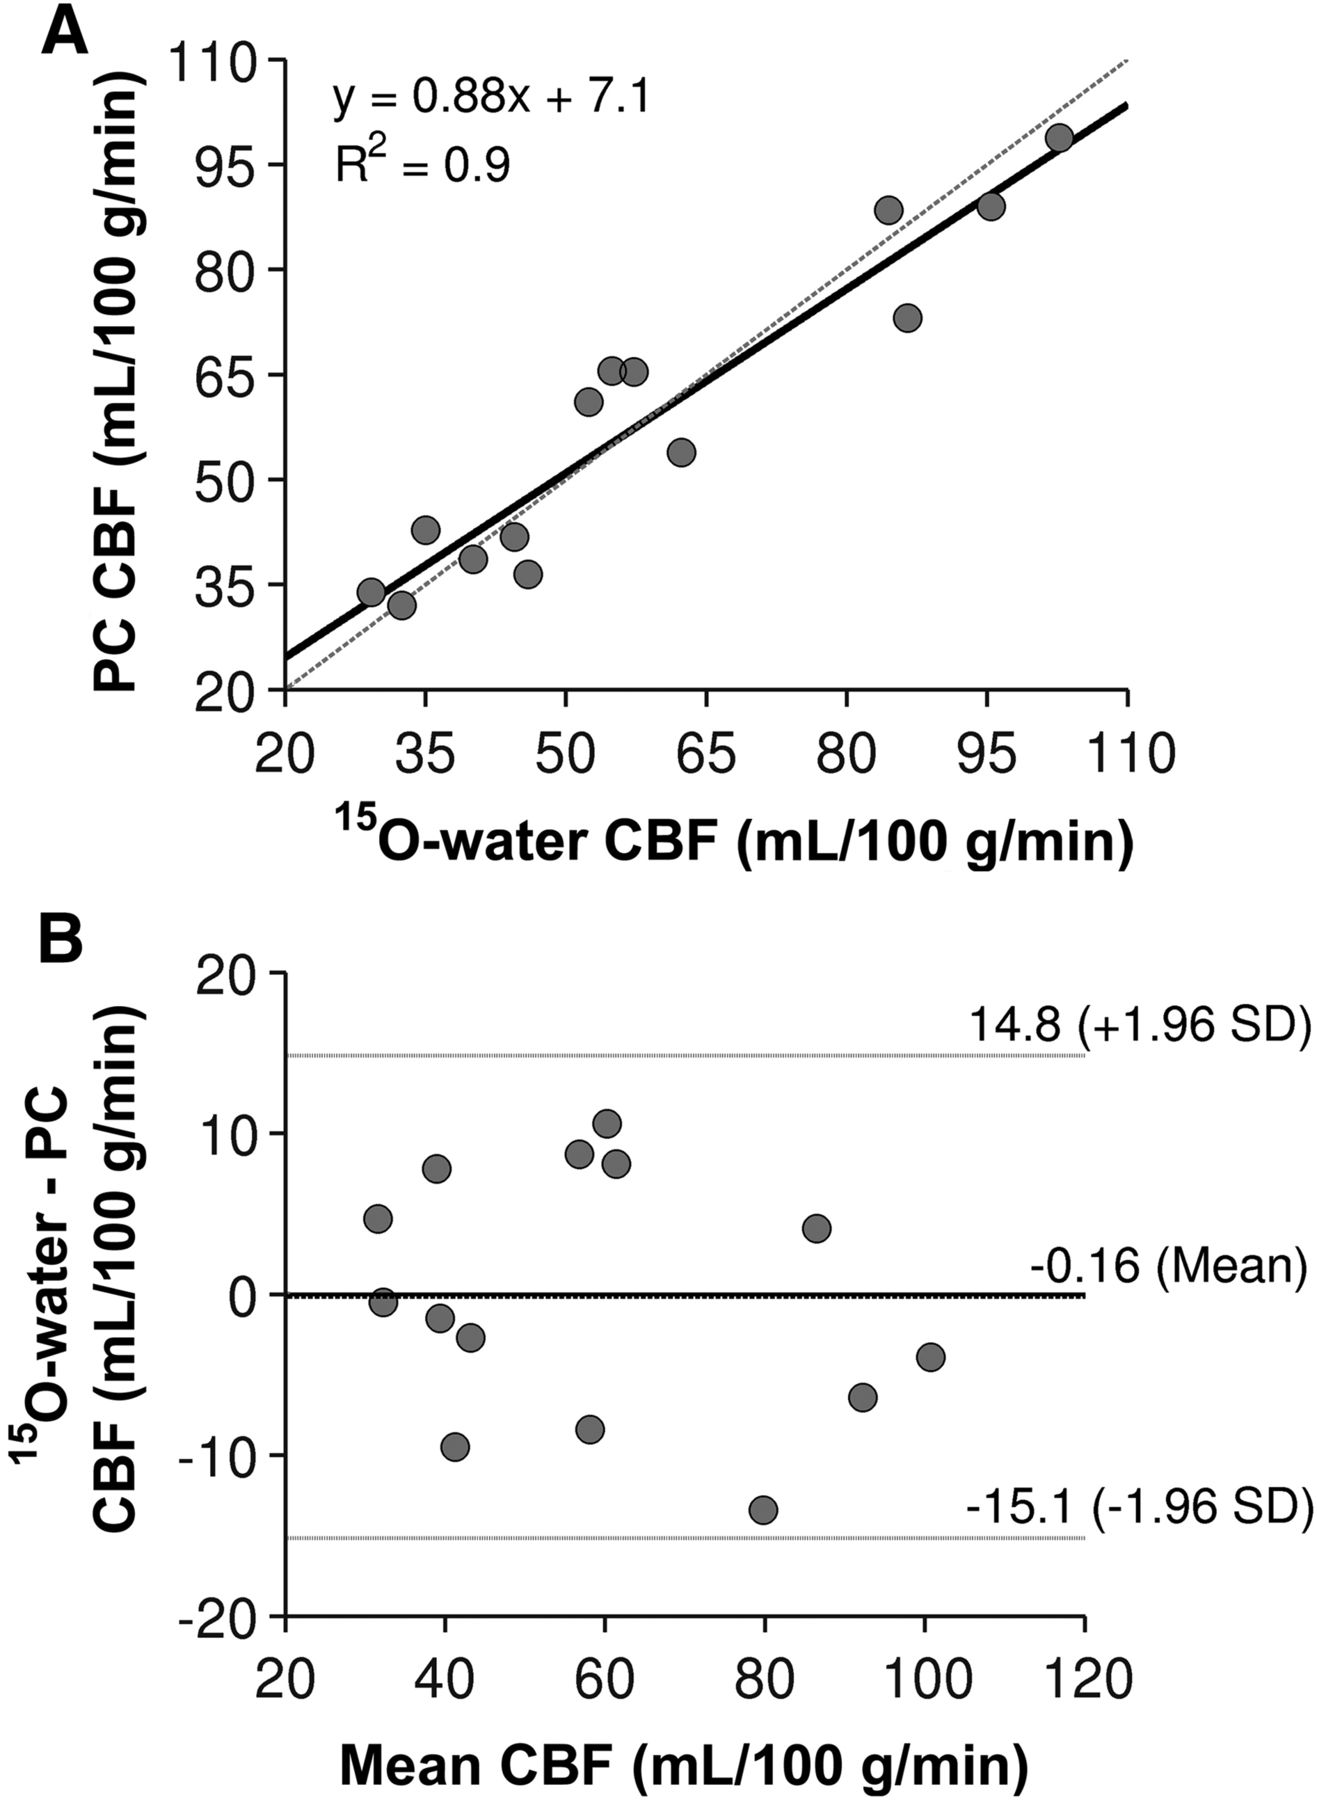
Global CBF measured by the PET-only method and PC MRI at hypo-, normo-, and hypercapnia is reported in Table 1. Figure 2A shows a scatterplot correlating whole-brain CBF measured by the 2 imaging modalities. The correlation coefficient (R2 = 0.9) and linear regression (slope, 0.88; intercept, 7.1) demonstrated a strong and significant correlation between the variables (P < 0.001). Furthermore, the intercept and slope were not significantly different from zero and one, respectively (P < 0.05). Bland–Altman analysis demonstrated little systematic bias, indicated by a mean difference of 0.16 mL/100 g/min (Fig. 2B).
Global CBF Measured by PET-Only and MRI-Reference Approach and Regional CBF Regression Parameters at Each PaCO2 Level

Whole-brain comparison. (A) Correlation between CBF measured by 15O-water and PC (n = 14), with solid line representing regression line (y = 0.88x − 7.1 mL/100 g/min) and dashed line representing line of identity. (B) Bland–Altman plot comparing difference (y-axis) and average (x-axis) of 15O-water and PC CBF (n = 14), with mean difference and limits of agreement indicated by horizontal lines.
Regional CBF
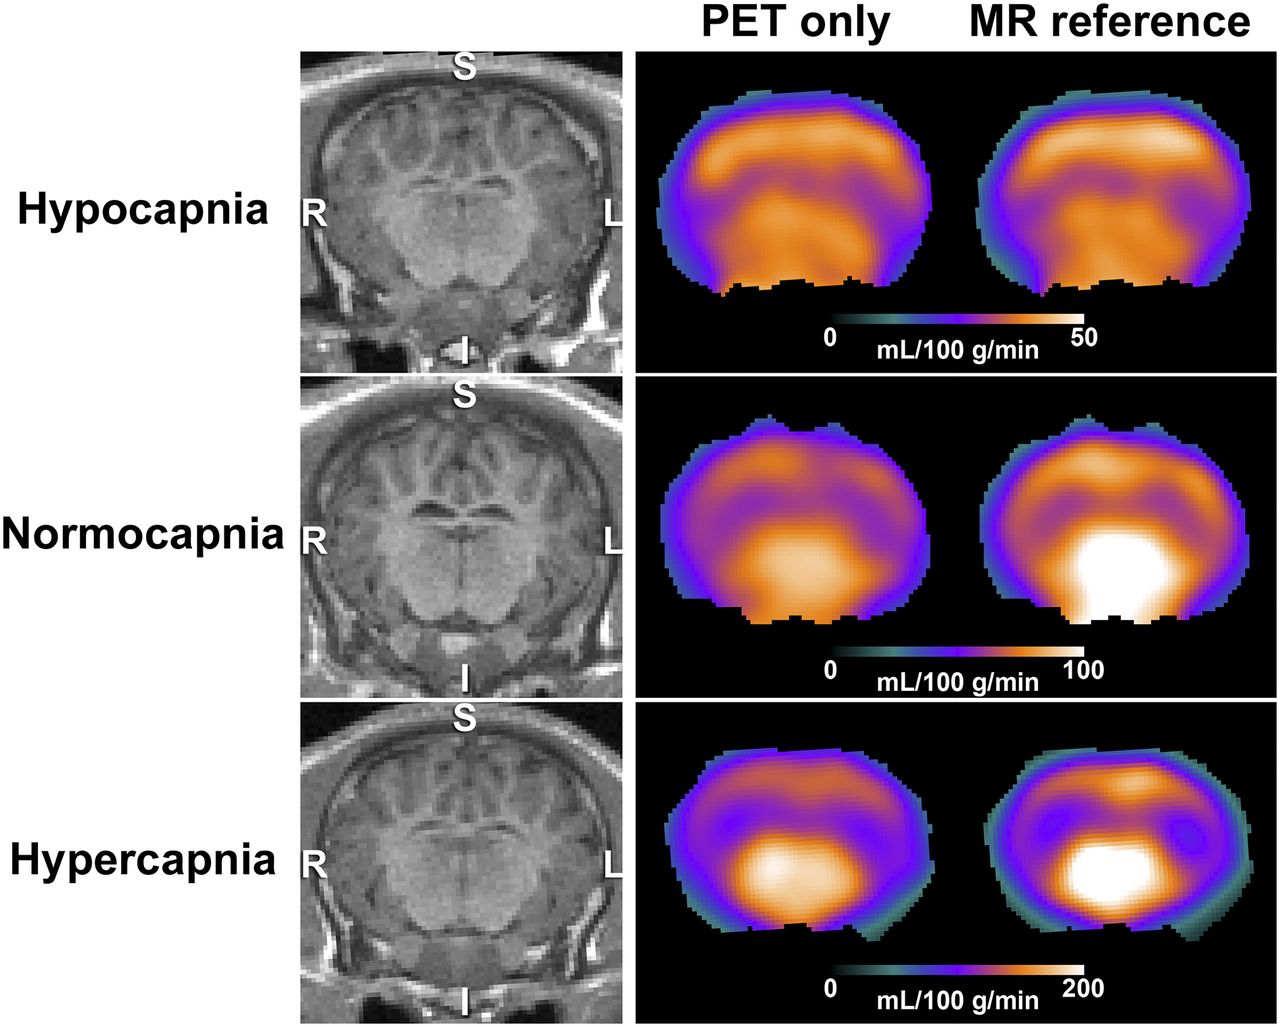
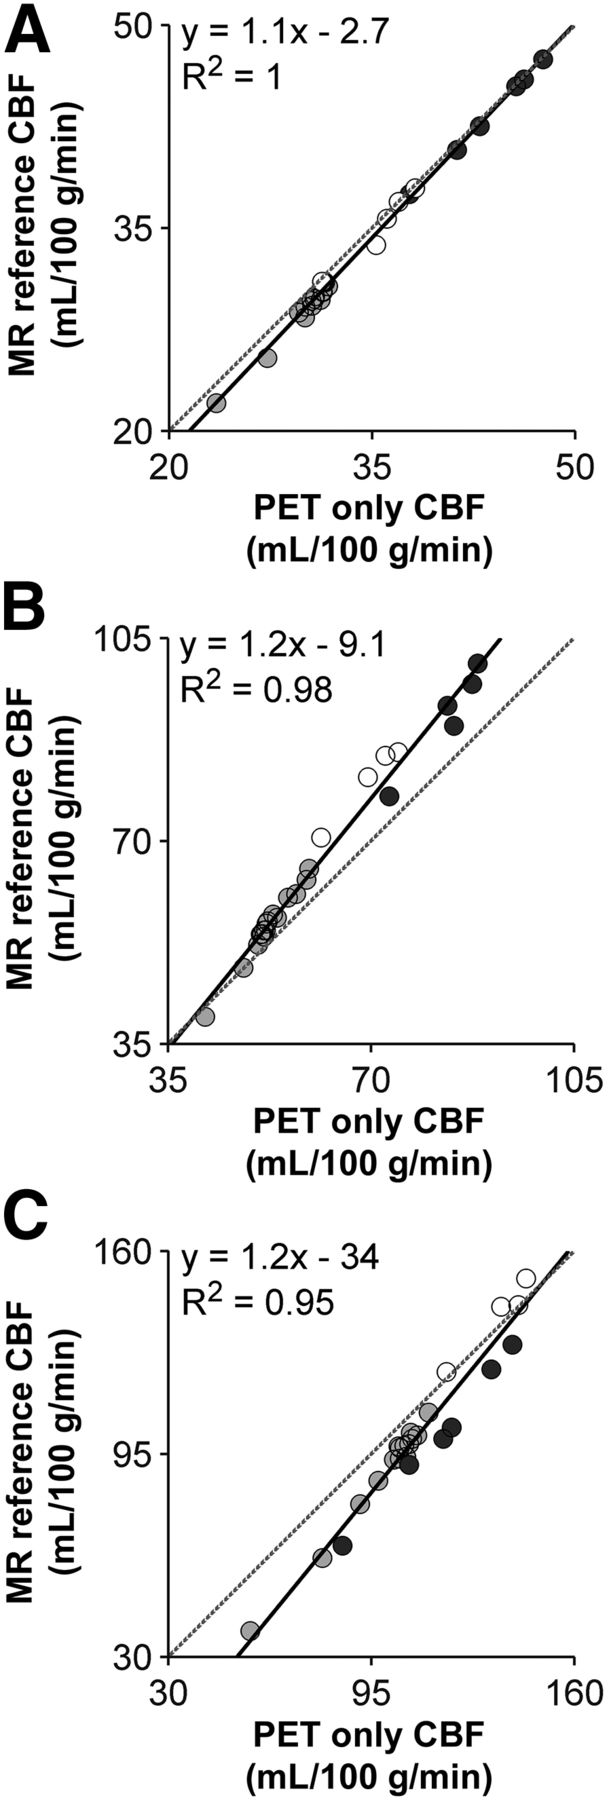
Representative CBF images generated by the PET-only technique (Eq. 1) and the MRI-reference method (Eq. 2) at each PaCO2 level are shown in Figure 3. Similar perfusion patterns were observed with both methods, with higher blood flow evident in cortical gray matter, thalamus, and cerebellum. At hypercapnia, the MRI-reference technique tended to yield higher estimates of CBF in the midbrain regions. Linear regression plots of the region-of-interest–based CBF values from the 2 techniques were generated to assess spatial agreement. Average regression parameters are summarized in Table 1. Example regional correlation plots at the 3 arterial CO2 tensions are shown in Figure 4.

CBF (mL/100 g/min) measured by PET-only and MRI-reference approaches from representative set of animals at 3 PaCO2 ranges. T1-weighted MR images are shown on left for anatomic reference. I = inferior; S = superior.

Regional CBF scatterplots in deep gray matter (○), cerebellum (●), and cortical gray matter ( ) at hypocapnia (A), normocapnia (B), and hypercapnia (C). Each plot is generated using data from one representative animal. Equation represents best fit of linear regression model.
DISCUSSION
The goal of this work was to develop a noninvasive 15O-water PET method of measuring CBF using hybrid imaging to avoid directly measuring AIF. Simultaneous PET/MRI provides the ability to use a reference-based method because global CBF can be measured by PC MRI, or alternatively, CBF in a specific brain region can be measured by arterial spin labeling. For this study, we chose the former because PC MRI is a fast and relatively simple technique to implement (31,32). In fact, it is often used in arterial spin labeling studies as a means of measuring labeling efficiency (26). Rather than simply normalizing PET activity images by an MRI measurement of global CBF, a modeling approach initially proposed by Mejia et al. (21) was implemented to account for the nonlinearity between PET activity and CBF. The accuracy of the method was tested in a porcine model because the animals have a relatively large brain with good gray-matter–to–white-matter contrast, as well as CBF values similar to those of humans (33). In addition, the use of an animal model enabled the technique to be evaluated over a wide range of flows (25–110 mL/100 g/min), which would be difficult to achieve with human participants. Average whole-brain CBF values measured at normocapnia (57.5 ± 10.0 and 54.3 ± 16.6 mL/100 g/min by PET and PC MRI, respectively) were in line with previous studies reporting values of between 45 and 62 mL/100 g/min (33–35). In addition, strong correlations between CBF values measured by PC MRI and 15O-water PET, both globally and regionally, were found.
Although PC MRI is an established technique for measuring global CBF (31,32), it has some technical limitations. Suboptimal imaging plane selection and coarse image resolution can result in partial-volume errors if voxels contain both moving fluids and stationary vessel-wall tissue (22,25,36,37). Additionally, the chosen velocity encoding can potentially introduce error: too small a value will lead to aliasing, whereas too large a value will result in a poor signal-to-noise ratio (23). To avoid these errors, the imaging plane was carefully based on a maximum-intensity projection of the TOF MR angiography, and the voxel size was chosen such that at least 9 voxels covered the lumen of the larger vessels. Lastly, velocity encoding was set to 80 cm/s (24) in order to measure both low and high flows at hypo- and hypercapnia, respectively. A recent study comparing CBF measurements from PC MRI and 15O-water PET in healthy human subjects reported only a moderate correlation between the 2 techniques and significantly higher values from PC MRI—up to a 63% overestimation (38). This result is in contrast to the current study, in which a strong correlation was found (slope, 0.88; intercept, 1.7 mL/100 g/min; R2 = 0.9 [Fig. 2A]) with an insignificant systematic bias of 0.16 ± 7.6 mL/100 g/min (Fig. 2B). It is difficult to know the specific reason for this difference. A contributing factor may be variability in CBF between MRI and PET measurements—a variability that was avoided in the current study by simultaneous acquisition. The systematic offset observed in the previous study may have been caused by phase errors in the nongated PC sequence due to flow pulsatility in the feeding arteries (32). Regardless of the reason, the discrepancy between the studies highlights the importance of ensuring the accuracy of the MRI method used for calibration.
Having established no significant difference in global CBF measured by PC MRI and 15O-water PET, we analyzed spatial agreement between CBF maps generated by the standard PET-only approach and those generated by the proposed MRI-reference method. Linear regression analysis of the regional CBF maps showed excellent correlations at all capneic conditions (R2 = 0.96–0.98). Good agreement was found at hypo- and normocapnia, as indicated by the near-unity regression slopes and small intercept values (Table 1) and as shown in the representative CBF maps (Fig. 3). There was less agreement at hypercapnia, as indicated by the larger regression slope and significant y-intercept (Fig. 4). These results reflect the differences observed in the CBF images, particularly in deep gray matter, and indicate a bias between the methods at higher flow rates. In the MRI-reference method, the discrepancy at hypercapnia may have been caused by neglect of blood-borne activity, whose relative contribution will increase with elevated CBF because of vessel dilation. Simulations (Supplemental Fig. 1; supplemental materials are available at http://jnm.snmjournals.org) predicted that this error should be fairly small for an integration time of 5 min. This insensitivity to the arterial blood activity is expected because the reference-based method depends only on the difference in blood volume between a voxel and the reference region. However, the error in a highly vascularized voxel could be greater if the ratio of CBV to CBF were greater than the model prediction, which was based on Ito et al. (39). An alternative explanation could be cross talk between fitting parameters for the PET-only approach (i.e., fi and CBVa), which could lead to an underestimation of CBF at high values.
Although this study demonstrated good agreement between CBF values from the MRI-reference approach and the gold standard PET-only approach over a flow range from about 30 to 100 mL/100 g/min, there are some potential limitations. First, internal dispersion was not included in the PET-only analysis because an appropriate value for a dispersion time constant is not known. However, it would likely be less than the 5 s commonly used in human studies, given the smaller size of these animals (weight, 20 kg). A second consideration is that the approach to positioning the PC slice was based on manual planning using TOF images. Recent studies have implemented automatic planning schemes that can optimize selection of the imaging plane (36).
CONCLUSION
We believe that our noninvasive hybrid PET/MRI approach might prove useful in patients for whom obtaining accurate CBF measurements is challenging by other methods, most notably arterial spin labeling, because of transit time delays resulting from significant vascular disease. Eliminating arterial sampling not only makes the MRI-reference approach minimally invasive but also avoids noise contributions from AIF and associated errors due to dispersion and delay.
DISCLOSURE
This work was funded through grants from the Canadian Institutes of Health Research, the Alzheimer’s Drug Discovery Foundation, the Canadian Foundation of Innovation, St. Joseph’s Health Care London, and the Lawson Health Research Institute. No other potential conflict of interest relevant to this article was reported.
Acknowledgments
We thank Heather Biernaski, John Butler, Jeff Corsaut, Jennifer Hadway, Justin Hicks, Lynn Keenliside, and Laura Morrison for technical support; Gabriel Keenleyside and Linshan Liu for helpful advice; and Dr. Hidehiro Iida from the National Cardiovascular Center in Osaka, Japan, for his suggestions.
Footnotes
Published online Mar. 9, 2018.
- © 2018 by the Society of Nuclear Medicine and Molecular Imaging.
REFERENCES
- Received for publication October 12, 2017.
- Accepted for publication February 12, 2018.


