


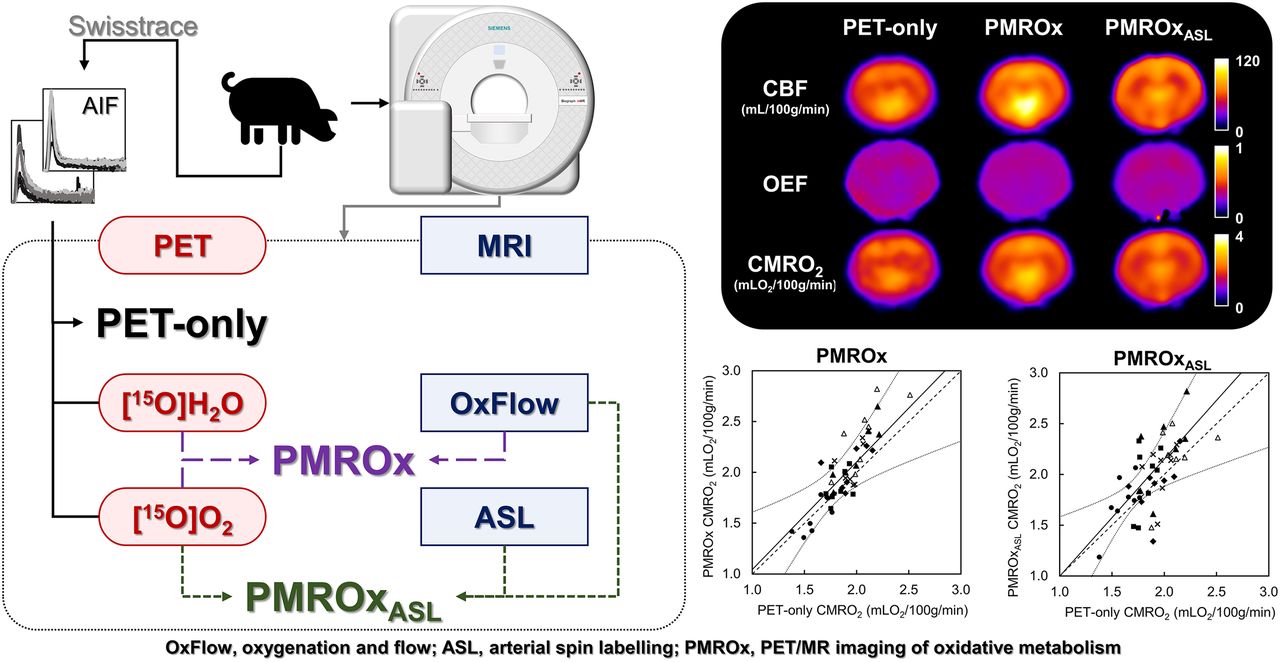
Visual Abstract

Abstract
The gold standard for imaging the cerebral metabolic rate of oxygen (CMRO2) is PET; however, it is an invasive and complex procedure that also requires correction for recirculating 15O-H2O and the blood-borne activity. We propose a noninvasive reference-based hybrid PET/MRI method that uses functional MRI techniques to calibrate 15O-O2 PET data. Here, PET/MRI of oxidative metabolism (PMROx) was validated in an animal model by comparison to PET-alone measurements. Additionally, we investigated if the MRI perfusion technique arterial spin labeling (ASL) could be used to further simplify PMROx by replacing 15O-H2O PET, and if the PMROx was sensitive to anesthetic-induced changes in metabolism. Methods: 15O-H2O and 15O-O2 PET data were acquired using a hybrid PET/MR scanner, together with simultaneous functional MRI (OxFlow and ASL), from juvenile pigs (n = 9). Animals were anesthetized with 3% isoflurane and 6 mL/kg/h propofol for the validation experiments, and arterial sampling was performed for PET-alone measurements. PMROx estimates were obtained using whole-brain (WB) CMRO2 from OxFlow and local cerebral blood flow (CBF) from either noninvasive 15O-H2O PET or ASL (PMROxASL). Changes in metabolism were investigated by increasing the propofol infusion to 20 mL/kg/h. Results: Good agreement and correlation were observed between regional CMRO2 measurements from PMROx and PET alone. No significant differences were found between OxFlow and PET-only measurements of WB oxygen extraction fraction (0.30 ± 0.09 and 0.31 ± 0.09) and CBF (54.1 ± 16.7 and 56.6 ± 21.0 mL/100 g/min), or between PMROx and PET-only CMRO2 estimates (1.89 ± 0.16 and 1.81 ± 0.10 mLO2/100 g/min). Moreover, PMROx and PMROxASL were sensitive to propofol-induced reduction in CMRO2. Conclusion: This study provides initial validation of a noninvasive PET/MRI technique that circumvents many of the complexities of PET CMRO2 imaging. PMROx does not require arterial sampling and has the potential to reduce PET imaging to 15O-O2 only; however, future validation involving human participants are required.
- cerebral blood flow
- cerebral metabolic rate of oxygen
- noninvasive PET
- oxygen extraction fraction
- PET/MRI
PET imaging of cerebral oxidative metabolism was developed over 30 y ago and continues to prove a vital tool for understanding brain energetics and the role of altered metabolism in disease processes (1–3). PET remains the gold standard for imaging the cerebral metabolic rate of oxygen (CMRO2); however, the original procedure is complex and long (4). In addition to radiolabeled oxygen, 15O-H2O is needed to measure cerebral blood flow (CBF) and 15O-CO to measure the cerebral blood volume (CBV). Arterial blood sampling is required for each tracer, along with separating plasma and red blood cell activity for 15O-O2 to account for the increasing signal contribution from metabolically generated 15O-H2O (recirculating water, RW). Efforts to reduce the complexity and duration of the original procedure have led to modeling approaches that eliminate the need for separate CBV imaging and estimating RW without separating blood samples (5). Alternately, the effects of RW can be minimized by short scan times after a single inhalation of 15O-O2 (6). More recently, approaches incorporating image-derived input functions have been proposed to avoid measuring the arterial input function (AIF), which is an invasive and inherently noisy procedure (7,8). However, the accuracy of these approaches depends on either an empiric factor relating the total AIF and its RW component, or careful measurement of a coefficient to scale the arterial time–activity curve.
We propose an alternative method to reduce the complexity, invasiveness, and duration of CMRO2 imaging (9). Similar to Su et al. (8), this method takes advantage of simultaneous PET/MRI. However, rather than attempting to use MRI to help extract the AIF, the proposed hybrid approach incorporates complementary MRI techniques to measure whole-brain (WB) CMRO2 to serve as a reference to calibrate dynamic 15O-oxygen PET data. Analogous to a similar PET/MR technique for imaging CBF (10), this hybrid approach eliminates the need for arterial sampling. Here, we implemented this reference-based approach, hereafter referred as PMROx (PET/MRI of oxidative metabolism), on a 3-T PET/MR scanner. The aim of this study was to validate PMROx in a large animal model by comparison with a previously validated dual-basis function method (DBFM) (11). In addition, we investigated if PMROx could be further simplified by incorporating CBF images from the MRI-based technique arterial spin labeling (ASL). This modification reduces PET imaging to only 15O-O2 and imaging duration to approximately 5 min since the MRI sequences can be run during the PET acquisition (12). In addition to validating PMROx, its sensitivity to changes in metabolism was investigated by altering the anesthetics administered to the animals.
MATERIALS AND METHODS
Animal experiments were conducted according to the regulations of the Canadian Council of Animal Care and approved by the Animal Care Committee at Western University. Before imaging, juvenile Duroc pigs were tracheotomized, and catheters were inserted into the cephalic veins and femoral arteries. During imaging, animals were mechanically ventilated, immobilized on a custom platform, and anesthetized with 3% isoflurane and 6 mL/kg/h propofol. Blood samples were collected to measure the partial pressures of oxygen and carbon dioxide, plasma glucose concentration, hematocrit, and hemoglobin concentration. Throughout the experiment, end-tidal O2 and CO2, temperature, heart rate, and oxygen saturation were monitored to ensure normal levels.
Study Protocol
PET and MRI data were obtained on a 3-T Siemens Biograph mMR system using a 12-channel PET-compatible receiver head coil (Siemens GmbH). Each experiment was divided into 2 parts. First, the accuracy of PMROx was evaluated by comparing with the DBFM, which required measuring the AIFs of 15O-H2O and 15O-O2. Next, the sensitivity of PMROx to the expected reduction in cerebral metabolism was assessed by increasing the infusion rate of propofol to 20 mL/kg/h to induce a lower metabolic condition (LMC).
In both parts, PET imaging involved injecting 15O-H2O to measure CBF, followed by inhalation of 15O-O2 to measure oxygen extraction fraction (OEF). Concurrently, WB CMRO2 was obtained by the MRI sequence OxFlow (13), which combines phase-contrast MRI measurements of CBF from the internal carotid and basilar arteries, with venous oxygen saturation (SvO2) measurements from the superior sagittal sinus acquired with susceptibility-based oximetry (14). CBF images were collected using pseudocontinuous ASL (pCASL). At the end of the experiment, the animal was euthanized according to the animal care guidelines and transported to a CT scanner to obtain a postmortem CT-based attenuation correction map.
PET Imaging and Postprocessing
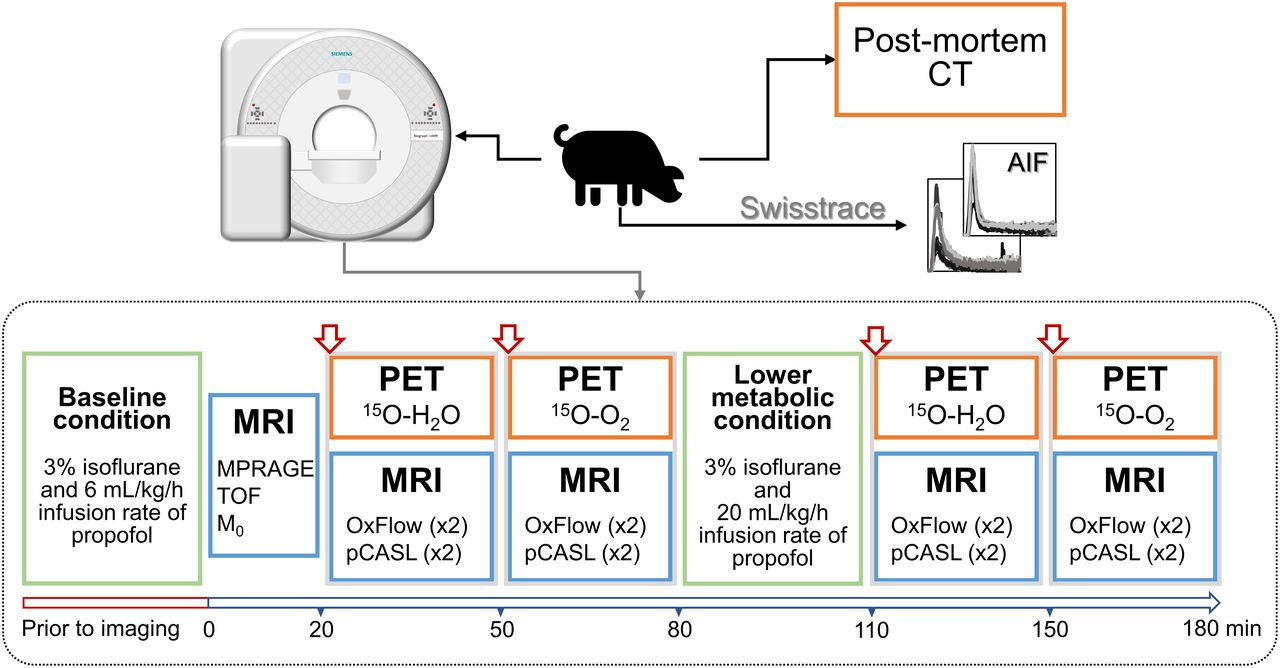
The PET protocol (Fig. 1) began with injection of 15O-H2O (460 ± 80 MBq; cephalic vein), followed by inhalation of 2,200 MBq of 15O-O2. All acquisitions involved 5 min of list-mode acquisition. For DBFM, AIFs from 15O-H2O (
 ) and 15O-O2 (
 ) were determined by withdrawing blood from a femoral artery and measuring the activity using an MR-compatible system (Swisstrace GmbH). 15O-O2 PET data acquisition during the LMC started approximately 1 h after the first 15O-O2 acquisition to allow the animal to stabilize after changing the anesthetics.

Protocol diagram showing imaging blocks acquired at baseline and under lower metabolic condition. Before imaging, animal was positioned in scanner and anesthetic was applied. At time zero, MRI was started, and onsite cyclotron was contacted to produce 15O-H2O dose, which was injected at 20-min mark. There was a delay of approximately 20 min before 15O-O2 delivery. After first 15O-O2 imaging block, propofol infusion rate was increased to 20 mL/kg/h.
15O-H2O and 15O-O2 were produced by (d,n) 14N reaction in an onsite cyclotron (PETtrace 800, 16.5 MeV; GE Healthcare) (15). For 15O-O2 imaging, the radioactive gas was filtered before being transferred to the PET/MR suite via a stainless-steel line (202-m long, 3-mm diameter). The line was connected to polyethylene tubing that directly fed into the inhalation tube of the animal (delivery rate of 1.5 L/min for 30 s). Expired gas was collected in a 200-L tank to hold it for 7 half-lives (16).
Dynamic PET images were reconstructed into 48 time frames (30 × 3, 6 × 5, 6 × 10, and 6 × 20 s) using the Siemens e7-tools suite with a 3-dimensional ordered subset expectation maximization method (iterations/subsets, 4/21; matrix size, 344 × 344 × 127 voxels; field of view [FoV], 359 × 359 × 258 mm3; voxel size, 1 × 1 × 2 mm3; zoom factor, 2). Raw data were corrected for decay, random incidences, dead-time, detector normalization, data rebinning, and scatter. Absolute scatter correction was used for the 15O-O2 images, as recommended for 3-dimensional scanning (17). Reconstructed images were smoothed by a 4-mm gaussian filter.
AIFs were decay corrected and denoised using a wavelet signal denoising function (MATLAB R2017b, Block James-Stein method). The RW (
 ) component of the measured 15O-O2 AIF was estimated using species-specific values after interpolating to the differences in weight (18).
MR Imaging and Postprocessing
MR acquisition (Supplemental Fig. 1; supplemental materials are available at http://jnm.snmjournals.org) began with T1-weighted images (magnetization-prepared rapid gradient-echo sequence, MPRAGE; repetition/echo/inversion times [TR/TE/TI], 2,000/2.98/900 ms; flip angle [α], 9°; FoV, 256 × 256 mm2; 176 slices; isotropic voxel size, 1 mm3), followed by time-of-flight images to identify the feeding arteries for phase-contrast imaging (TR/TE, 22/3.75 ms; α, 18°; FoV, 200 × 181 mm2; 102 slices; voxel size, 0.3 × 0.3 × 1.5 mm3; 40 mm saturation band) and the sagittal sinus for oximetry imaging (no saturation band).
MR images acquired during PET acquisitions were OxFlow and pCASL. The former alternates between the 2 slice locations to measure WB CBF and SvO2 (TR/TE/ΔTE, 35/7.025/2.5 ms; α, 25°; FoV, 208 × 208 mm2; voxel size, 1.6 × 1.6 × 5.0 mm3; velocity encoding, 60 cm/s; acquisition time, 1 min) (13). The acquisition of the OxFlow sequence was timed to coincide with the 15O-O2 imaging, and the resultant images represent an average over the 1-min scan to provide a stable reference measurement. Immediately after, a 3-dimensional pCASL sequence was run (19) (TR/TE, 3,720/22.9 ms; FoV, 208 × 208 mm2; 16 slices; voxel size, 3.3 × 3.3 × 5.0 mm3; postlabeling delay/labeling duration, 1,500/1,800 ms; label plane offset, 60 mm; 16 measurements). Lastly, proton density-weighted images were acquired by turning off the labeling or background suppression pulses (M0; TR, 7,000 ms).
OxFlow images were analyzed following the approach outlined by Jain et al. (14). Briefly, regions of interest were semiautomatically drawn in and surrounding the vessels on the magnitude image, then transferred to the phase image to measure the mean phase difference in the feeding arteries, and between the sagittal sinus and the surrounding tissue. The pCASL images were motion corrected, coregistered to M0, and smoothed with a 4-mm gaussian filter. CBF images were generated using the standard 1-compartment model (12). For this analysis, the blood–brain partition coefficient of water was 0.90 mL/g, the longitudinal relaxation time of blood was 1.65 s, and the labeling efficiency was assumed to be 0.86. Images were coregistered to the PET space using SPM12 (https://www.fil.ion.ucl.ac.uk/spm/).
PET-Only Imaging: DBFM
CBF (
 ) maps were generated from 15O-H2O PET by fitting the following equation to the local time–activity curves (
 ):
):
 Eq. 1
where * represents convolution. The fitting parameters were
Eq. 1
where * represents convolution. The fitting parameters were
 (clearance rate constant),
 , and
, and
 (arterial blood volume). OEF (
 ) and CMRO2 measurements were obtained by fitting 15O-O2 PET data to Equation 2 (11).
 Eq. 2
where
Eq. 2
where
 is the 15O-O2 component of the AIF. The fitting parameters were
 ,
,
 and
and
 (15O-O2 and 15O-H2O blood volumes, respectively). All fitting was performed in MATLAB using the optimization routine fmincon. CMRO2 was calculated from Fick’s principle as
 , where
 ,
,
 is the hemoglobin concentration, and
 (arterial saturation of oxygen) was estimated using the
 (partial pressure of oxygen) measurements (20). A glossary of variables is provided in the supplemental data.
PMROx
PMROx CMRO2 images were generated from 15O-O2 PET data using Equation 3, which was derived from the 1-tissue-compartment model (9).
 Eq. 3
where T is scan time. Local OEF was calculated by
Eq. 3
where T is scan time. Local OEF was calculated by
 . Both
 and
and
 were obtained from OxFlow, the latter by:
 Eq. 4
Eq. 4
CBF (Eq. 5) was obtained using the noninvasive PET/MR approach described by Ssali et al. (10), in which WB CBF is used to calibrate 15O-H2O PET data. In both Equations 3 and 5, WB CMRO2, CBF, and time–activity curve are used as scalers to obtain the corresponding local values. Alternatively for CBF, a direct scaling approach could be implemented (21).
 Eq. 5
Eq. 5
The feasibility of implementing pCASL into the PMROx approach (PMROxASL) was also evaluated. In this case,
 in Equation 3 was obtained from the CBF images generated by pCASL.
Regional CBF, OEF and CMRO2 Measurements
Volumes of interest (VOIs) were semiautomatically drawn on the MPRAGE images for each animal and then transferred to the corresponding CBF, OEF and CMRO2 images. Measurements were made for cerebellum (4.2 ± 0.7 cm3); diencephalon (4.7 ± 0.6 cm3); and frontal (2.4 ± 0.6 cm3), occipital (7.9 ± 1.5 cm3), parietal (9.1 ± 1.6 cm3), and temporal (6.0 ± 0.6 cm3) lobes. All images were registered to the anatomic image of 1 animal to generate groupwise maps using SPM12.
Statistics
Local measurements were compared using linear regression to obtain the Pearson correlation coefficient (ρ). Any potential bias was assessed using a 1-sample t test. Paired t tests were performed to evaluate differences between measurements. Statistical significance was defined by P < 0.05, and Bonferroni adjustment was performed when necessary. Measurements are expressed in terms of mean ± SD. Statistical tests were performed using SPSS (version 26, https://www.ibm.com/analytics/spss-statistics-software).
RESULTS
Data from 9 juvenile pigs were collected (age range, 8–10 wk; weight, 19 ± 2 kg; 5 female). In 1 experiment, only 15O-H2O data were acquired due to a technical issue with the 15O oxygen line. The LMC was successfully induced in 6 animals. Supplemental Table 1 provides a summary of arterial blood measurements during baseline and LMC.
AIFs could not be acquired in 3 cases (1 15O-H2O and 2 15O-O2) due to clotting of the sampling line. In these cases, population-based AIFs were used after using a scaling factor for each animal individually. For the 15O-H2O case, the AIF was scaled by the injected dose (MBq). Because the administered activity was unknown for 15O-O2, the AIF was scaled to the mean jaw muscle activity (
 ) measured from a 50-mm2 ROI. The appropriate scaling factor was determined by a combination of principal component and multiple linear regression analyses involving the remaining 6 measured AIFs. The factors included body weight (kg), endotracheal tube peak activity (kBq/mL), mean jaw muscle activity concentration (kBq/mL), and partial pressure of carbon dioxide (mm Hg). The resulting model equation was subsequently used to scale the population-based AIF for each animal. Principal component analysis and multiple linear regression identified mean jaw muscle activity concentration (
 ) as a significant component for estimating the scaling factor of 15O-O2 (
 ;
;
 ). Supplemental Figure 2 presents a comparison between 15O-O2–measured AIFs with their respective scaled population-based curves; the blue curves represent the population-based AIFs used for the 2 animals for which arterial sampling failed.
Validation
Average WB estimates of CBF, OEF and CMRO2 from PET and PET/MR were in good agreement, with no significant differences between techniques: 56.6 ± 21.0 mL/100 g/min, 0.31 ± 0.09, and 1.81 ± 0.10 mLO2/100 g/min from DBFM and 54.1 ± 16.7 mL/100 g/min, 0.30 ± 0.09, and 1.89 ± 0.16 mLO2/100 g/min from OxFlow/PMROx, respectively. Average WB-
 from 15O-H2O PET was 9.5 ± 4.0 mL/100 g, and WB
 and
and
 values from 15O-O2 PET were 7.0 ± 1.0 mL/100 g and 2.6 ± 6.7 mL/100 g, respectively. WB
 was small (<2 mL/100 g) for 7 of 8 animals; however, in 1 outlier it was 19.1 mL/100 g.
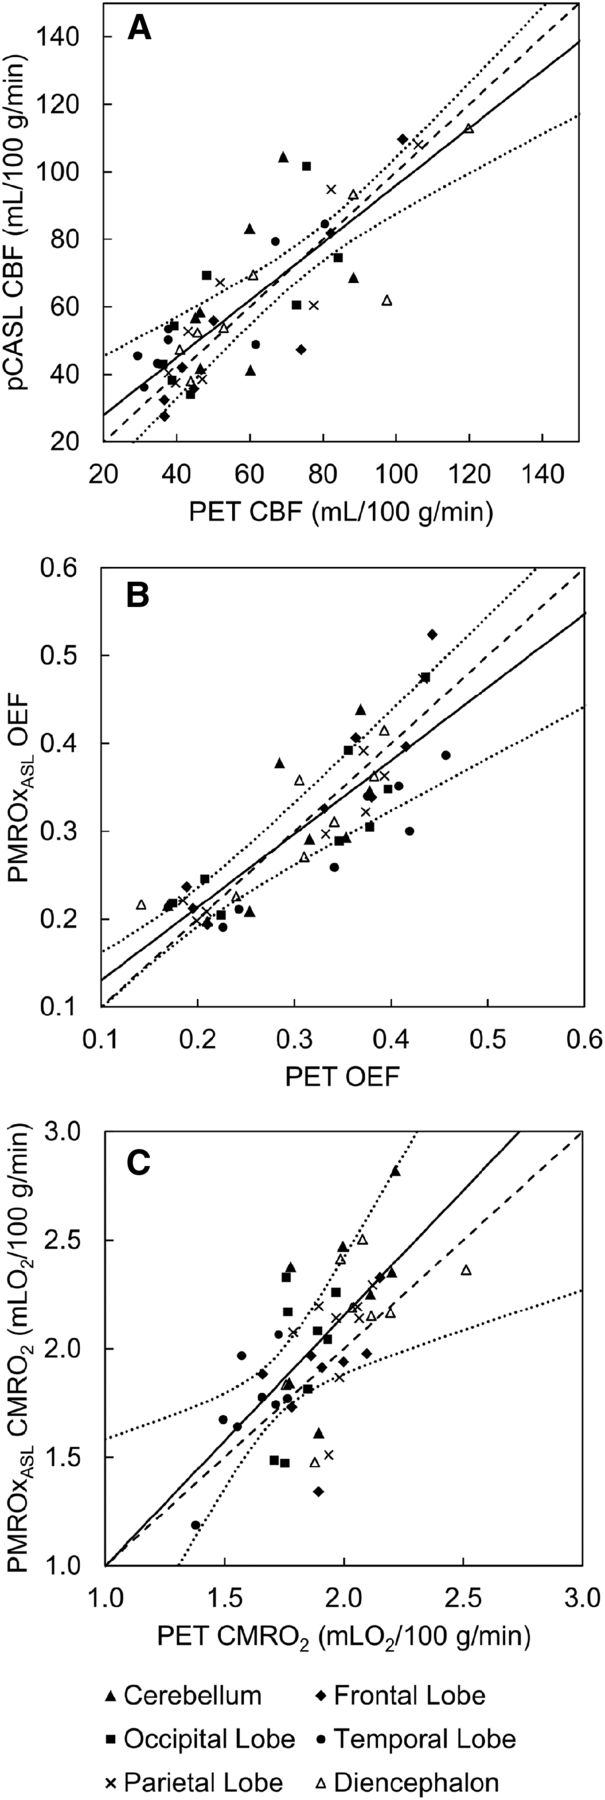
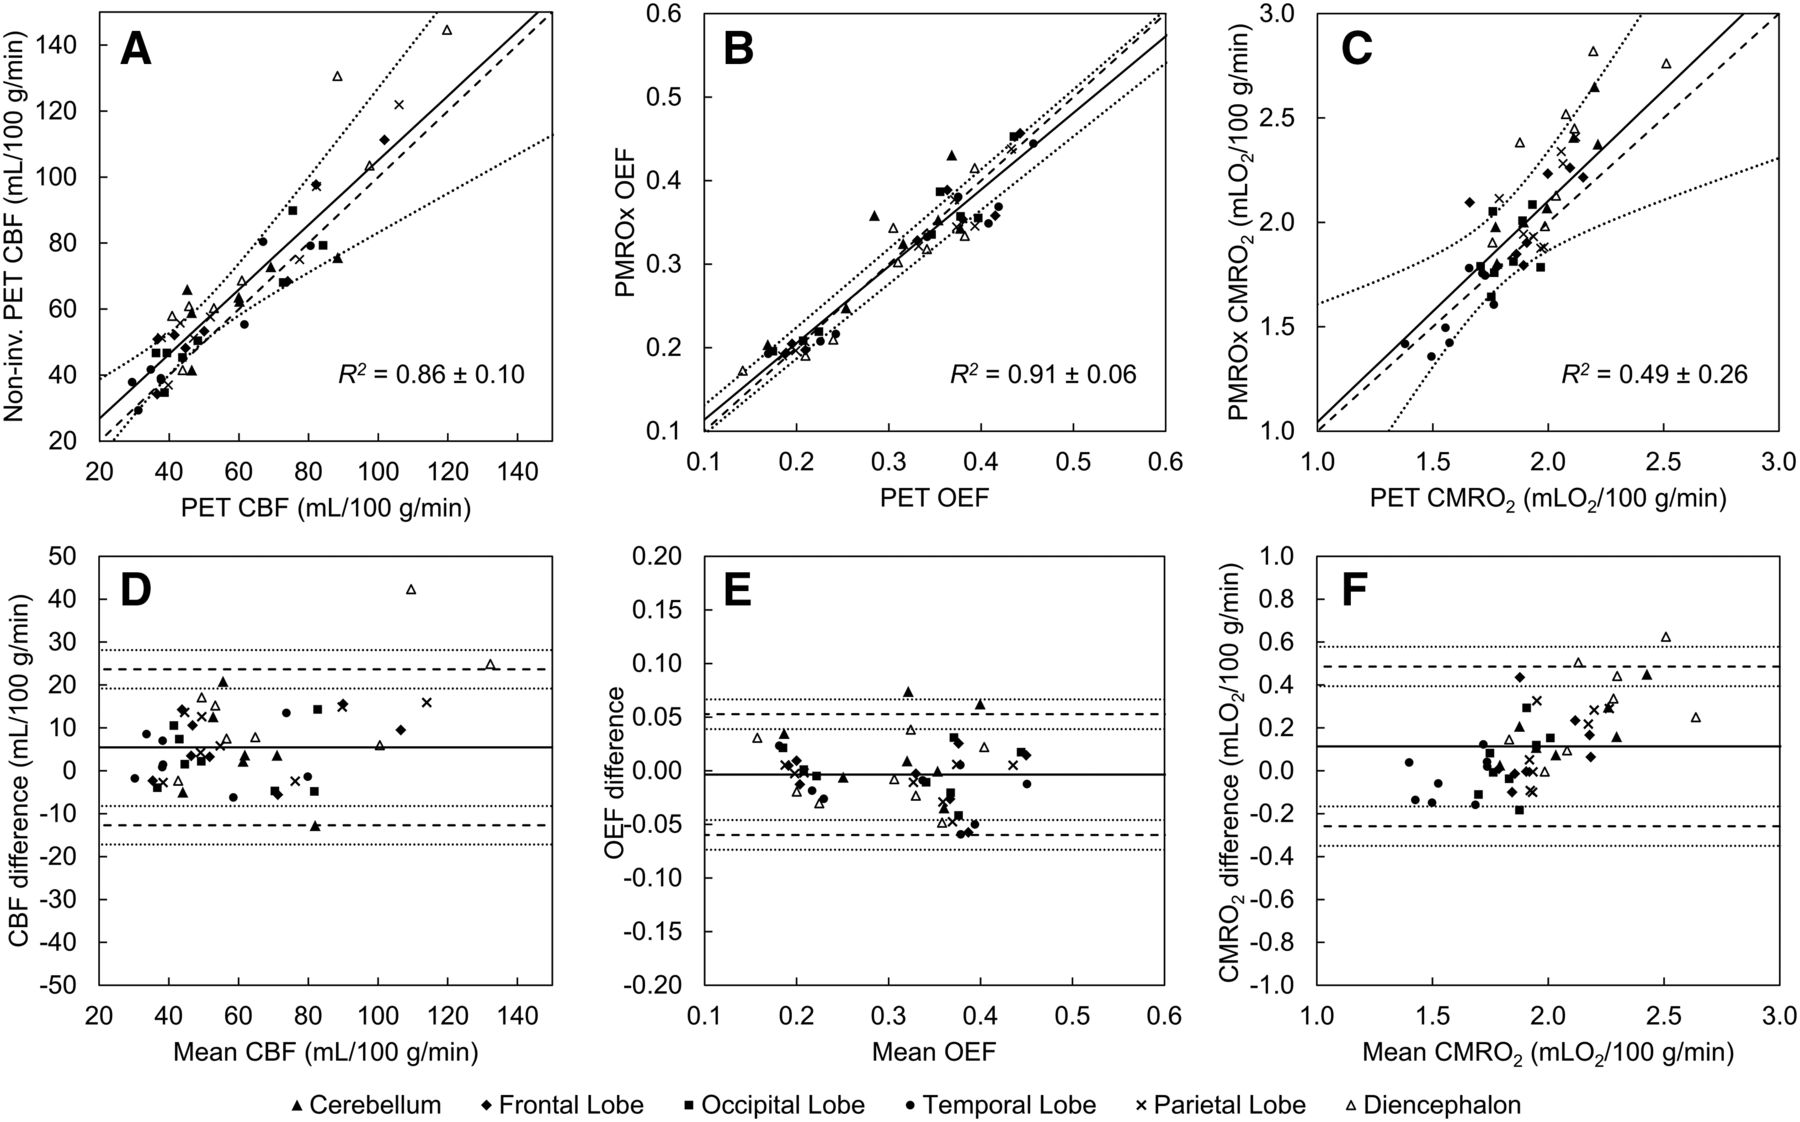
Regional results of regression and correlation (Fig. 2) analyses from CBF, OEF, and CMRO2 measurements are summarized in Table 1. Significant correlations between regional CBF estimates from noninvasive PET/MR and DBFM were observed in all VOIs. The Bland–Altman plot indicated a bias in local CBF measurements by noninvasive PET/MR for the parietal lobe (7.7 mL/100 g/min, P = 0.02) and diencephalon (14.8 mL/100 g/min, P = 0.02). Strong correlations between regional OEF estimates from PMROx and DBFM were observed (Figs. 2B and 3). Finally, regression between CMRO2 estimates from the 2 techniques revealed good agreement, with a moderate correlation and a small bias in the PMROx measurements for the cerebellum (0.16 mLO2/100 g/min, P = 0.03) and diencephalon (0.30 mLO2/100 g/min, P < 0.01).

(A) Local baseline CBF from noninvasive PET/MR and DBFM. Average regression line is represented by solid line (
 ; 95% confidence interval [CI] is represented by dotted lines). Dashed line is identity line. Corresponding OEF (B) and CMRO2 (C) results presented average regression line of
 and
and
 , respectively. Bland–Altman plots from corresponding data are presented in D–F, where mean is represented by solid line. Dashed lines represent limits of agreement (±2 SD), each with its 95% CI (dotted lines). Mean difference for all VOIs was 6.2 mL/100 g/min for CBF, −0.004 for OEF, and 0.12 mLO2/100 g/min for CMRO2.
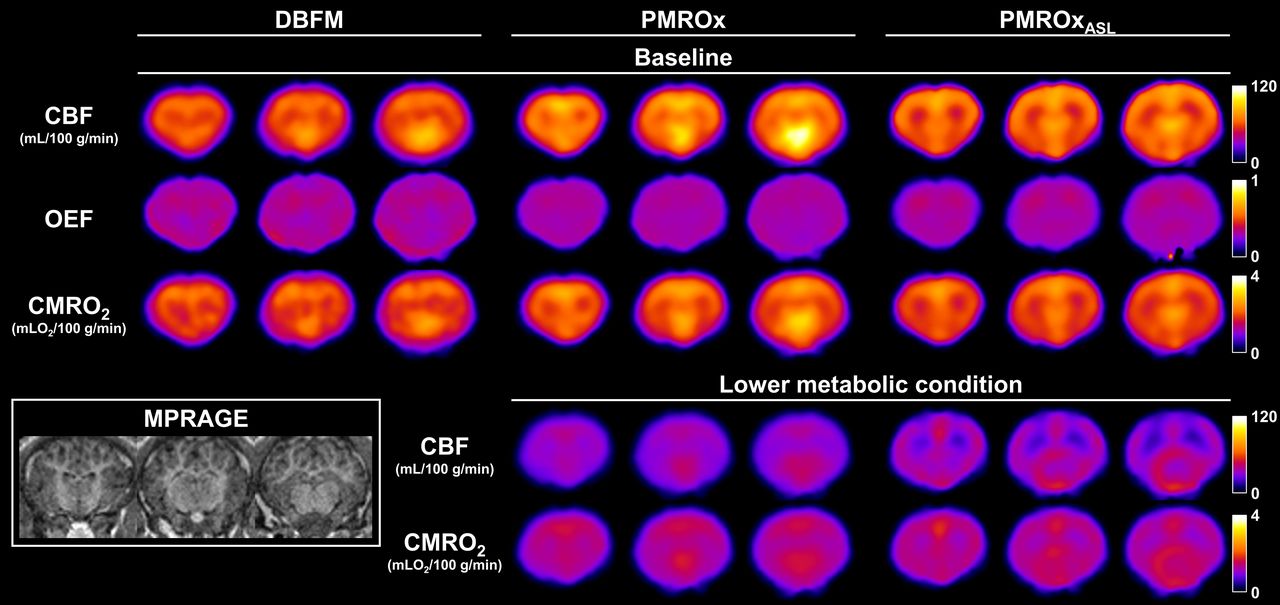
Groupwise CBF, OEF, and CMRO2 images obtained with DBFM, PMROx, and PMROxASL techniques for baseline (n = 8, top 3 rows). CBF and CMRO2 results from PMROx and PMROxASL for lower metabolic condition (n = 6) are presented on bottom 2 rows. MPRAGE from 1 animal was included for anatomic reference.
Summary of Regression and Correlation Analyses Performed on Local Baseline Measurements (n = 8) of CBF (mL/100 g/min), OEF, and CMRO2 (mLO2/100 g/min)
PMROxASL
Average WB estimates of CBF and CMRO2 from pCASL and PMROxASL were 58.6 ± 20.4 mL/100 g/min and 1.88 ± 0.24 mLO2/100 g/min, respectively, which were not significantly different from the PET-only results. Regional measurements were successfully extracted from all VOIs (Table 1; Figs. 3 and 4), except for the cerebellum from 1 animal because this region was missing in the pCASL FoV. Strong correlations between DBFM and pCASL CBF estimates were observed, as well as between DBFM and PMROxASL OEF estimates, with a small bias in the temporal lobe (–0.048, P = 0.02). CMRO2 values from PMROxASL and DBFM showed a moderate correlation.
(A) Local baseline CBF from pCASL and DBFM. Average regression line is represented by solid line (
 ; 95% confidence interval [CI] is represented by dotted lines). Dashed line is identity line. Corresponding OEF (B) and CMRO2 (C) results presented average regression line of
 and
and
 , respectively.
Lower Metabolic Condition
For the 6 animals in which measurements were acquired under both conditions, propofol caused WB CBF to decrease to 27.3 ± 7.0 and 29.9 ± 6.4 mL/100 g/min for OxFlow and pCASL, respectively (50% reduction; Figs. 3 and 5A). There was a corresponding significant increase in OEF of 0.11 ± 0.06 (Fig. 5B) measured by OxFlow, and a significant reduction in WB-CMRO2 measured by PMROx and PMROxASL of 0.68 ± 0.36 and 0.67 ± 0.36 mLO2/100 g/min, respectively (Figs. 3 and 5C).

WB CBF (A), OEF (B), and CMRO2 (C) values for baseline and LMC. Significant reductions in WB-CBF and WB-CMRO2 were observed for both techniques, whereas significant increase was observed for WB-OEF.
DISCUSSION
15O-O2 PET has been used extensively to assess disruptions in cerebral energy metabolism, such as after stroke, predicting its risk of recurrence, and understanding energy regulation during functional activation (22). Despite the proven value of 15O-O2 PET, the procedure is complex and invasive, which has led to a diminishing number of sites with the necessary expertise to conduct 15O-O2 studies. This trend highlights the value to develop simpler 15O-O2 imaging protocols that retain the inherent quantitative capabilities of PET. This study focused on validating a hybrid PET/MR technique developed specifically to address this issue. The possibility of using PET/MR to update 15O-O2 imaging was investigated by Su et al., who used MRI to extract image-derived AIFs (8). The current study explored an alternative approach using WB MRI measurements as a reference, which avoids potential registration and partial-volume errors. PMROx is also less sensitive to errors caused by RW and the CBV since regional CMRO2 is determined from the ratio of time–activity curves.
Validation experiments were conducted using a porcine model and involved imaging CMRO2 independently using the previously validated DBFM (11). For this method, an MR-compatible arterial sampling system was used to measure the AIF for both tracers. Good agreement between PMROx and DBFM was found across VOIs with respect to both OEF and CMRO2, although a small bias was observed in the PMROx CMRO2 estimates (Fig. 2F). Regression analysis also demonstrated strong and moderate correlations between techniques for OEF and CMRO2, respectively. The lower correlation for the latter is explained by its dependency on both OEF and CBF. In addition to the agreement with DBFM, PMROx was shown to be sensitive to reduced energy metabolism caused by increasing the propofol infusion. The CMRO2 reduction was driven by the propofol-induced decrease in CBF, since propofol caused an increase in OEF. These findings are in agreement with Oshima et al. who reported that propofol caused proportional decreases in CBF and CMRO2 but had no effect on the arteriovenous oxygen difference (23).
Because the PMROx approach scales the 15O-O2 images by an MRI estimate of WB CMRO2, its accuracy and precision will be directly affected by the MRI methods used to calculate WB OEF and CBF. In this study, WB OEF and CMRO2 were measured by OxFlow, which can be acquired with scan times as short as 8 s with reproducibility of 2% for SvO2 and 6% for WB CMRO2 (24). The accuracy of OxFlow depends on positioning the slices orthogonally to the main magnetic field, correcting for magnetic field inhomogeneities, and using sufficient image resolution to avoid partial-volume effects (13). The current study presents, to our knowledge, the first simultaneous comparison of OxFlow to 15O-H2O and 15O-O2 PET, and no significant differences were found between techniques. This agreement is in accordance with 2 recent studies comparing MR measurements of SvO2 with either PET or direct measures from the jugular blub (25,26).
PET/MR also provides the possibility of reducing the PET procedure to just 15O-O2 inhalation by replacing 15O-H2O PET with ASL (PMROxASL). WB CBF estimates from pCASL were in good agreement to those obtained by 15O-H2O PET, similar to previous ASL/PET comparisons conducted using a swine model (10,27). Strong correlations between regional CBF measurements were found for all VOIs except the cerebellum, which was attributed to limited spatial coverage for the pCASL sequence. Recent studies comparing ASL with PET involving human participants indicate that ASL can provide accurate CBF measurements with careful attention to common sources of error (28), including low signal-to-noise ratio and sensitivity to transit times (29). Consequently, translation to clinical studies remains an active area of research as factors such as cerebrovascular disease and ageing can impact its accuracy (30).
A challenge with PET-only imaging is correcting for signal contamination from the CBV (4). Blood volume terms were incorporated into the fitting procedure for both tracers. Although the average
 was larger than reported in human studies, it is in accordance with Olsen et al. who reported values from 9 to 18 mL/100 g in pigs, depending on partial pressures of carbon dioxide levels (31). The
 values were smaller because they are scaled by OEF and the venous fraction. WB
 estimates were very small for most animals, as expected, as it only becomes significant in highly vascularized regions (11). In 1 animal,
 reached a nonphysiologic value, which was likely a result of estimating
 using a physiologic model.
Although this study demonstrated the advantages of PET/MRI for imaging CMRO2 (32), this modality is not widely accessible and requires an onsite cyclotron for 15O-O2 production. A potential limitation with the current study was the indirect methods used to account for RW and CBV in the DBFM, rather than direct measurements; however, this approach has been previously validated (11). Lastly, Figure 2F indicates that the discrepancy between PMROx and DBFM increased as the difference between local and WB OEF values increased, which is attributed to neglecting RW by PMROx. It should be possible to reduce this error by incorporating an RW term in the model equation (9).
CONCLUSION
This study presents the validation of a noninvasive hybrid PET/MR technique to image CMRO2 that requires a short inhalation of 15O-O2, followed by 5 min of PET and simultaneous MRI. Good agreement between CMRO2 values from PMROx and the DBFM was found, and the proposed method was shown to be sensitive to reduced cerebral metabolism induced by increasing the anesthetic level.
DISCLOSURE
This work was supported by the Canadian Institutes of Health Research, grant 148600. No other potential conflict of interest relevant to this article was reported.
KEY POINTS
QUESTION: Can the CMRO2 be quantified using MRI functional measurements to calibrate 15O-O2 PET?
PERTINENT FINDINGS: The proposed PMROx approach resulted in CMRO2 values comparable to those obtained from a PET-only technique. PMROx was further simplified by incorporating ASL, and it proved sensitive to anesthetic-induced changes in metabolism.
IMPLICATIONS FOR PATIENT CARE: PMROx is a noninvasive technique that requires only 15O-O2, which facilitates its application in human studies, and it may prove to be a useful tool to better understand disorders characterized by disruptions in the cerebral oxidative metabolism.
Footnotes
Published online March 19, 2021.
- © 2021 by the Society of Nuclear Medicine and Molecular Imaging.
REFERENCES
- Received for publication November 19, 2020.
- Revision received March 5, 2021.
In this issue


Jump to section
Related Articles
Cited By...
- No citing articles found.