


Abstract
We aimed to evaluate the relationships between circulating tumor cells (CTCs) or plasma cell–free DNA (cfDNA) on one side and a comprehensive range of 18F-FDG PET/CT–derived parameters on the other side in chemotherapy-naive patients with advanced non–small cell lung cancer (NSCLC). Methods: From a group of 79 patients included in a trial evaluating the role of pretreatment circulating tumor markers as predictors of prognosis in chemotherapy-naive patients with advanced NSCLC, we recruited all those who underwent 18F-FDG PET/CT for clinical reasons at our institution before inclusion in the trial (and thus just before chemotherapy). For each patient, a peripheral blood sample was collected at baseline for the evaluation of CTCs and cfDNA. CTCs were isolated by size using a filtration-based device and then morphologically identified and enumerated; cfDNA was isolated from plasma and quantified by a quantitative polymerase chain reaction using human telomerase reverse transcriptase. The following 18F-FDG PET/CT–derived parameters were computed: maximum diameter of the primary lesion (T), of the largest lymph node (N), and of the largest metastatic lesion (M); SUVmax; SUVmean; size-incorporated SUVmax; metabolic tumor volume; and total lesion glycolysis. All parameters were independently measured for T, N, and M. The associations among CTCs, cfDNA, and 18F-FDG PET/CT–derived parameters were evaluated by multivariate-analysis. Patients were divided into 2 groups according to the presence of either limited metastatic involvement (M1a or M1b due to extrathoracic lymph nodes only) or disseminated metastatic disease. The presence or absence of metabolically active bone lesions was also recorded for each patient, and patient subgroups were compared. Results: Thirty-seven patients recruited in the trial matched our PET-based criteria (24 men; age, 64.5 ± 8.1 y). SUVmax for the largest metastatic lesion was the only variable independently associated with baseline cfDNA levels (P = 0.016). Higher levels of cfDNA were detected in the subgroup of patients with metabolically active bone lesions (P = 0.02), but no difference was highlighted when patients with more limited metastatic disease were compared with patients with disseminated metastatic disease. Conclusion: The correlation of cfDNA levels with tumor metabolism, but not with metabolic tumor volume at regional or distant levels, suggests that cfDNA may better reflect tumor biologic behavior or aggressiveness rather than tumor burden in metastatic NSCLC.
Despite the identification of circulating tumor cells (CTCs) and plasma cell–free DNA (cfDNA) as biomarkers potentially able to provide clinically relevant information in cancer patients, at present, their identification in routine clinical practice is not envisioned (1). Indeed, an incomplete understanding of the specific roles of these biomarkers in different tumor types as well as unsolved technical issues still limit their systematic assessment in the clinical setting (1). Several studies have demonstrated a prognostic value of CTC enumeration or cfDNA levels in various malignancies, including non–small cell lung cancer (NSCLC) (2–5).
In particular, a significant role of baseline CTC or cfDNA determination before first-line therapy has been highlighted in some tumor types, and the presence of increased levels of circulating tumor markers in advanced malignancies has been demonstrated to correlate with a poor prognosis for patients (6). However, whether these observations merely reflect their role as tumor burden indicators or may reveal other biologic mechanisms associated with tumor aggressiveness is still a matter of debate (1).
In recent years, imaging procedures have emerged as meaningful prognostic indicators in oncology, and the interplay between circulating tumor markers and imaging biomarkers has been investigated (6). In this framework, 18F-FDG PET/CT may be an ideal tool for elucidating the relevance of circulating tumor markers in tumor burden and biology (6). Most available studies investigating the relationship between 18F-FDG PET and circulating tumor markers have been performed in colon and breast cancer patients (6–8); at present, data in NSCLC patients are limited (9,10). 18F-FDG PET/CT has a recognized high accuracy in NSCLC patients in both early and advanced stages of disease. Similarly, the intensity of 18F-FDG uptake and, thus, tumor metabolism has an established prognostic value in that it is linked to aggressive tumor biology (11) and metastatic potential in NSCLC patients (12). To date, only 1 prospective study has been performed (10) to assess the relationship between cfDNA and 18F-FDG PET in patients with advanced NSCLC before receiving chemotherapy. That study did not highlight any correlation between tumor DNA and 18F-FDG PET–assessed tumor burden. However, only the whole-body metabolic tumor volume (MTV) and total lesion glycolysis (TLG) were included in the analysis; other potentially prognostic variables derived from 18F-FDG PET images were not considered.
Moreover, because different biologic and prognostic behaviors can be hypothesized for primary lesions and lymph node and distant metastases, a detailed investigation of the interplay between circulating tumor markers and PET-derived parameters should take into account these different components, especially in patients in advanced stages. On the basis of these considerations, we aimed to evaluate, by a multivariate approach, the relationship between CTCs or cfDNA on one side and a comprehensive range of PET-derived parameters (for lesions at both locoregional and distant levels) on the other side in a homogeneous population of chemotherapy-naive patients with advanced NSCLC.
MATERIALS AND METHODS
Patient Enrollment
Seventy-nine patients who had newly diagnosed advanced NSCLC and were candidates for first-line chemotherapy were enrolled in a prospective study (13) at the Lung Cancer Unit, IRCCS AOU San Martino–National Cancer Research Institute, Genoa, Italy, from October 2012 to October 2015. The aim of the trial was to test the value of VeriStrat (Biodesix, Inc.; a pretreatment blood-based test of circulating tumor markers) as a predictor of prognosis after first-line platinum-based combination chemotherapy in advanced NSCLC (ClinicalTrials.gov Identifier: NCT02055144). The inclusion criteria were histologically confirmed NSCLC stage IV, no previous treatment, and age of at least 18 y. All patients underwent first-line standard-of-care treatment for metastatic NSCLC, consisting of platinum-based combination chemotherapy: cisplatin or carboplatin in association with pemetrexed for adenocarcinoma or with gemcitabine for the squamous histotype (14).
18F-FDG PET evaluation was not mandatory; however, a subgroup of patients underwent 18F-FDG PET/CT examinations for standard clinical indications (mainly for completion of staging or restaging) at the time of inclusion in the study and before receiving chemotherapy. A peripheral blood sample was collected from each patient at baseline (before treatment) for the evaluation of circulating biomarkers.
The study was approved by the Ethics Committee of IRCCS AOU San Martino–National Cancer Research Institute (ID: TrPo11.003), and all enrolled subjects provided written informed consent to participate in the analysis of circulating biomarkers. Of the patients enrolled in the study, only those who underwent 18F-FDG PET at our institution just before the start of chemotherapy were included in the specific analysis of correlations between circulating biomarkers and PET parameters.
CTC Isolation
CTCs were isolated from 3 mL of whole peripheral blood (ethylenediaminetetraacetic acid [EDTA]–containing tube) using a ScreenCell Cyto kit (ScreenCell) according to the manufacturer’s procedure. In brief, circulating cells were isolated by size using a polycarbonate filter containing calibrated pores (7.5 ± 0.36 μm) randomly distributed throughout the membrane. After filtration, the content of the filter was released on the slide and processed for enumeration and morphology identification. The isolated nonhematologic circulating cells with malignant features were defined as CTCs and morphologically identified and enumerated under a light microscope according to the following criteria: nuclear size greater than or equal to 20 μm, high nucleocytoplasmic ratio (≥0.75), dense hyperchromatic nucleus, and irregular nuclear membrane.
cfDNA Isolation and Quantification
Peripheral blood samples (4 mL) were collected in EDTA-containing tubes. Such tubes were processed by centrifugation at 1,600 rpm for 15 min to isolate plasma; a further centrifugation was performed to eliminate any cell contamination, and the resulting plasma was stored at −80°C. cfDNA was extracted using a QIAamp DNA Blood Mini Kit (Qiagen) according to the manufacturer’s protocol. The purified cfDNA from 400 μL of plasma was eluted in a final volume of 50 μL of buffer Tris–EDTA (0.1×) and stored at −20°C. The quantification of cfDNA was performed by a real-time quantitative polymerase chain reaction using a human telomerase reverse transcriptase (hTERT; ThermoFisher Scientific) single-copy gene. Each quantitative polymerase chain reaction was performed in a final reaction volume of 10 μL, consisting of 5 μL of TaqMan Universal Mastermix (ThermoFisher Scientific), 1 μL of assay, and 4 μL of cfDNA. Each cfDNA sample was run in duplicate, and the plate included positive and negative controls. The calibration curve was calculated on the basis of a dilution series of a DNA standard (Promega): 1, 10, 100, 1,000, 10,000, and 100,000 copy numbers (3.3 pg of DNA = 1 gene copy).
18F-FDG PET/CT Acquisition
For the 18F-FDG PET/CT portion of the study, patients underwent preparation and 18F-FDG PET/CT according to European guidelines (15), and data were acquired using a 16-slice PET/CT hybrid system (Biograph 16; Siemens Medical Solutions). In brief, patients fasted overnight before the intravenous administration of 350–450 MBq of 18F-FDG, which was performed in a quiet room with the patient lying in a recumbent position and instructed not to move. Blood glucose was measured before tracer injection to ensure blood glucose levels of less than 160 mg/dL. To minimize artifacts caused by the urinary tract, we asked patients to drink 500–1,000 mL of water 1 h before image acquisition and to empty the bladder just before the start of acquisition. No urinary bladder catheterization was used.
Imaging was started 60 ± 15 min after intravenous tracer administration (patients with longer 18F-FDG uptake times were excluded). The technical parameters of the 16-detector-row, helical CT scanner included a gantry rotation speed of 0.5 s and a table speed of 24 mm per gantry rotation. The PET component of the combined imaging system had an axial view of 16.2 cm per bed position and an interslice spacing of 3.75 mm. The transaxial field of view and pixel size of the reconstructed PET images were 58.5 cm and 4.57 mm, respectively, and the matrix size was 128 × 128. Unenhanced low-dose CT was performed at 140 kV and 40 mA for attenuation correction of emission data and anatomic localization of the PET dataset. Shortly after CT acquisition, an emission scan was performed in the 3-dimensional mode, with a 3-min acquisition per bed position. PET sinograms were reconstructed by means of an ordered-subset expectation maximization iterative reconstruction algorithm (3 iterations; 8 subsets). Scans were performed from the orbital plane to the midthigh, except when the clinical history called for a whole-body, vertex-to-toes scan.
Image Analysis
For all 18F-FDG PET/CT scans, the following 8 parameters were measured: maximum diameter of the primary lesion (T); maximum diameter of the largest lymph node (N); maximum diameter of the largest metastatic lesion (M); SUVmax; SUVmean; size-incorporated SUVmax (SIMaxSUV); MTV; and TLG. SUVmax, SUVmean, SIMaxSUV, MTV, and average glycolytic volume were independently measured for T, N, and M. In particular, SIMaxSUV was defined as the product of the largest diameter (mm) of the primary lesion (for T) or of the largest lesion (for N and M) and the SUVmax of the same lesion (16,17); MTV was assessed using a syngo (Siemens) workstation and was computed using an SUVmax of greater than or equal to 2.5 as a threshold (10); and TLG for T, N, and M was computed as MTV × SUVmean.
Finally, the patients were divided into 2 groups according to the presence of either limited metastatic involvement (patients with M1a or classified as M1b due to extrathoracic lymph nodes only [M1bLympho]) or disseminated metastatic disease (all other patients with M1b [M1bDisseminated]) on the 18F-FDG PET/CT scans. Similarly, the presence or absence of metabolically active bone lesions was recorded for each patient.
Statistical Analysis
The associations among CTCs, cfDNA, and 18F-FDG PET/CT–derived parameters were evaluated by multivariate analysis (SPSS version 17; IBM). t tests were performed to evaluate differences in CTCs or cfDNA in patients with M1a plus M1bLympho versus patients with M1bDisseminated as well as in the subgroups with or without metabolically active bone lesions. The Mann–Whitney unpaired test was used to compare independent variables. A P value of less than 0.05 was regarded as significant.
RESULTS
Patients
Of 79 patients recruited in the VeriStrat trial, 37 matched our PET-based criteria. The median age was 64.5 ± 8.1 y (range, 51–80), and the ratio of men to women was 24:13. Nineteen patients were current smokers, whereas 16 were former smokers and 2 had never smoked. Histologic subtypes were adenocarcinoma (n = 28) and squamous cell carcinoma (n = 9). All but 1 patient had metabolically active metastatic lesions. In particular, lesions in 12 patients were classified as M1a, lesions in 23 patients were classified as M1bDisseminated, and lesions in 1 patient were classified as M1bLympho. In addition, 13 of 37 patients had metabolically active bone lesions. Table 1 shows the characteristics of the patients.
Patient Demographic and Clinical Characteristics
Circulating Tumor Markers
Whole-blood samples for cfDNA and CTC evaluations were collected from patients with advanced NSCLC at baseline before platinum-based combination chemotherapy. The median baseline count of 6 CTCs/3 mL of blood (range, 0–47 CTCs/3 mL) and the median cfDNA level of 101 hTERT copy numbers (range, 16–1,604) were identified as the most appropriate cutoffs for comparative studies with 18F-FDG PET/CT–derived parameters. The CTC count was not significantly associated with any PET-derived parameter, as determined by the Mann–Whitney test. The only statistically significant association was observed for cfDNA and SUVmax for the largest metastatic lesion (P = 0.003). Indeed, patients with cfDNA hTERT copy numbers above the median level exhibited a higher median SUVmax for the largest metastatic lesion than those with cfDNA hTERT copy numbers below the median level (Table 2).
Multivariate Analysis
PET/CT-Derived Predictors of Circulating Tumor Markers
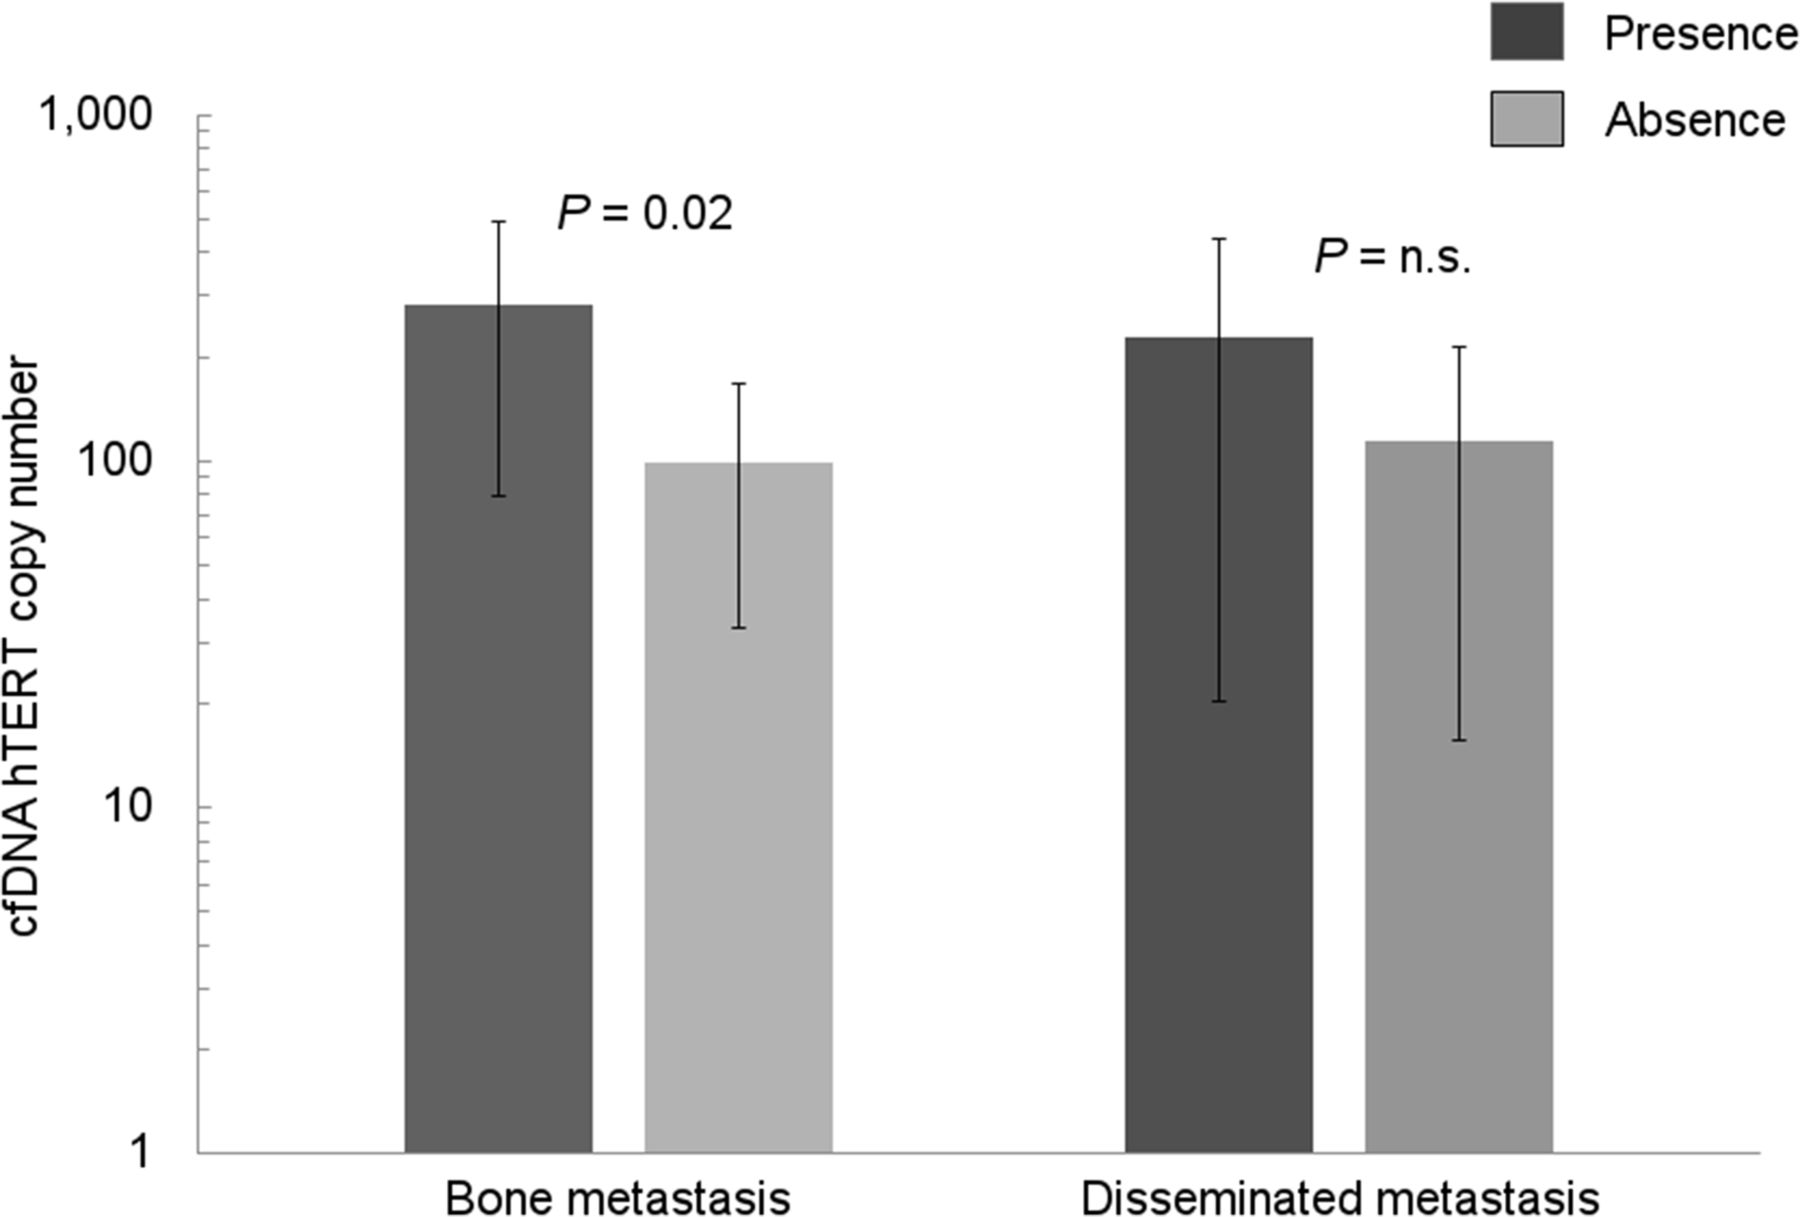
According to the multivariate analysis, SUVmax for the largest metastatic lesion was the only variable independently associated with baseline cfDNA levels (P = 0.016). No further correlations between cfDNA levels or CTC numbers and any of the other PET-derived parameters were highlighted. Table 2 summarizes the results of the multivariate analysis. Notably, higher levels of cfDNA were detected in the subgroup of patients with metabolically active bone lesions (P = 0.02), whereas no difference was highlighted when patients with more limited metastatic disease (M1a + M1bLympho) were compared with patients with disseminated lesions (M1bDisseminated) (regardless of the anatomic topography of the lesions) (Fig. 1). No significant difference in CTC numbers was observed when patients with more limited metastatic disease were compared with patients with disseminated lesions (M1bDisseminated); similarly, no significant difference in CTC numbers was observed in patients with metastatic bone involvement and those without metastatic bone involvement. Figure 2 shows PET/CT images of 2 analyzed patients and corresponding CTC and cfDNA levels.

Histograms showing free circulating tumor DNA (cfDNA) levels in subgroups of patients according to presence or absence of disseminated metastasis or metabolically active bone lesions. Higher cfDNA levels were detected in subgroup of patients with metabolically active bone lesions, whereas no difference was highlighted when patients with more limited metastatic disease (M1a + M1bLympho) were compared with patients with disseminated M1b disease (regardless of anatomic topography of lesions). n.s. = not significant.

Representative examples for 2 patients enrolled in present study. (A and B) Two coronal and transaxial sections of 18F-FDG PET/CT scan of 73-y-old woman with stage IV NSCLC (adenocarcinoma; free circulating tumor DNA [cfDNA] level, 462 hTERT copy numbers; 3 CTCs/3 mL). (A) Primary lesion that highly concentrated 18F-FDG in left lung (maximum diameter [dmax], 49 mm; SUVmax, 7.2; MTV, 82.4 mL). (B) Small bone lesion in left scapula (dmax, 10 mm; SUVmax, 5.7; MTV, 5 mL). (C and D) 18F-FDG PET/CT scan of 70-y-old man with stage IV NSCLC (adenocarcinoma; cfDNA level, 113 hTERT copy numbers; 3 CTCs/3 mL). (C) Primary lesion that moderately concentrated 18F-FDG in right lung (dmax, 83 mm; SUVmax, 4.9; MTV, 193.2 mL). (D) Multiple mediastinal and cervical lymph nodes (dmax of largest lymph node, 30 mm; SUVmax, 3.2; MTV, 65 mL). Patient shown in A and B had lower tumor burden (as expressed by MTV) but higher SUVmax and cfDNA levels than patient shown in C and D.
DISCUSSION
In the present study, we evaluated the correlations between CTC numbers or cfDNA levels and PET-derived parameters at both locoregional and distant levels in a homogeneous population of chemotherapy-naive patients with advanced NSCLC. Our results revealed a positive correlation between a high baseline level of cfDNA and tumor metabolic activity. Because neither MTV nor SIMaxSUV (which include a volumetric assessment) showed any relationship with the plasma cfDNA concentration and only SUVmax was significantly associated with this circulating biomarker, it is conceivable that cfDNA may better reflect tumor metabolism and biologic behavior than tumor burden in metastatic NSCLC.
Nygaard et al. estimated the tumor burden in terms of MTV and TLG in a similar setting (10). Although a higher MTV and higher cfDNA levels were associated with a significantly shorter overall survival, no correlation between cfDNA and PET-derived parameters was found. These controversial results may be explained by the fact that only 2 PET-derived parameters (MTV and TLG) were considered. Indeed, different cutoffs for MTV computation have been proposed, but none has been validated in this setting, and overall consensus about the best PET-based indicator is presently lacking.
In previous studies, the relationships of circulating tumor markers and 18F-FDG PET/CT in various cancers were assessed (4,18). In this framework, most studies were performed for other malignancies, especially metastatic breast and colon cancers (18). In a recent study of NSCLC patients, the change in CTC counts and its relationship with 18F-FDG PET in patients treated with chemotherapy for relapsed disease were evaluated (4). However, the authors were unable to find an SUVmax cutoff for predicting the response of CTCs to treatment, and the SUVmax demonstrated a trend in predicting a change in CTCs only after the allocation of patients as responders and nonresponders. Similarly, a retrospective evaluation of NSCLC patients who underwent 18F-FDG PET/CT imaging and CTC detection before therapy was performed by Nair et al. (9). That study demonstrated a weak correlation with the SUVmax and no correlation with tumor diameter. However, both studies were multicenter studies, and the results of the analyses may have been influenced by the effect of different PET scanners. Notably, only in the study of Nair et al. was 18F-FDG PET interscanner calibration performed (9).
Our experience was similar, but our study population was different and more homogeneous. Indeed, although we considered only chemotherapy-naive advanced NSCLC patients, in the study by Nair et al., most—but not all—patients had early-stage disease. In summary, questionable and mostly negative results on this topic emerged from the few available studies in NSCLC—likely suggesting some technical limits, such as different (and often heterogeneous) populations of patients, the use of diverse PET scanners, and the lack of gold standard indicators of tumor burden or aggressiveness by means of PET.
In the present study, an independent correlation between SUVmax and cfDNA was disclosed by means of multivariate analysis, which included a wide range of PET/CT-derived parameters determining patients’ tumor burden and biology (T, N, and M). Specifically, the SUVmax of the metastatic lesions was the only independent predictor of cfDNA levels. The presence of a significant correlation between cfDNA and tumor metabolism of the metastatic lymph nodes rather than the primary tumor is in keeping with the hypothesis that circulating tumor markers may be strongly related to the metastatic potential of different tumor types (19). In particular, when we took into account the subset of patients with bone metastases, the relevance of cfDNA in defining the biologic behavior of the tumor was further highlighted. Higher levels of cfDNA were observed in the subgroup of patients with metabolically active bone lesions, whereas no difference was found for the other disseminated metastatic lesions, regardless of their anatomic topography. Because it has been shown that high 18F-FDG uptake may be related to tumor metastatic potential (12,20), identification of the associations between cfDNA and active bone lesions may represent a step forward in understanding the mechanisms underlying metastasis and tropism in NSCLC.
Notably, although cfDNA was correlated with tumor metabolism, no association was found between CTCs and PET-derived parameters in the patients in the present study.
Previous investigations suggested that cfDNA and CTCs may provide complementary information about tumor biology. In particular, CTCs are derived as intact cells shed from the primary or metastatic tumor sites, whereas cfDNA is released from different sources—including apoptosis, necrosis, phagocytosis, and lysis of tumor cells (1). These different biologic features and the limited number of patients may have been partly responsible for the discordant results, thus precluding definitive conclusions about the role of CTCs in NSCLC metabolism.
The present study has some drawbacks; more specifically, it was a single-center study including a limited number of patients recruited within a clinical trial in which 18F-FDG PET/CT was not mandatory. As a consequence, only patients referred for 18F-FDG PET/CT for specific clinical reasons before inclusion in the study were considered, and some of the patients’ characteristics may have affected the analysis. Therefore, the results of the present study should be confirmed by a trial with a fully prospective design that includes 18F-FDG PET/CT examination.
CONCLUSION
Although additional studies are required to propose a more accurate model regarding the interplay among tumor metabolism, circulating tumor markers, and tumor aggressiveness, the preliminary data from the present study support the role of cfDNA as an indicator of tumor biology or aggressiveness rather than tumor burden in advanced NSCLC patients before chemotherapy initiation. The identification and a deeper understanding of clinically reliable noninvasive biomarkers may help identify potential nonresponding NSCLC patients before treatment to allow personalized therapies and limit toxicity.
DISCLOSURE
Simona Coco is a PhD candidate supported by the Italian Ministry of Health (GR 2011–12; 02350922). Silvia Morbelli acted as a consultant for Eli Lilly in 2014 and for Avid Radiopharmaceuticals in 2016. No other potential conflict of interest relevant to this article was reported.
Footnotes
Published online Apr. 27, 2017.
- © 2017 by the Society of Nuclear Medicine and Molecular Imaging.
REFERENCES
- Received for publication March 16, 2017.
- Accepted for publication April 11, 2017.


Jump to section
Related Articles
Cited By...
- Combination of Circulating Tumour DNA and 18F-FDG PET/CT for Precision Monitoring of Therapy Response in Patients With Advanced Non-small Cell Lung Cancer: A Prospective Study
- Combining 18F-FDG PET/CT-Based Metabolically Active Tumor Volume and Circulating Cell-Free DNA Significantly Improves Outcome Prediction in Chemorefractory Metastatic Colorectal Cancer
- Circulating tumor DNA detectable in early- and late-stage colorectal cancer patients