


Abstract
Baseline whole-body metabolically active tumor volume (WB-MATV) measured by 18F-FDG PET/CT and circulating cell-free DNA (cfDNA) have been separately validated as predictors of overall and progression-free survival (OS/PFS) in chemorefractory metastatic colorectal cancer (mCRC) patients. This study assessed the correlation between WB-MATV and cfDNA, evaluating the added prognostic value of these in combination, along with clinical parameters. Methods: Of 141 mCRC patients included in a prospective multicenter trial, 132 were evaluable for OS/PFS. cfDNA was extracted from 3 mL of plasma and quantified using a fluorometer. All target lesions were delineated on 18F-FDG PET/CT, and their metabolic volumes were summed to obtain the WB-MATV. Results: Baseline WB-MATV and cfDNA were strongly correlated (r = 0.70; P < 0.001) but showed discordance in 23 of 132 (17%) patients. A multivariate analysis identified 3 independent negative predictors of PFS (high cfDNA, short time since diagnosis, and body mass index < 30) and 5 of OS (high cfDNA, high WB-MATV, body mass index < 30, poor performance status, and short time since diagnosis). Combining WB-MATV and cfDNA increased the overall prognostic value and allowed identification of a subgroup of patients with low cfDNA and high WB-MATV who were associated with intermediate survival (median OS of 8.1 for low-cfDNA/high-MATV patients vs. 12.7 mo for low-cfDNA/low-MATV patients; hazard ratio, 2.04; P = 0.02). Conclusion: This study confirms the added prognostic value of combined circulating cfDNA and PET-based WB-MATV in chemorefractory mCRC patients. The combination of these two biomarkers should provide a firm basis for risk stratification, both in clinical practice and in research trials.
- 18F-FDG PET/CT
- circulating cell-free DNA
- metastatic colorectal cancer
- metabolically active tumor volume
- multikinase inhibitors
Metastatic colorectal cancer (mCRC) still holds a poor prognosis, with low 5-y survival rates despite important improvements in its management (1). Wide variations in survival among patients are nevertheless noted. In that context, prognostic biomarkers may help to identify patients at high risk of early death. Several clinical parameters have been identified as prognostic biomarkers, such as the Eastern Cooperative Oncology Group performance status, age, body mass index, and number of metastatic sites (2–5). However, most of these are related to the patient’s general medical condition and are not specific to the tumor.
Total circulating cell-free DNA (cfDNA), which corresponds to the DNA released into the blood circulation from tumoral and non-tumoral cells, has recently been reported as a surrogate marker of tumor burden in many solid tumors, and notably in mCRC (6–12). Measurement of the total amount of baseline cfDNA before treatment has recently been demonstrated as a strong prognostic biomarker in mCRC patients, with high levels of cfDNA strongly correlating with poor clinical outcome (12,13).
Whole-body 18F-FDG PET/CT allows the assessment of both tumor burden and its glycolytic activity (14,15). Baseline whole-body metabolically active tumor volume (WB-MATV), representing the patient’s active tumor load before treatment, was recently validated by our group as a strong prognostic imaging biomarker in a large cohort of chemorefractory mCRC patients (16). Interestingly, another PET parameter evaluating the glycolytic activity of the disease, SUVmax, was recently reported to be correlated with cfDNA in advanced non–small cell lung cancer patients (17).
Some early observations in animal models, and more recently in humans with non-colorectal cancers, suggest a strong correlation between MATV and cfDNA levels, and support their further investigation in a large cohort of mCRC patients (8,18–20). However, to our knowledge, no study has reported on the combination of these blood and PET biomarkers in mCRC patients at a baseline time point.
The aim of this study was, first, to define the correlation between whole-body 18F-FDG PET–based quantitative parameters and cfDNA and, second, to evaluate whether PET metrics yield additional prognostic value when combined with cfDNA and clinical parameters in chemorefractory mCRC patients treated with regorafenib, a multikinase inhibitor.
MATERIALS AND METHODS
Study Population
This study was performed within the framework of a prospective non-randomized multicenter phase II trial (RegARd-C; EudraCT number 2012-005655-16) (21) with the aim of identifying at an early time point those chemorefractory mCRC patients who are unlikely to benefit from regorafenib (Stivarga, BAY 73-4506; Bayer Pharma AG). This trial used 18F-FDG PET/CT and cfDNA for early response assessment.
The translational research part of this trial included plasma samples for liquid biopsies, notably cfDNA measurements performed at baseline and during treatment.
The patients were recruited from 15 Belgian clinical centers. The patient selection criteria and study design are detailed in the RegARd-C study protocol (21). The main enrollment criteria for this study were as follows: histologically proven adenocarcinoma of the colon or rectum; tumor refractory to all standard chemotherapy agents (fluoropyrimidines, irinotecan, and oxaliplatin) and anti-EGFR monoclonal antibodies in the case of RAS wild-type (cetuximab or panitumumab); age greater than 18 y; Eastern Cooperative Oncology Group performance status of 1 or less; life expectancy greater than 12 wk; a baseline 18F-FDG PET/CT examination with at least 1 measurable target lesion and a plasma sample both acquired within the 7 d before inclusion in the trial; a minimum washout period of 4 wk before inclusion in the trial; ability to undergo the therapy; and provision of signed informed consent (21).
Ethics approval was obtained for this trial from a central ethics committee and the relevant local ethical committees of each center. All procedures performed in this study involving human participants were in accordance with the ethical standards of the institutional or national research committee and the 1964 Helsinki declaration and its later amendments or comparable ethical standards.
18F-FDG PET/CT Imaging
Eight Belgian EARL accredited PET/CT centers were involved in this trial, with each following strict procedural guidelines for standardization of patient preparation, scan acquisition, and image processing to ensure the most accurate and reproducible quantitative PET measurements (22–24). Quality assessment for patient preparation and imaging protocols was ensured by an independent dedicated academic PET/CT imaging core lab.
This quality control analysis was performed for all 18F-FDG PET/CT scans, rejecting all those examinations with an interval between 18F-FDG injection and scanning outside the range of 55–75 min, any patient who had not fasted for at least 6 h before 18F-FDG injection, and any patient with glycemia higher than 150 mg/dL at the time of 18F-FDG injection. Target lesions were defined as follows: unequivocal tumor origin, transversal diameter greater than 15 mm on a registered CT image, and meeting the minimum threshold of 18F-FDG uptake for evaluability according to PERCIST (25).
All nuclear medicine physicians involved in this study were masked to the medical records and treatment outcomes. All PET measurements were computed on a dedicated workstation (Advantage Workstation; GE Healthcare) using the commercial PETVCAR software, version 4.6 (GE Healthcare).
The image analysis procedure for measurement of the different PET metrics used in this study was as follows: the MATV of a lesion was defined as the volume of tumor tissue demonstrating metabolic activity at or above the calculated threshold. WB-MATV was calculated as the sum of the MATV values of all target lesions, without a predefined limitation on their number. SUVmax and SUVmean were measured within the range of all target lesions. SUVmean was determined using the whole-body total lesion glycolysis (WB-TLG) formula as follows: WB-SUVmean = WB-TLG/WB-MATV. SUVpeak was measured at the focus of the hottest target lesion as defined in the PERCIST methodology (25).
DNA Extraction and Quantification Procedures
Ethylenediamine tetraacetic acid–containing tubes were used to collect peripheral blood samples (2 × 9 mL) from each patient at baseline. Blood samples were centrifuged within an hour from being taken (2,000 g for 15 min at 4°C), and plasma was isolated from the cellular fraction. Plasma samples were frozen at −80°C until DNA extraction. Before the DNA extraction procedure, plasma samples were secondarily centrifuged (10,000g for 10 min) to limit genomic DNA contamination from any residual cellular fraction. The cfDNA was purified from 3 mL of plasma using the QIAamp Circulating Nucleic Acid Kit (Qiagen) according to the manufacturer’s instructions. The cfDNA amount was quantified using a Qubit 3.0 fluorometer (Invitrogen, Life-Technologies) and the Qubit dsDNA HS assay kit (Invitrogen, Life-Technologies) and was expressed in ng/mL of plasma. To measure the intrapatient quantification variability, multiple (3–6) plasma cfDNA extractions and quantifications were performed for 4 patients, with these showing no significant differences.
Statistical Analysis
The baseline clinical characteristics and survival data were collected prospectively and measured from the date of inclusion in the trial. The patients alive at last follow-up were censored. Contal and O’Quigley’s method (26) was used to determine the optimal cfDNA cutoff for survival prediction. The optimal cutoff for WB-MATV was determined to be 100 cm3, as previously reported (16). The SUVmax, SUVmean, and SUVpeak PET parameters were considered as continuous variables for survival prediction. As WB-TLG was previously demonstrated to show no clinically relevant difference from WB-MATV in terms of outcome prediction (16), this PET parameter was not reported in this study.
The prognostic values of the PET parameters were assessed using standard survival analysis methods, such as Kaplan–Meier estimation for survival probabilities (overall survival [OS] and progression-free survival [PFS]), the log-rank test for comparisons of groups, and the Cox proportional hazards regression model for regression analysis to estimate the hazard ratio (HR) with 95% confidence intervals (CIs). In the multivariate Cox model, the following variables were considered for association with OS and PFS: cfDNA, WB-MATV, SUVmax, SUVmean, SUVpeak, age, sex, body mass index, Eastern Cooperative Oncology Group performance status, number of years between diagnosis and inclusion in the trial, KRAS mutation status, prior use of bevacizumab, and number of metabolically active metastatic sites. The prognostic weight for each parameter was obtained from the Cox model by dividing its estimate by the estimate in absolute value of the parameter with the smallest value. P values of less than 0.05 were considered statistically significant, and all tests were two-sided. Correlations between cfDNA and PET parameters were calculated using Spearman rank correlation. Statistical analyses were performed using SAS, version 9.4 (SAS Institute).
RESULTS
From 141 chemorefractory mCRC patients recruited in the RegARd-C trial, 132 were considered suitable for both cfDNA and PET analysis. The reasons for ineligibility were as follows: 3 patients did not meet the inclusion criteria, 2 had no target lesions on baseline 18F-FDG PET/CT, 2 did not have a plasma sample collected at baseline, and 1 had neither 18F-FDG PET/CT nor a plasma sample collected at baseline. Among the remaining patients, all had a PFS event, except for a single patient who was not included in the survival analyses because the clinical follow-up was too short (4 d). A reported date of death was available for 128 of the 132 patients (Supplemental Fig. 1; supplemental materials are available at http://jnm.snmjournals.org). The patient and disease characteristics of the 132 evaluable patients are summarized in Table 1.
Patient and Disease Characteristics of Evaluable Patients (n = 132)
cfDNA and Patient Outcomes
The baseline cfDNA median value was 53.5 ng/mL (5th–95th percentiles, 13.5–497 ng/mL). The optimal cfDNA cutoff associated with OS/PFS was 50 ng/mL.
Univariate analyses showed that patients with a cfDNA level of at least 50 ng/mL (high cfDNA) had significantly worse outcomes, with a 3.5-mo (95% CI, 2.8–4.4 mo) median OS and 1.8-mo (95% CI, 1.7–2.0 mo) median PFS, compared with an 11.5-mo (95% CI, 8.7–13.7 mo) median OS and a 3.9-mo (95% CI, 2.7–5.3 mo) median PFS in patients with a cfDNA level of less than 50 ng/mL (low cfDNA) (HR cfDNA ≥ 50 vs. < 50 ng/mL, 3.83; 95% CI, 2.57–5.71; P < 0.001 for OS; and HR, 2.5; 95% CI, 1.73–3.63; P < 0.001 for PFS; Table 2; Fig. 1).
Univariate Analyses of Baseline cfDNA and WB-MATV on Clinical Outcomes (PFS and OS)

Baseline cfDNA parameter categorized into low- and high-value groups and its corresponding OS (A) and PFS (B).
PET Parameters and Patient Outcomes
The median values for baseline WB-MATV, SUVmax, SUVmean, and SUVpeak were 153 cm3 (5th–95th percentiles, 6–1,481 cm3), 9.1 g/mL (5th–95th percentiles, 4.9–17.1 g/mL), 4.5 g/mL (5th–95th percentiles, 3.0–6.1 g/mL), and 7.6 g/mL (5th–95th percentiles, 3.9–14.3 g/mL), respectively.
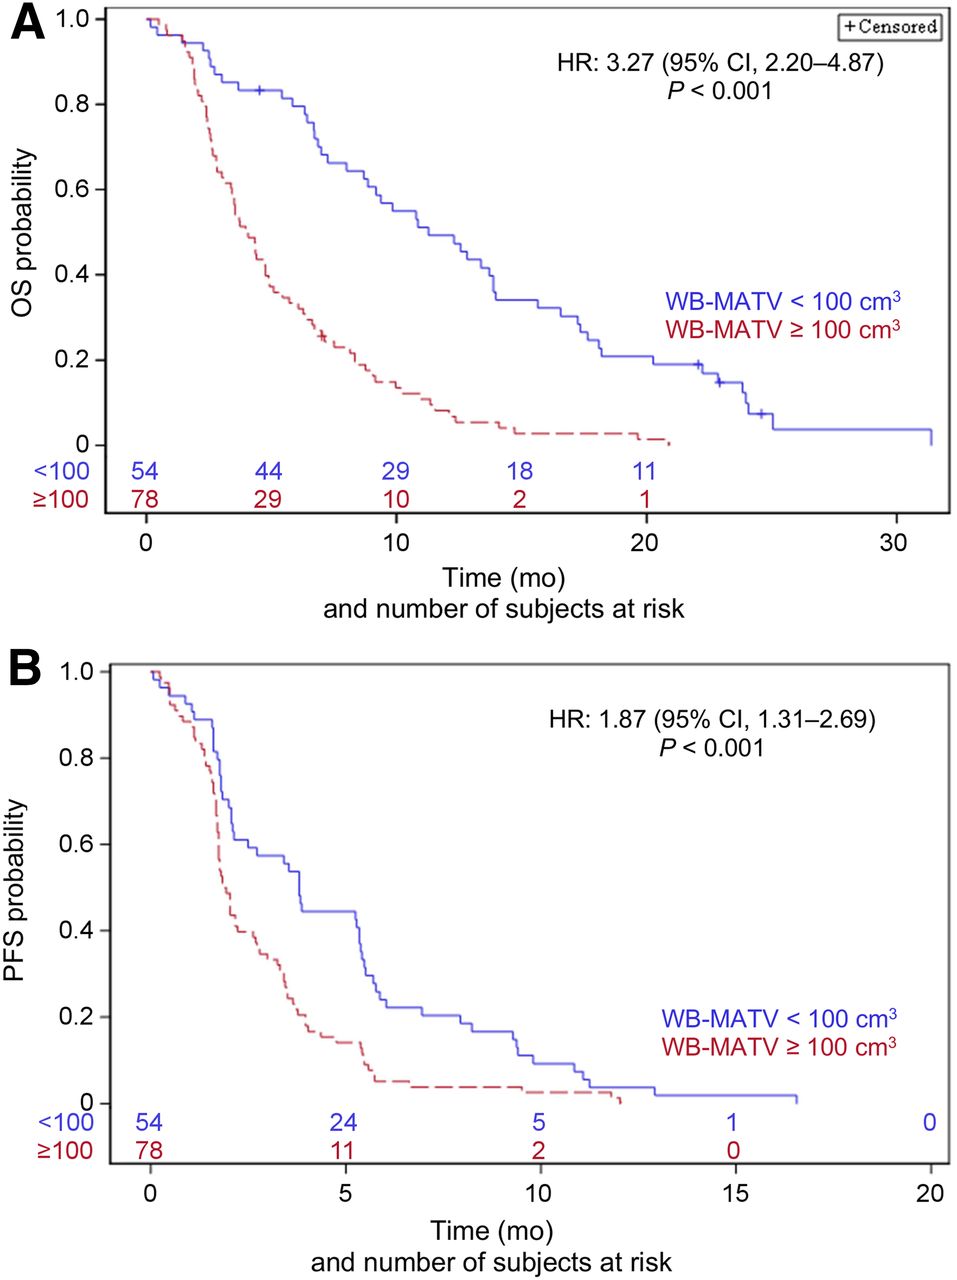
Patients with a WB-MATV of at least 100 cm3 (high WB-MATV) had significantly worse outcomes, with a 4.0-mo (95% CI, 3.1–4.9 mo) median OS and 1.9-mo (95% CI, 1.7–2.6 mo) median PFS compared with an 11.3-mo (95% CI, 8.7–13.9 mo) median OS and a 3.8-mo (95% CI, 2.1–5.3 mo) median PFS in patients with a WB-MATV of less than 100 cm3 (low WB-MATV) (HR WB-MATV ≥ 100 vs. < 100 cm3, 3.27; 95% CI, 2.20–4.87; P < 0.001 for OS; and HR, 1.87; 95% CI, 1.31–2.69; P < 0.001 for PFS; Table 2; Fig. 2).

Baseline WB-MATV parameter categorized into low- and high-value groups and its corresponding OS (A) and PFS (B).
The SUVmax and SUVpeak parameters were found to be predictors of OS, with an HR per 1-unit increase in SUVmax or SUVpeak of 1.05 (95% CI, 1.01–1.10 and 1.00–1.11; P = 0.03 and P = 0.05, for SUVmax and SUVpeak, respectively). SUVmean was not found to be predictive of OS (HR, 0.97 per 1-unit increase; 95% CI, 0.82–1.14; P = 0.69), and therefore this parameter was not included in the multivariate analysis.
None of the SUVmax, SUVpeak, or SUVmean parameters were found to be predictors of PFS (HR, 1.02 per 1-unit increase; 95% CI, 0.97–1.06; P = 0.49 for SUVmax; HR, 1.02 per 1-unit increase; 95% CI, 0.97–1.07; P = 0.52 for SUVpeak; and HR, 0.89 per 1-unit increase; 95% CI, 0.76–1.05; P = 0.17 for SUVmean).
Correlations Between PET and cfDNA Parameters
Baseline cfDNA showed a strong positive correlation with WB-MATV (Spearman rank correlation, 0.70; 95% CI, 0.60–0.78; P < 0.001; Supplemental Fig. 2), a weak correlation with SUVmax and SUVpeak (Spearman rank correlation, 0.29; 95% CI, 0.13–0.44; P < 0.001 for both parameters), and no correlation with SUVmean (Spearman rank correlation, –0.01; 95% CI, –0.18 to 0.16; P = 0.92).
Discordances Between cfDNA and WB-MATV Parameters
The discordance rate between baseline cfDNA and WB-MATV after application of their respective cutoffs for categorization into low or high tumor load was calculated as 17% (23/132), with 15 patients classified as high–WB-MATV/low-cfDNA categories, and 8 patients classified as low–WB-MATV/high-cfDNA categories (Table 3). Examples of the patients with a low cfDNA and a high WB-MATV are shown in Supplemental Fig. 3.
Correspondence Between WB-MATV and cfDNA Measurements Categorized into Low or High Values for 132 Evaluable Patients
Independent Predictors of OS and PFS Among PET, cfDNA, and Clinical Parameters
The multivariate analysis identified baseline cfDNA and WB-MATV as significant independent predictors of OS (HR, 2.46 and 1.87; P = 0.0003 and P = 0.016, respectively), together with the following clinical parameters: number of years since diagnosis (HR, 0.91 per 1-y increase; P = 0.0096), Eastern Cooperative Oncology Group performance status 1 (HR, 1.58; P = 0.0135), and body mass index of at least 30 (HR, 0.45; P = 0.0021). The prognostic weights of these parameters were 9, 6, −1, 5, and −8, respectively (Table 4).
Multivariate Analysis of Baseline cfDNA, WB-MATV, and Clinical Parameters on PFS and OS
Baseline cfDNA was also a significant independent predictor of PFS (HR, 2.51; P < 0.0001), together with the number of years since diagnosis (HR, 0.85 per 1-y increase; P < 0.0001), and body mass index of at least 30 (HR, 0.59; P = 0.0305). The prognostic weights of these parameters were 6, −1, and −3, respectively (Table 4).
Combining cfDNA and WB-MATV Parameters
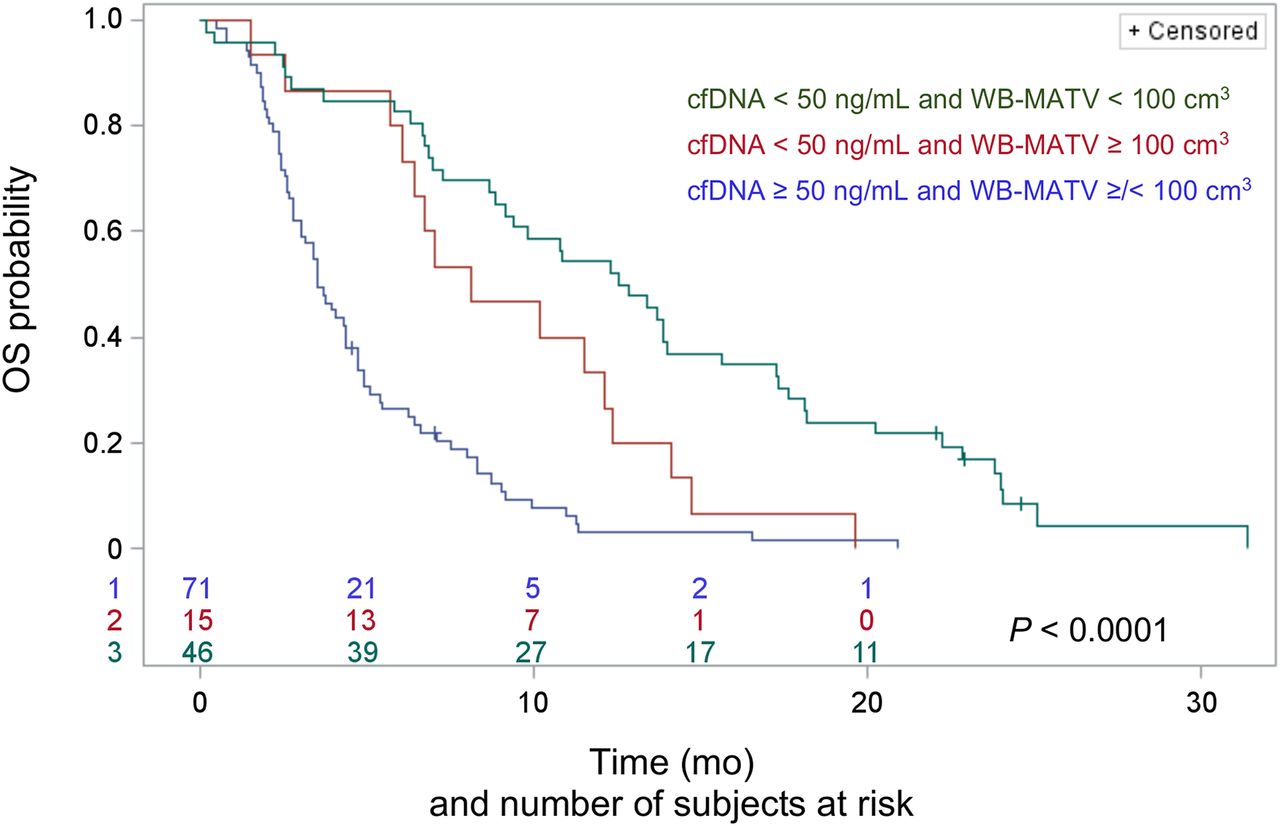
Combining cfDNA with WB-MATV stratified the patients into three risk groups: low-cfDNA patients with a low WB-MATV (low-risk group; n = 46, median OS of 12.7 mo); low-cfDNA patients with a high WB-MATV (intermediate-risk group; n = 15, 8.1 mo; HR, 2.04 with P = 0.02 for the intermediate- vs. low-risk group); and high-cfDNA patients with either low or high WB-MATV (high-risk group; n = 71, 3.5 mo; HR, 2.35 with P = 0.003 for the high- vs. intermediate-risk group and HR, 4.27 with P < 0.0001 for the high- vs. low-risk group; Fig. 3).

Combined baseline cfDNA and WB-MATV parameters resulting in categorization into 3 distinct groups of patients with significantly different median OS.
DISCUSSION
Among advanced mCRC patients, survival greatly varies, and their optimal care requires accurate biomarkers to predict as best as possible an individual patient’s outcome. In this study, it was hypothesized that tumor-related biomarkers would predict patients’ individual prognosis better than general clinical parameters can. Among the candidate biomarkers, cfDNA and WB-MATV have been investigated independently in previous reports (13,16), but to our knowledge, a prospective study of their prognostic value in combination has never been performed before.
The respective prognostic values of cfDNA and WB-MATV were found to be in line with those of other reports in which high levels of cfDNA or WB-MATV at baseline were strongly associated with a poor prognosis (12,16). The increased overall prognostic accuracy of combining baseline cfDNA and WB-MATV, even after the inclusion of all relevant standard clinical parameters, was confirmed. The combination of the two biomarkers also allowed the identification of a subgroup of patients with low cfDNA and high WB-MATV who presented an intermediate survival.
Baseline cfDNA and WB-MATV biomarkers were shown to be significantly correlated; however, a discordance rate of 17% (23/132 patients) was found after high/low dichotomization: 15 patients had a low cfDNA level and a high WB-MATV, and 8 patients had a high cfDNA level and a low WB-MATV.
No satisfying technical or clinical condition could be found to explain the discordantly low cfDNA findings in some patients. The most probable hypothesis is that some tumor sites release relatively less cfDNA than others. However, as seen on 18F-FDG PET/CT, we could not find any impact of the tumor site distribution on the level of cfDNA. Another reason that could explain the discordantly low cfDNA values is the potential issues that can occur with plasma isolation or DNA extraction procedures.
With regard to the discordantly high cfDNA findings, some technical and biologic causes can be forwarded. First, the cfDNA sampling procedure can cause measurement variability. Even if it is standardized, as in the present study, the sampling of cfDNA is a delicate procedure. Cell lysis and contamination with DNA from normal blood cells can result in a falsely high cfDNA value, but this can be avoided by respecting a maximum 2-h time interval between sampling and blood processing (27–29). Second, a potential misclassification into a high cfDNA category can occur because of an excess of non-tumoral cfDNA release from concurrent infection/inflammation. In this study, this was responsible for some high-cfDNA/low–WB-MATV discrepancy cases (n = 3/8), underlining the currently non-decipherable mixed provenance of cfDNA from tumoral and non-tumoral origin, which contrasts with the more tumor-specific PET parameters (30). Third, 18F-FDG PET/CT can significantly underestimate the extent and activity of non-target lesions (e.g., peritoneal carcinomatosis or low-grade disease) not included in the WB-MATV measurement.
The added prognostic value of combined cfDNA and WB-MATV biomarkers seems to occur mainly in the case of low-cfDNA findings. Indeed, combining WB-MATV and cfDNA parameters resulted in the stratification of patients into three risk groups with significantly different median OS. Among the patients with low cfDNA values, WB-MATV identified a subpopulation with high WB-MATV, thereby bringing an intermediate OS group to light. In the patient subset with high baseline cfDNA, the addition of WB-MATV did not yield any additional prognostic information. These data suggest that the sensitivity of cfDNA measurement is imperfect, rather than the specificity, and this therefore creates an opportunity for PET to increase prognostic accuracy.
Apart from some exceptions, 18F-FDG PET/CT imaging seems to provide a strong biologic imaging correlate of cfDNA. The combination of both biomarkers not only provides imaging of the biodistribution of the cfDNA-producing tumor sites but also should have a positive impact on the confidence of the oncologist’s decision making.
WB-MATV seems to be the PET metric best correlating with cfDNA in mCRC. This study found weaker correlations with the more classic SUV metrics, including the SUVmax and SUVpeak of the lesion with the highest uptake within the patient. Interestingly, two other studies in non–small cell lung cancer tested some of the parameters used in our study and did not find any correlation between cfDNA and WB-MATV (17,31). Morbelli et al. found that, among different SUV metrics including WB-MATV, only SUVmax was associated with cfDNA levels at baseline, thereby proclaiming that the maximal metabolic intensity, rather than the extent of the disease burden, was the primary correlate of cfDNA (17). The diverging results between these two exploratory reports and our study might be partially explained by differences in methodology. First, the present study defined target lesions according to 18F-FDG uptake and size, whereas Morbelli’s study considered only the size of the lesion, which led to the inclusion of low-uptake lesions within the MATV, and these are known to have less impact on survival (15). Second, both studies used a fixed SUV threshold of 2.5 for tumor delineation (17,31), whereas in the present study, the much higher threshold was determined on the basis of the background blood pool or liver 18F-FDG activity, as recommended by the PERCIST methodology (25), and this leads to less overestimation of the tumor volume. Finally, and more importantly, these differences of results should be interpreted with caution because patterns of genomic, molecular biology, phenotypic behavior vary greatly depending on cancer type.
Potential limitations of this study were that the correlation and the prognostic value of cfDNA and WB-MATV biomarkers, when combined, were not validated in an independent data set. The prognostic value of WB-MATV in this study was determined on the basis of the RegARd-C cohort already partially used in a previous study (16). Only the total cfDNA level was evaluated in this study. Further analyses of the current data set will explore the correlation between WB-MATV and circulating tumor DNA (based on pre-identified specific tumor mutations).
CONCLUSION
This study confirms the high independent prognostic value of circulating cfDNA and WB-MATV biomarkers in chemorefractory mCRC patients. The added value of metabolic imaging was found mostly in those patients with low baseline cfDNA, among whom WB-MATV identified a subgroup of patients with intermediate prognosis. The results of this study provide a firm basis for developing new risk prognostic models for chemorefractory mCRC patients integrating PET data, cfDNA, gene mutational status, and relevant clinical factors. Allowing a more accurate stratification of patients, these models should become essential tools to support oncologists in tailoring therapy strategies according to the patients’ individual risk.
DISCLOSURE
This academic work was supported and sponsored by the Jules Bordet Institute. Bayer Healthcare AG provided regorafenib and a research grant for the RegARd-C trial but played no further role in the design or conduct of the study, data collection, management, analysis, or interpretation or in the preparation, review, or approval of the manuscript. No other potential conflict of interest relevant to this article was reported.
KEY POINTS
QUESTION: Does baseline WB-MATV bring additional prognostic value when combined with circulating cfDNA and clinical parameters in chemorefractory mCRC patients?
PERTINENT FINDINGS: This study, done in the framework of a prospective multicenter trial, demonstrates the high independent prognostic value of baseline WB-MATV and circulating cfDNA biomarkers in chemorefractory mCRC patients. The added value of baseline WB-MATV was found mostly in those patients with low cfDNA, among whom WB-MATV identified a subgroup of patients with intermediate prognosis.
IMPLICATIONS FOR PATIENT CARE: The results of this study provide a firm basis to improve patient stratification in mCRC patients, which can support oncologists in tailoring therapy strategies according to the patients’ individual risk.
Acknowledgments
We thank Camilo Garcia, MD, for his contribution to enhancing the quality standard of PET/CT sites in the RegARd-C study and all physicians who participated in the recruitment of patients, notably, Amelie Deleporte, MD, Karen Geboes, MD, PhD, Thierry Delaunoit, MD, Gauthier Demolin, MD, Marc Peeters, MD, PhD, Lionel D’Hondt, MD, PhD, Jos Janssens, MD, Javier Carrasco, MD, Stéphane Holbrechts, MD, Jean-Charles Goeminne, MD, PhD, Jean-Luc Van Laethem, MD, PhD, and Philippe Vergauwe, MD. We express our deep gratitude to the patients and their families who agreed to participate in this project. We thank all staff involved in the 9 PET/CT centers who participated in this study.
Footnotes
Published online Mar. 8, 2019.
- © 2019 by the Society of Nuclear Medicine and Molecular Imaging.
REFERENCES
- Received for publication November 3, 2018.
- Accepted for publication February 11, 2019.


