


Abstract
Quantitative assessment of 11C-erlotinib uptake may be useful in selecting non–small cell lung cancer (NSCLC) patients for erlotinib therapy. The purpose of this study was to find the optimal pharmacokinetic model for quantification of uptake and to evaluate various simplified methods for routine analysis of 11C-erlotinib uptake in NSCLC patients. Methods: Dynamic 15O-H2O and 11C-erlotinib scans were obtained in 17 NSCLC patients, 8 with and 9 without an activating epidermal growth factor receptor mutation (exon 19 deletion or exon 21-point mutation). Ten of these subjects also underwent a retest scan on the same day. 11C-erlotinib data were analyzed using single-tissue and 2-tissue-irreversible and -reversible (2T4k) plasma input models. In addition, several advanced models that account for uptake of radiolabeled metabolites were evaluated, including a variation of the 2T4k model without correcting for metabolite fractions in plasma (2T4k-WP). Finally, simplified methods were evaluated—that is, SUVs and tumor-to-blood ratios (TBR)—for several scan intervals. Results: Tumor kinetics were best described using the 2T4k-WP model yielding optimal fits to the data (Akaike preference, 43.6%), acceptable test–retest variability (12%), no dependence on perfusion changes, and the expected clinical group separation (P < 0.016). Volume of distribution estimated using 2T4k-WP and 2T4k were highly correlated (R2 = 0.94). Similar test–retest variabilities and clinical group separations were found. The 2T4k model did not perform better than an uncorrected model (2T4k-WP), probably because of uncertainty in the estimation of true metabolite fractions. Investigation of simplified approaches showed that SUV curves normalized to patient weight, and injected tracer dose did not reach equilibrium within the time of the scan. In contrast, TBR normalized to whole blood (TBR-WB) appeared to be a useful outcome measure for quantitative assessment of 11C-erlotinib scans acquired 40–60 min after injection. Conclusion: The optimal model for quantitative assessment of 11C-erlotinib uptake in NSCLC was the 2T4k-WB model. The preferred simplified method was TBR-WB (40–60 min after injection) normalized using several whole-blood samples.
PET is the method of choice for in vivo visualizing and quantifying molecular pathways and interactions in the human body. PET may be useful for predicting and monitoring response to treatment in non–small cell lung cancer (NSCLC) patients, potentially providing an in vivo method to optimize treatment strategies.
At present, treatment of NSCLC patients includes surgery, radiotherapy, and chemotherapy. Next to cytotoxic chemotherapy, various forms of targeted therapy are in use, such as treatment with epidermal growth factor receptor (EGFR) tyrosine kinase inhibitors (TKIs). In NSCLC tumors, these TKIs show a higher efficacy if an activating EGFR mutation is present (1–3). Identification of patients with activating EGFR mutations remains a challenge, because tumor sampling for DNA sequencing is not always possible (4).
Recently, the TKI erlotinib was labeled with 11C, thereby enabling in vivo studies of its kinetic behavior using PET. In an initial study in humans, a method to quantify 11C-erlotinib uptake was reported (5). This method required a dynamic scan protocol of up to 60 min to characterize 11C-erlotinib kinetics in tumor tissue. In addition, although it was shown that an image-derived input function (IDIF) could be used for quantification of 11C-erlotinib uptake in drug-naïve patients, several arterial blood samples were still required to calibrate this IDIF and to estimate parent 11C-erlotinib fractions. This initial study did not, however, investigate pharmacokinetic models that allow for tumor uptake of labeled metabolites of 11C-erlotinib.
The main objective of the present study was to identify the optimal pharmacokinetic model for quantification of tumor 11C-erlotinib kinetics in NSCLC patients, including models that account for uptake of labeled metabolites of 11C-erlotinib. The second objective was to investigate simplified methods that could be used in combination with whole-body scans, enabling the assessment of multiple lesions in the same patient.
MATERIALS AND METHODS
Scanning Protocol
Data were derived from an ongoing clinical study, approved by the Medical Ethics Review Committee of VU University Medical Center, consisting of 17 subjects: 8 with an activating EGFR mutation (exon 19 deletion or exon 21-point mutation, MT) and 9 without EGFR mutation/wild-type. The EGFR exon 19 deletions and exon 21-point mutation (L858R) confer to TKI sensitivity (6). EGFR exon 20 insertions (D770-N771 and V769-D770) are known to be insensitive to EGFR TKI (7). Each subject gave written informed consent before inclusion in the study.
Each subject was scanned on a Gemini TF-64 PET/CT scanner (Philips). The scan protocol consisted of a low-dose CT for attenuation correction followed by dynamic 15O-H2O and 11C-erlotinib PET scans. These scans were obtained after intravenous bolus injections of 370 ± 37 and 256 ± 53 MBq of 15O-H2O and 11C-erlotinib, respectively. No significant differences in either injected activity or specific activities were seen between the groups. Ten patients underwent the full protocol twice on the same day to assess test–retest variability.
Acquired list-mode data were reconstructed into 26 (1 × 10, 8 × 5, 4 × 10, 2 × 15, 3 × 20, 2 × 30, and 6 × 60 s) and 36 (1 × 10, 8 × 5, 4 × 10, 2 × 15, 3 × 20, 2 × 30, 6 × 60, 4 × 150, 4 × 300, and 2 × 600 s) frames for 15O-H2O and 11C-erlotinib scans, respectively. Data were reconstructed using 3-dimensional row-action maximum-likelihood algorithm (8) in combination with CT-based attenuation correction, providing images with a final voxel size of 4 × 4 × 4 mm3 and a spatial resolution of 5–7 mm in full width at half maximum. Reconstructions included all usual corrections, such as detector normalization, and decay, dead time, attenuation, randoms, and scatter corrections.
During the 11C-erlotinib scans, up to 8 manual arterial samples were taken at discrete times (∼2.5, 5, 10, 15, 20, 30, 40, and 60 min after injection) (9). These samples were used to adjust the IDIF for calibration offsets and plasma–to–whole-blood ratios and to correct for labeled metabolites.
Region-of-Interest Definition
Using the CT images, we manually drew volumes of interest within the tumor boundaries, avoiding blood vessels and necrosis as much as possible. Subsequently, these regions of interest were projected onto the corresponding 15O-H2O or 11C-erlotinib dynamic PET image sequences to extract regional tumor time–activity curves. Finally, IDIF volumes of interest were generated by defining circular regions of interest inside the descending aorta using a summed image of the early dynamic PET frames (typically 30–35 s after injection) in 10 successive slices, resulting in an approximate volume of 6.3 mm3. Although, in general, use of the ascending aorta is to be preferred, in this study the descending aorta was used, as it was within the field of view for all patients. In addition, IDIF volumes of interest were placed as far away from the liver as possible to avoid spill-over.
Kinetic Analysis Using Plasma Input Models
All time–activity curves were analyzed using plasma input-based pharmacokinetic models (10). 15O-H2O time–activity curves were analyzed using an IDIF and the standard single-tissue-compartment model (1T2k) with an additional parameter for fractional arterial blood volume (11). Analysis of 11C-erlotinib time–activity curves was performed using 3 conventional pharmacokinetic plasma input models (10), all with an additional parameter for fractional blood volume: 1T2k; 2T3k, irreversible 2-tissue-compartment model; and 2T4k, reversible 2-tissue-compartment model.
Standard pharmacokinetic models assume various simplifications that do not have to apply in the case of tumors. For example, metabolites could enter the tumor tissue, and this is not considered in the standard models. Therefore, 3 additional nonconventional models were developed and evaluated: 1T2k-x2, 2 parallel 1T2k plasma input models, one for parent 11C-erlotinib and the other for labeled metabolites to assess whether labeled metabolites enter tumor tissue; 2T4k_1T2k, 2 parallel plasma input models, a 2T4k model for parent 11C-erlotinib and a 1T2k model for labeled metabolites, again assessing whether labeled metabolites enter tumor tissue; and 2T4k-WP, a pragmatically modified 2T4k model using whole blood as an input function rather than parent plasma to assess whether a metabolite-corrected input function is indeed necessary.
Fit quality was assessed visually, and the Akaike criterion (12) was used to assess the goodness of fit for the various models. The best models were used to derive various kinetic parameters such as binding potential (BPND) and volume of distribution (VT). Parameter estimates from these models were compared with each other using the Pearson product moment correlation coefficients. In addition, test–retest analyses were performed to assess parameter variability, and each parameter was evaluated for its capacity to differentiate between the 2 clinical groups. Next, dependency of the kinetic parameters on perfusion was assessed by deriving the Pearson correlation coefficients with 15O-H2O–derived blood flow (F) values. Finally, to understand the effects of metabolites on model preferences, individual metabolite profiles and time–activity curves were plotted with curves color-coded according to the preferred model. As a level of metabolism, the metabolite fraction measured at 60 min after injection was used.
Simplified (Static) Analyses
The accuracies of several simplified static approaches were evaluated. SUVs, normalized for patient weight and injected dose, were evaluated for 4 different time intervals (20–30, 30–40, 40–50, and 50–60 min). In addition, tumor-to-blood ratios (TBRs) were evaluated using both arterial whole blood (TBR-WB) and metabolite-corrected plasma (TBR-PP) activity concentrations. The same 4 time intervals (20–30, 30–40, 40–50, and 50–60 min) were used for this analysis.
For all simplified measures, the equilibration time was derived from normalized time–activity curves. Next, simplified parameters for the optimal time interval were compared with parameter estimates derived from the optimal kinetic models using the Pearson correlation coefficients. In addition, test–retest analysis, clinical group separation, and dependency on perfusion were determined to assess possible usefulness in clinical practice.
RESULTS
Patient Characteristics
Patient characteristics are given in Table 1. This table also lists missing 11C-erlotinib and 15O-H2O scans due to technical reasons (radiosynthesis failure or patient movement) or because a full test–retest study was not performed. In addition, all scans from 2 subjects were excluded because of nonquantifiable uptake in the tumor. One of these patients showed lymph node relapse (subject 15) and the other heterogeneous tumor uptake due to a mixture of atelectasis and tumor (subject 8). In patient 6, an EGFR exon 20-point mutation (G779S), a rare mutation of unknown significance, was seen together with a driver mutation of Kras exon 1 and was therefore considered resistant to EGFR TKI (7,13). In patient 14, both an EGFR exon 19 deletion and an EGFR exon 20 (T790 M) was seen. These mutations confer to TKI sensitivity and TKI resistance, respectively.
Patient Characteristics and Overview of Scans Obtained
Input Data
Figure 1 summarizes measurements of all blood sample data. Only polar metabolite fractions could be measured, because activity levels were too low to measure nonpolar metabolites reliably. A relatively low level of metabolites was seen in most subjects with an average (±SD) of 29% ± 21% at 60 min. The variability in tracer metabolism within patients was maximally 20%, but the differences between the patients were much larger because of the differences in liver function between NSCLC patients (Fig. 1C). Several initial measurements (n = 10) of nonpolar metabolites showed that their overall contribution was small, making it difficult, if not impossible given the short half-life of 11C, to measure the minor nonpolar metabolite fraction with any degree of accuracy. Therefore, input functions were not corrected for nonpolar metabolites but only for polar metabolites.

Data from manual blood samples with whole-blood concentrations normalized to injected dose and patient weight (A), plasma–to–whole-blood ratios (B), and polar metabolite fractions in plasma (C) as function of time. Solid lines represent average values, and dashed lines represent values with 1 SD difference.
Optimal Kinetic Model for 11C-Erlotinib
Visual assessment of 11C-erlotinib tumor fits showed that the 1T2k model was unable to fit the time–activity curves properly (Fig. 2). This was in concordance with results from the Akaike information criterion, which showed that, among the standard models, 11C-erlotinib data were best fitted to the reversible 2-tissue model (96% preference), followed by the 2T3k model (4% preference), with no preference for the 1T2k model.
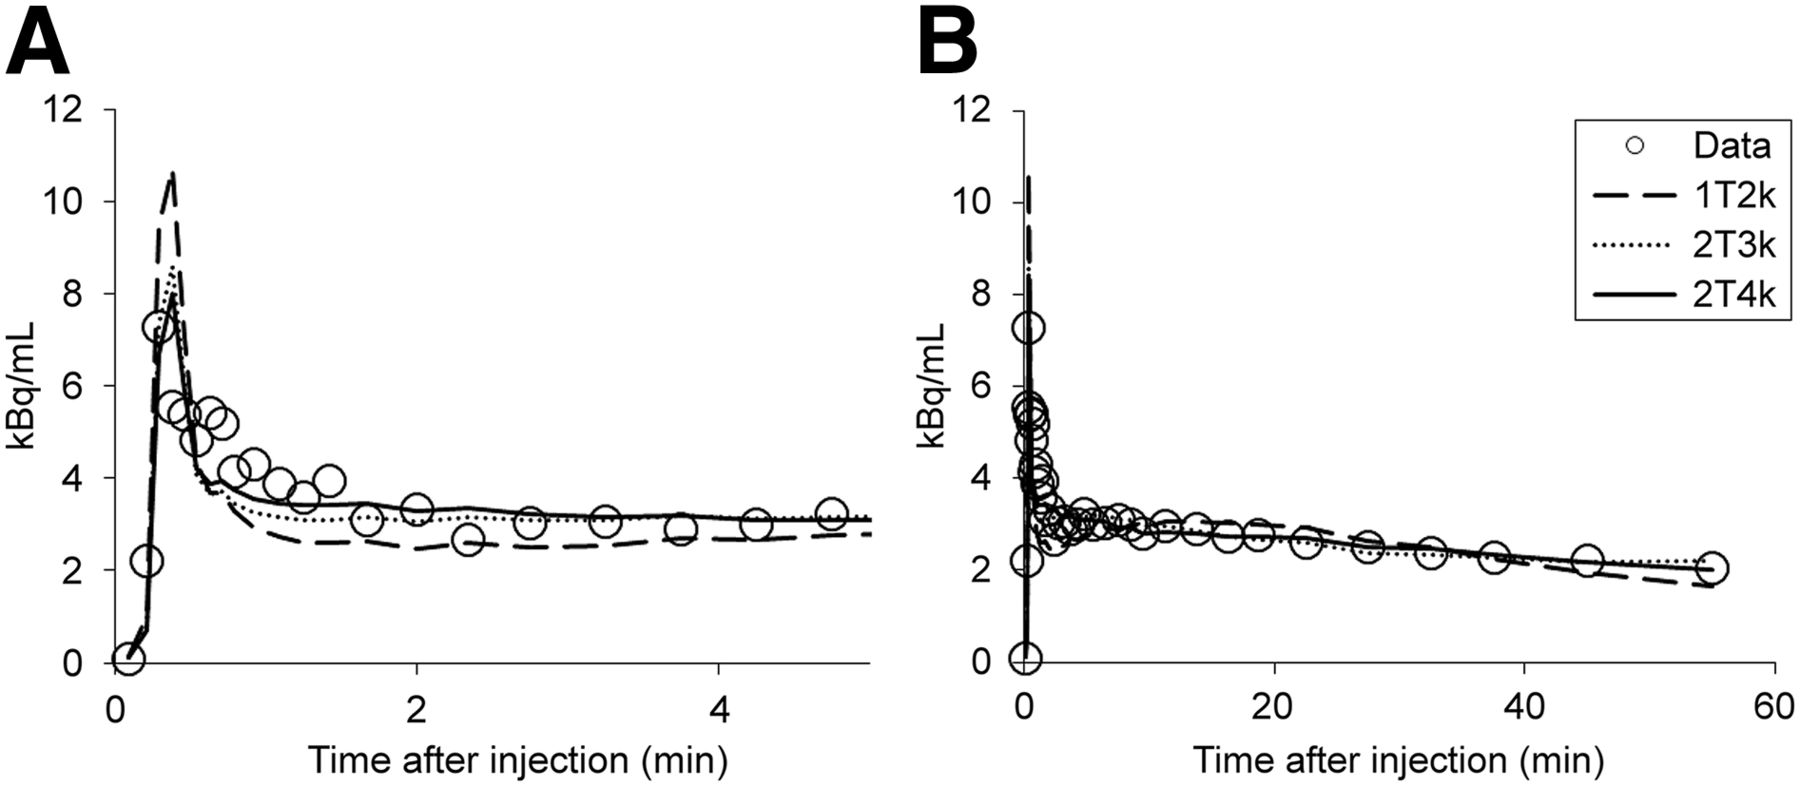
Typical 11C-erlotinib tumor time–activity curve fitted to conventional plasma input models. (A) Initial part (0–5 min) of time–activity curve. (B) Full time–activity curve (0–60 min).
When the nonconventional models were included, the Akaike criterion showed preference for the 2T4k-WP model (43.6%), followed by conventional 2T4k (21.7%) and 2T4k-1T2k (21.7%) models. The 1T2k-x2 model was preferred in only 13% of the cases. Therefore, the 2T4k-WP was selected for further comparisons with the conventional 2T4k model.
Relating Akaike model preference to metabolite curves (Fig. 3A) indicated that the standard metabolite-corrected plasma input model (2T4k) was preferred only in the case of relatively low levels of metabolite fractions. However, visually, for these data the Akaike model preference did not seem to be related to the shape of the time–activity curve (Fig. 3B).

Effect of metabolism on Akaike model preference measured metabolite fractions in plasma as function of time (A) and normalized tumor time–activity curves (TAC) (B). In both figures, curves are color-coded according to Akaike preferred model.
Corresponding kinetic parameters from both models (2T4k and 2T4k-WP) correlated well, and VT was found to be the most accurate measure for assessing 11C-erlotinib uptake in tumors. For example, VT values of 2T4k and 2T4k-WP models were highly correlated (R2 = 0.94), giving only a small underestimation of 2T4k-WP values as compared with those obtained using 2T4k (1.7%). Furthermore, test–retest variability of all kinetic parameters (K1, VT, BPND) and level of metabolism were not significantly different between groups. As for both models, variability averaged over the entire group was acceptable for VT (12%) but high for BPND (53%) using both models. Therefore, BPND was not assessed any further. Both models demonstrated a significant group difference of the average VT between the 2 clinical groups (P < 0.016, Fig. 4). In addition, both 2T4k and 2T4k-WP models showed expected relationships with 15O-H2O–derived blood flow (F) values—that is, good correlation between 11C-erlotinib K1 and F (R2 = 0.80 for both 2T4k and 2T4k-WP models) and no correlation between 11C-erlotinib VT and F (R2 = 0.11 and 0.17 for 2T4k and 2T4k-WP models, respectively).

Box plots showing group differences for 2T4k VT (A) and 2T4k-WP VT (B). MT = subjects with an activating EGFR mutation; WT = wild type/without EGFR mutation.
Simplifications
Time–activity curves did not show an equilibration uptake within the duration of the scan (Fig. 5), as they were constantly declining until the end of the scan time. Therefore, use of SUV to quantify 11C-erlotinib uptake is time-dependent and thus suboptimal for imaging this reversible ligand. In contrast, TBR showed equilibration after 40 min, although somewhat better for TBR-WB than for TBR-PP (Fig. 5).
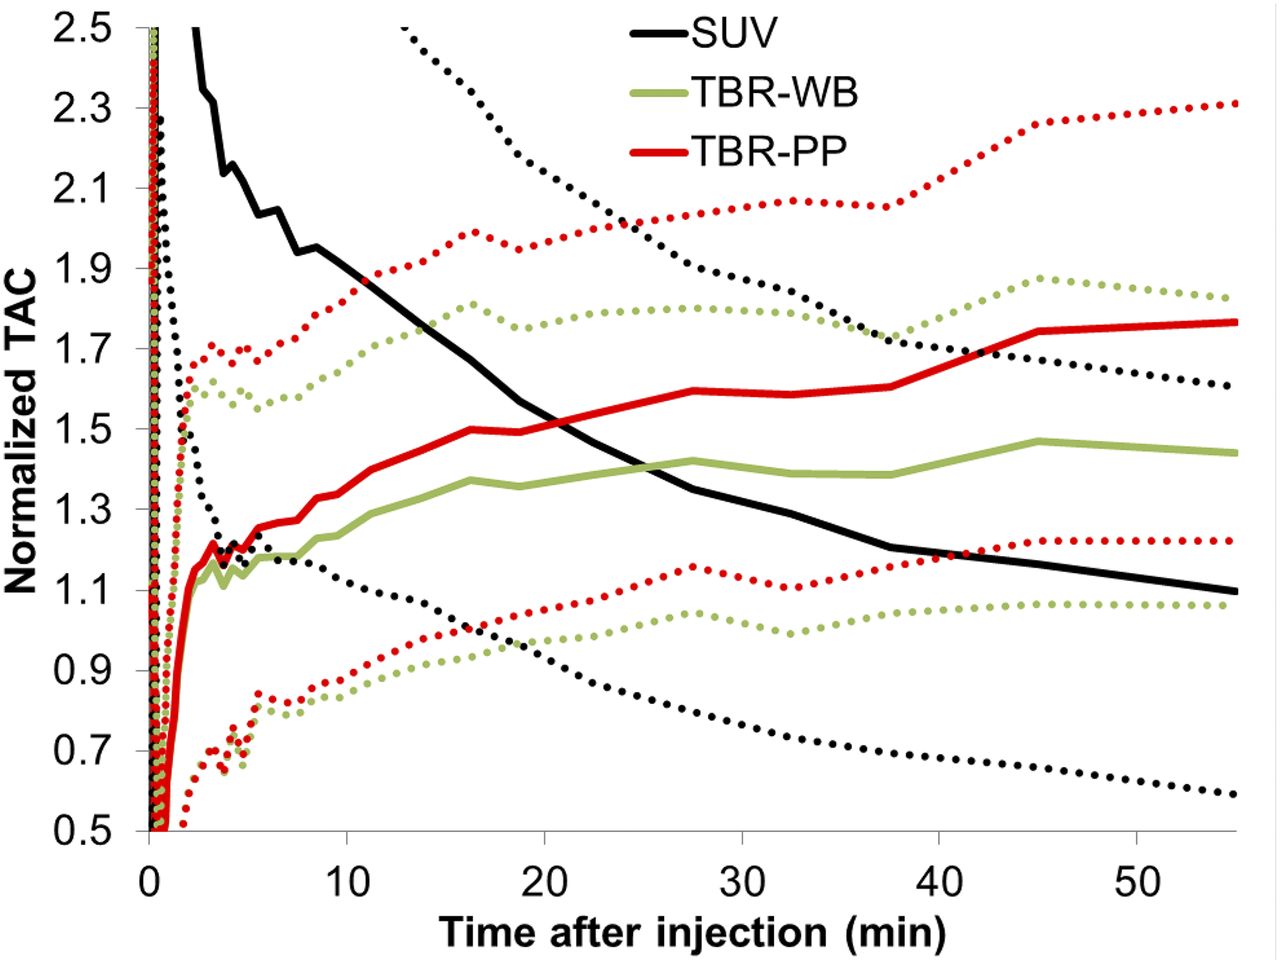
Average time–activity curves (TAC) (solid lines) normalized to patient weight and injected dose (SUV) and to blood data with (TBR_PP) and without metabolite correction (TBR_WB). Dotted lines represent 1 SD from mean.
In addition, TBR-WB showed a better correlation with 2T4k-WP–derived VT than TBR-PP for both the intervals 40–50 (Fig. 6A) and 50–60 (Fig. 6B) min. The correlation with 2T4k-WP VT, however, was interval-dependent and for TBR-WB changed by 7% between the 2 intervals, with a larger change for TBR-PP (Fig. 6).

Correlations of TBR-WB and TBR-PP with 2T4k-WP–derived VT for intervals of 40–50 (A) and 50–60 min (B).
TBR-WB seems to be a more stable parameter than TBR-PP, and further evaluations were therefore restricted to TBR-WB. TBR-WB showed no correlation with 15O-H2O–derived F (R2 = 0.02). Test–retest analysis showed good variability for TBR-WB 40–50 min (8.2%) and acceptable variability for TBR-WB 50–60 min (13.7%). However, there was no significant difference between the 2 clinical groups for both intervals (40–50 min, P = 0.07, Fig. 7A; 50–60 min, P = 0.15, Fig. 7B).

Box plots showing group differences for TBR-WB (40–50 min) (A) and TBR-WB (50–60 min) (B). MT = subjects with an activating EGFR mutation; WT = wild type/without EGFR mutation.
DISCUSSION
In this study, various pharmacokinetic models for quantification of 11C-erlotinib kinetics in NSCLC patients were evaluated, including several nonconventional models that account for uptake of labeled metabolites in tumor tissue. In addition, simplified methods were evaluated that would allow for whole-body scans without arterial sampling.
Optimal Kinetic Model
For all conventional models, metabolite-corrected plasma input functions are used, as they assume that there is no uptake of radiolabeled metabolites in tumor tissue. Metabolite correction requires accurate measurements of metabolite fractions in plasma. In the present study, metabolite measurements were hampered by technical issues—that is, low counts within the sample measurement times. Therefore, it was not possible to measure the (very low) level of nonpolar metabolites, and consequently the metabolite correction was based only on measurement of polar metabolites. This approach can be justified by the fact that levels of nonpolar metabolites were low (<1%).
Among conventional models, the optimal model was the 2T4k model. This model showed, both visually (Fig. 2) and according to the Akaike information criterion, better fits than the 1T2k and 2T3k models. Furthermore, 11C-erlotinib uptake (VT) can be estimated reproducibly using the 2T4k model, with an acceptable test–retest variability of 12%. Finally, the 2T4k model provided VT values that were significantly different between the 2 clinical groups (P < 0.016).
As mentioned above, conventional tracer kinetic models assume no uptake of metabolites in tumor tissue. Given the microvascular structure of tumors, it is important to also investigate alternative models that account for 11C-labeled metabolites entering tumor tissue. Investigation of several of these nonconventional models showed that the metabolite input models (1T2k-x2 and 2T4k-1T2k) showed a poorer performance than the 2T4k-WP model. In addition, the Akaike criterion indicated that the conventional 2T4k and nonconventional 2T4k-1T2k models performed equally well but poorer than the 2T4k-WP model. This suggests that either no metabolites enter the tumor or, more likely, the 1T2k-x2 and 2T4k-1T2k models do not provide reproducible results. This, in turn, could be due to the relatively slow uptake of metabolites, resulting in unreliable parameter estimates for the metabolite compartment. Therefore, it was decided to select the 2 most probable models (2T4k-WP and 2T4k) for further investigation.
When looking at the fitted kinetic parameters themselves, overall a slightly better performance was seen for the 2T4k-WP model than for the 2T4k model. Nevertheless, strong correlations were found between corresponding kinetic parameters from both models. Physiologically and clinically plausible outcome parameters were obtained for the 2T4k-WP model when test–retest variability, separation of the 2 clinical groups, and correlation with perfusion were considered. Interestingly, Akaike fit preference for 1 of the 2 models was not dependent on the shape of the tumor time–activity curves (Fig. 3B). However, preference for the conventional 2T4k model over the 2T4k-WP model was seen primarily in patients with a relatively low level of metabolism (Fig. 3A)—that is, in those cases in which the possible contribution of labeled metabolites to the signal would be small, thus favoring a model with less fit parameters. K1 from both models (2T4k and 2T4k-WP) was highly correlated with F, irrespective of the level of metabolism, because estimation of K1 primarily is based on fitting the initial part of the time–activity curve when the fraction of metabolites still is very low.
Future studies may be needed to improve metabolite measurements to accurately describe their true behavior. Findings from this study showed that quantification of dynamic 11C-erlotinib data can be performed using the conventional 2T4k model, but in practice a simpler model not requiring metabolite correction at all (2T4k-WP) yields slightly better results and is, therefore, the preferred model.
Simplified Methods
Analysis of several simplified approaches showed that SUV curves normalized to patient weight and injected tracer dose did not reach equilibrium within the scan time, resulting in unstable outcomes (Fig. 5). Therefore, SUV cannot be used for reliable quantitative assessment of 11C-erlotinib uptake up to 60 min after injection.
In contrast, TBR measures showed to be more useful for a simple semiquantitative assessment of 11C-erlotinib uptake, which could be used in combination with whole-body scans. TBR values, calculated over several time intervals after injection (40–60 min), were not correlated with perfusion (i.e., they were not flow-dependent) and showed good correlation with 2T4k-WP VT values (Fig. 6). Furthermore, performance was better for TBR-WB than for TBR-PP, which could be due to inaccuracies in estimation of metabolite fractions. However, TBR was less sensitive in distinguishing between the 2 clinical groups (i.e., EGFR-mutated vs. EGFR wild-type groups) compared with 2T4k-WP VT. These groups showed significantly different VT values (P < 0.016), but this was not the case for TBR-WB (P < 0.15). Contributing factors may be that TBR is a simplified measure and that the power of the present study is rather low (i.e., limited number of subjects). Nevertheless, TBR-WB showed a trend toward a difference between patient groups, and, among the simplified measures, it provided the best correlation with 2T4k-WP–derived VT. Although further studies are needed, at present, TBR-WB appears to be an attractive simplified method for analysis of (clinical) whole-body studies, which would be needed to assess potential interlesional heterogeneity in uptake of 11C-erlotinib.
CONCLUSION
Analysis of dynamic 11C-erlotinib studies can be performed using a reversible 2-tissue compartment model without metabolite correction (2T4k-WP), because it yields reproducible estimates of 11C-erlotinib uptake (VT) in tumors. A simplified method with potential is TBR-WB (40–60 min after injection). Results highly correlated with 2T4k-WP–derived VT, and it would be suitable for assessing 11C-erlotinib uptake in whole-body scans to asses multiple lesions at the same time.
DISCLOSURE
The costs of publication of this article were defrayed in part by the payment of page charges. Therefore, and solely to indicate this fact, this article is hereby marked “advertisement” in accordance with 18 USC section 1734. This work was based on data produced by studies within the framework of the Center for Translational Molecular Medicine, Airforce project (grant 03O-103). No other potential conflict of interest relevant to this article was reported.
Footnotes
Published online Feb. 4, 2016.
- © 2016 by the Society of Nuclear Medicine and Molecular Imaging, Inc.
REFERENCES
- Received for publication August 12, 2015.
- Accepted for publication January 19, 2016.


Jump to section
Related Articles
Cited By...
- ABCG2- and ABCB1 Inhibition Using Supratherapeutic Doses of Erlotinib: Clinical Implications in the Treatment of Central Nervous System Metastases
- A Proof-of-Concept Study to Inhibit ABCG2- and ABCB1-Mediated Efflux Transport at the Human Blood-Brain Barrier
- Selection of Protein Kinase Inhibitors Based on Tumor Tissue Kinase Activity Profiles in Patients with Refractory Solid Malignancies: An Interventional Molecular Profiling Study
- PET Imaging of Receptor Tyrosine Kinases in Cancer
- Molecular Imaging of ABCB1 and ABCG2 Inhibition at the Human Blood-Brain Barrier Using Elacridar and 11C-Erlotinib PET
- Forward to the Past: The Case for Quantitative PET Imaging