


Abstract
Transporters such as ABCB1 and ABCG2 limit the exposure of several anticancer drugs to the brain, leading to suboptimal treatment in the central nervous system. The purpose of this study was to investigate the effects of the ABCB1 and ABCG2 inhibitor elacridar on brain uptake using 11C-erlotinib PET. Methods: Elacridar and cold erlotinib were administered orally to wild-type (WT) and Abcb1a/b;Abcg2 knockout mice. In addition, brain uptake was measured using 11C-erlotinib imaging and ex vivo scintillation counting in knockout and WT mice. Six patients with advanced solid tumors underwent 11C-erlotinib PET scans before and after a 1,000-mg dose of elacridar. 11C-erlotinib brain uptake was quantified by pharmacokinetic modeling using volume of distribution (VT) as the outcome parameter. In addition, 15O-H2O scans to measure cerebral blood flow were acquired before each 11C-erlotinib scan. Results: Brain uptake of 11C-erlotinib was 2.6-fold higher in Abcb1a/b;Abcg2 knockout mice than in WT mice, measured as percentage injected dose per gram of tissue (P = 0.01). In WT mice, the addition of elacridar (at systemic plasma concentrations of ≥200 ng/mL) resulted in an increased brain concentration of erlotinib, without affecting erlotinib plasma concentration. In patients, the VT of 11C-erlotinib did not increase after intake of elacridar (0.213 ± 0.12 vs. 0.205 ± 0.07, P = 0.91). 15O-H2O PET showed no significant changes in cerebral blood flow. Elacridar exposure in patients was 401 ± 154 ng/mL. No increase in VT with increased elacridar plasma exposure was found over the 271–619 ng/mL range. Conclusion: When Abcb1 and Abcg2 were disrupted in mice, brain uptake of 11C-erlotinib increased both at a tracer dose and at a pharmacologic dose. In patients, brain uptake of 11C-erlotinib was not higher after administration of elacridar. The more pronounced role that ABCG2 appears to play at the human blood–brain barrier and the lower potency of elacridar to inhibit ABCG2 may be an explanation of these interspecies differences.
Central nervous system (CNS) metastases occur frequently in cancer patients and are known to result in a dismal prognosis. This can partly be explained by the pharmacokinetic properties of anticancer drugs, in particular their limited distribution into the brain.
The blood–brain barrier (BBB) is a major impediment to achieving pharmacologically active concentrations in the CNS (1,2). A particular hurdle for CNS uptake of drugs is the expression of efflux transporters at the BBB endothelium, such as the adenosine triphosphate–binding cassette (ABC) transporters ABCB1, known as P-glycoprotein, and ABCG2, known as breast cancer resistance protein (1–3). These efflux transporters restrict access to the CNS of even small lipophilic compounds, which would otherwise be able to penetrate cellular membranes by passive diffusion.
CNS tumors and metastases can disrupt the integrity of the BBB. However, this disruption is heterogeneous and occurs predominantly in the tumor core, where microvascular proliferation results in vessel leakiness (1,4). Brain tissue adjacent to the tumor may therefore contain tumor cells that benefit from protection by an intact BBB. Hence, the CNS is regarded as a sanctuary site for anticancer drugs (5).
Elacridar is an inhibitor of ABCB1 (6) and ABCG2 (7). Numerous preclinical studies have shown that elacridar is able to enhance the brain penetration of substrate drugs, including erlotinib (8,9). Erlotinib is an epidermal growth factor receptor inhibitor used in the treatment of advanced non–small cell lung cancer. Although non–small cell lung cancer frequently metastasizes to the brain, erlotinib exposure in the CNS is limited (10,11), as it is a substrate of both ABCB1 and ABCG2 (12–14). 11C-erlotinib was developed as a radiotracer to noninvasively study the biodistribution and target binding of erlotinib in vivo (15,16) and has been used to noninvasively study epidermal growth factor receptor mutations in tumor lesions of cancer patients (17,18).
The purpose of our study was to assess whether 11C-erlotinib PET can quantify erlotinib uptake in the brain, as a readout of ABCB1 and ABCG2 inhibition at the BBB. First, experiments on mice were performed to establish the elacridar concentration needed to achieve Abcb1a/b and Abcg2 inhibition. Next, in vivo imaging in wild-type (WT) and Abcb1a/b and Abcg2 knockout mice was performed to establish the feasibility of monitoring drug transporter inhibition at the BBB using 11C-erlotinib PET. Finally, a clinical trial using 11C-erlotinib PET on cancer patients was performed to noninvasively study the effects of ABCB1 and ABCG2 inhibition on the brain penetration of erlotinib.
MATERIALS AND METHODS
Preclinical Pharmacology
Preclinical experiments were performed using female Friend Virus B mice, between 10 and 14 wk of age, which were either WT or Abcb1a/1b;Abcg2 double-knockout.
Elacridar suspensions were prepared in vehicle solution (1% m/v hydroxypropyl methyl cellulose, 2% v/v polysorbate 80 in water) at concentrations of 1, 2.5, and 5 mg/mL. An erlotinib suspension was prepared at 2 mg/mL in the same vehicle solution.
Nonfasted animals received 10 μL of elacridar (0, 10, 25, or 50 mg/kg) per gram of body weight orally by gavage, followed 30 min later by 10 μL of oral erlotinib (20 mg/kg) per gram. At 4 h after erlotinib dosing, blood was sampled by cardiac puncture. The animals were sacrificed, and brain tissue was collected. Brain tissue was homogenized in 3 mL of 1% v/v bovine serum albumin in water using a Fastprep 24 homogenizer (MPBio). Erlotinib and elacridar were quantified ex vivo in both plasma and brain homogenates by liquid chromatography tandem mass spectrometry. Each elacridar-treated group (0, 10, 25, and 50 mg/kg) consisted of 4 mice. A group of Abcb1a/1b;Abcg2 knockout mice (n = 5) was used as a positive control.
Preclinical Imaging
Abcb1a/b;Abcg2 WT and knockout mice (n = 2 for each group) were positioned in pairs in a double lutetium oxyorthosilicate/Lu1.8Y0.2SiO5(Ce) or lutetium oxyorthosilicate–lutetium yttrium oxyorthosilicate layer high-resolution research tomograph (Siemens/CTI) PET scanner (19). First, a transmission scan was acquired using a 740-MBq 2-dimensional fan-collimated 137Cs (662 keV) moving point source (20). Next, a dynamic emission scan was acquired immediately after administration of 8–10 MBq of 11C-erlotinib (specific activity > 18.5 GBq/μmol) to each animal. Emission data were acquired for 60 min in 3-dimensional (3D) list mode and rebinned into the following frame sequence: 4 × 30, 3 × 60, 2 × 150, and 4 × 300 s. After corrections for decay, dead time, attenuation, randoms, and scatter, scans were reconstructed using a 3D ordinary Poisson ordered-subsets expectation maximization algorithm for mice (20). This resulted in images with an average spatial resolution of 3 mm in full width at half maximum (19).
After the scans, the mice were sacrificed. The brains were removed and weighed, and radioactivity was measured in a 1282 Compugamma CS (LKB Wallac) using five 10-μL aliquots of the injected formulation as an internal standard. The results were expressed as percentage injected dose per gram of brain tissue, corrected for decay to time of injection.
Clinical Elacridar Formulation
Elacridar hydrochloride was formulated as an (unpatented) tablet formulation, of which the pharmaceutical development was described earlier (21). These tablets have been shown to be well tolerated and resulted in relevant pharmacokinetic exposure in healthy volunteers (22).
Clinical Study Design
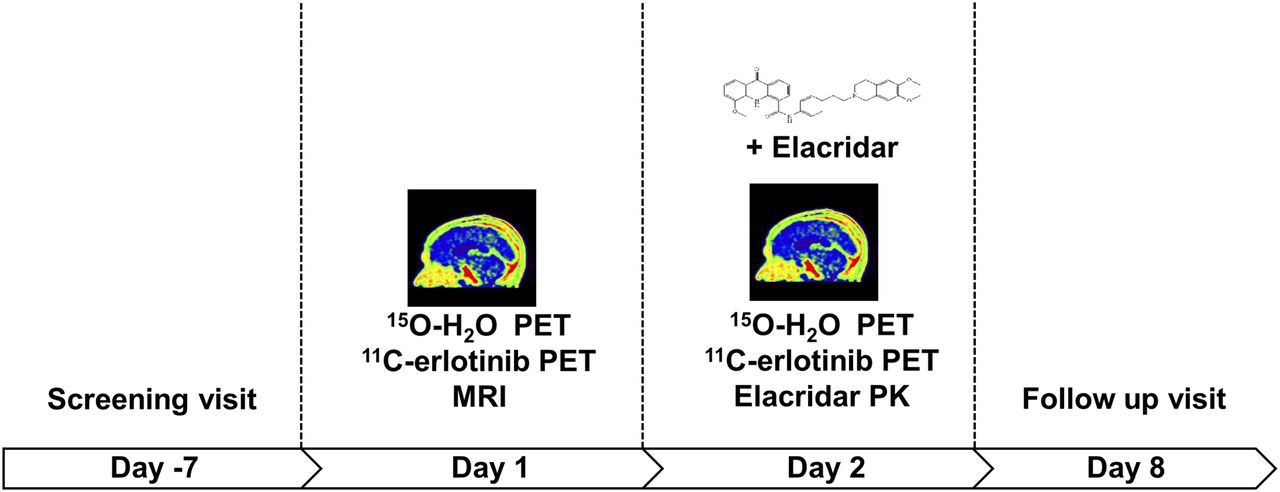
An overview of the clinical study design is presented in Figure 1. After a screening visit (day −7), patients were scheduled for 11C-erlotinib PET scans on 2 consecutive days (days 1 and 2). The 11C-erlotinib was given at a specific activity of more than 18.5 GBq/μmol without additional unlabeled erlotinib.

Schematic of clinical study design.
Because elacridar plasma concentrations have been shown to peak at 8–12 h after intake (22), patients took an oral 1,000-mg dose 8–12 h before the second scan. An MRI of the brain was acquired on day 1 with the purpose of excluding any brain metastases, because these might have compromised the function of the BBB. Each 11C-erlotinib scan was preceded by a 15O-H2O scan to assess possible effects of elacridar on cerebral blood flow. At the start and end of the second 11C-erlotinib scan, a venous blood sample was drawn to measure elacridar plasma concentrations (23).
On day 8, a follow-up visit was scheduled. At each visit, patients were evaluated for safety, including assessment of adverse events, physical examination, performance status, blood pressure and heart rate measurements, and clinical laboratory tests. The incidence, severity, and start and end dates of all adverse events were recorded. Adverse events were graded according to the Common Terminology Criteria for Adverse Events (version 4.02).
Patient Population
Patients with advanced or metastatic solid tumors were eligible for enrollment if no standard therapy was available or if a tyrosine kinase inhibitor (if a substrate of ABCB1 and ABCG2) was the standard therapeutic option. Furthermore, patients had to be 18 y of age with the following laboratory values: absolute neutrophil count of at least 1.5 × 10⁹/L, platelet count of at least 75 × 109/L, serum bilirubin no more than 2.0 times the upper limit of normal, aspartate amino transferase and alanine amino transferase levels no more than 2.5 times the upper limit of normal, serum creatinine level no more than 2.0 times the upper limit of normal, and creatinine clearance of at least 40 mL/min. Exclusion criteria were known brain metastases or previous treatment with CNS irradiation, as these could have compromised the function of the BBB. Patients discontinued any medication that induced, inhibited, or was a substrate for ABCB1 or ABCG2 at least 3 plasma elimination half-lives before the first PET scan.
Tracer Preparation and Scanning Procedure
11C-erlotinib was synthesized and prepared as described previously (17). Scans were performed on a Gemini TF-64 PET/CT scanner (Philips), which is a high-performance, time-of-flight, fully 3D PET scanner together with a 16-slice Brilliance CT scanner. PET data were reconstructed using all appropriate corrections applied for normalization, dead time, decay, randoms, scatter, and attenuation. PET data were reconstructed using the 3D row-action maximum-likelihood algorithm with CT-based attenuation correction, at a final voxel size of 4 × 4 × 4 mm and a spatial resolution of 5–7 mm in full width at half maximum. First, a low-dose CT scan (50 mAs, without contrast) was performed for attenuation correction of the subsequent PET data. After the CT scan, 370 MBq of 15O-H2O were injected intravenously, starting a 10-min emission scan in 3D mode. Next, after 10 min to allow for physical decay of 15O, 370 MBq of 11C-erlotinib were injected intravenously, simultaneously starting a 60-min emission scan in 3D mode. The 15O-H2O and 11C-erlotinib emission scans were acquired in list mode and sorted retrospectively into 26 frames (1 × 10, 8 × 5, 4 × 10, 2 × 15, 3 × 20, 2 × 30, and 6 × 60 s) and 36 frames (1 × 10, 8 × 5, 4 × 10, 2 × 15, 3 × 20, 2 × 30, 6 × 60, 4 × 150, 4 × 300, and 2 × 600 s), respectively. No corrections for patient motion or respiratory motion were applied.
All patients received an indwelling radial artery cannula for arterial blood sampling (17). In addition, a venous cannula was inserted for tracer injection and sampling of venous blood. The arterial input function was measured using online continuous blood sampling (at 300 mL/h for the first 5 min and 150 mL/h for the next 15 min) (24). At discrete time points (5, 10, 20, 40, and 60 min after injection), manual samples were obtained for online calibration of the measured whole-blood input function, determination of plasma–to–whole-blood ratios, and measurement of metabolite fractions. Plasma analysis of 11C-erlotinib and polar radioactive metabolites were counted using a Wizard 1480 γ-counter (Perkin Elmer).
PET Data Analysis
To investigate whole-brain uptake, 3D regions of interest (average size, 612 mL) were defined manually around the whole brain, as seen on CT and MRI scans, and projected onto the dynamic PET scan, thereby generating 11C-erlotinib time–activity curves.
Pharmacokinetic modeling was performed using in-house software, developed within the Matlab (The MathWorks Inc.) environment. Data were fitted with single-tissue, 2-tissue reversible, and 2-tissue irreversible metabolite-corrected plasma input models. The optimal plasma input model was determined on the basis of visual analysis of the time–activity curves, the Akaike criteria, and the sensitivity of the kinetic parameters. For the reversible models, the volume of distribution, VT (dimensionless quantity), was used as the outcome parameter describing erlotinib uptake in tissue, as described previously (17,25).
Study Conduct and Registration
All animal experiments were approved by the animal ethics committee of The Netherlands Cancer Institute and were performed according to institutional guidelines and in compliance with Dutch legislation.
The clinical trial was conducted in accordance with the Declaration of Helsinki and approved by the medical ethics review committee of each of the participating medical centers. The trial was registered in the EUdraCT clinical trial database (2014-000281-21) and Netherlands trial registry (NTR4780). All patients provided written informed consent before enrollment.
RESULTS
Preclinical Pharmacology
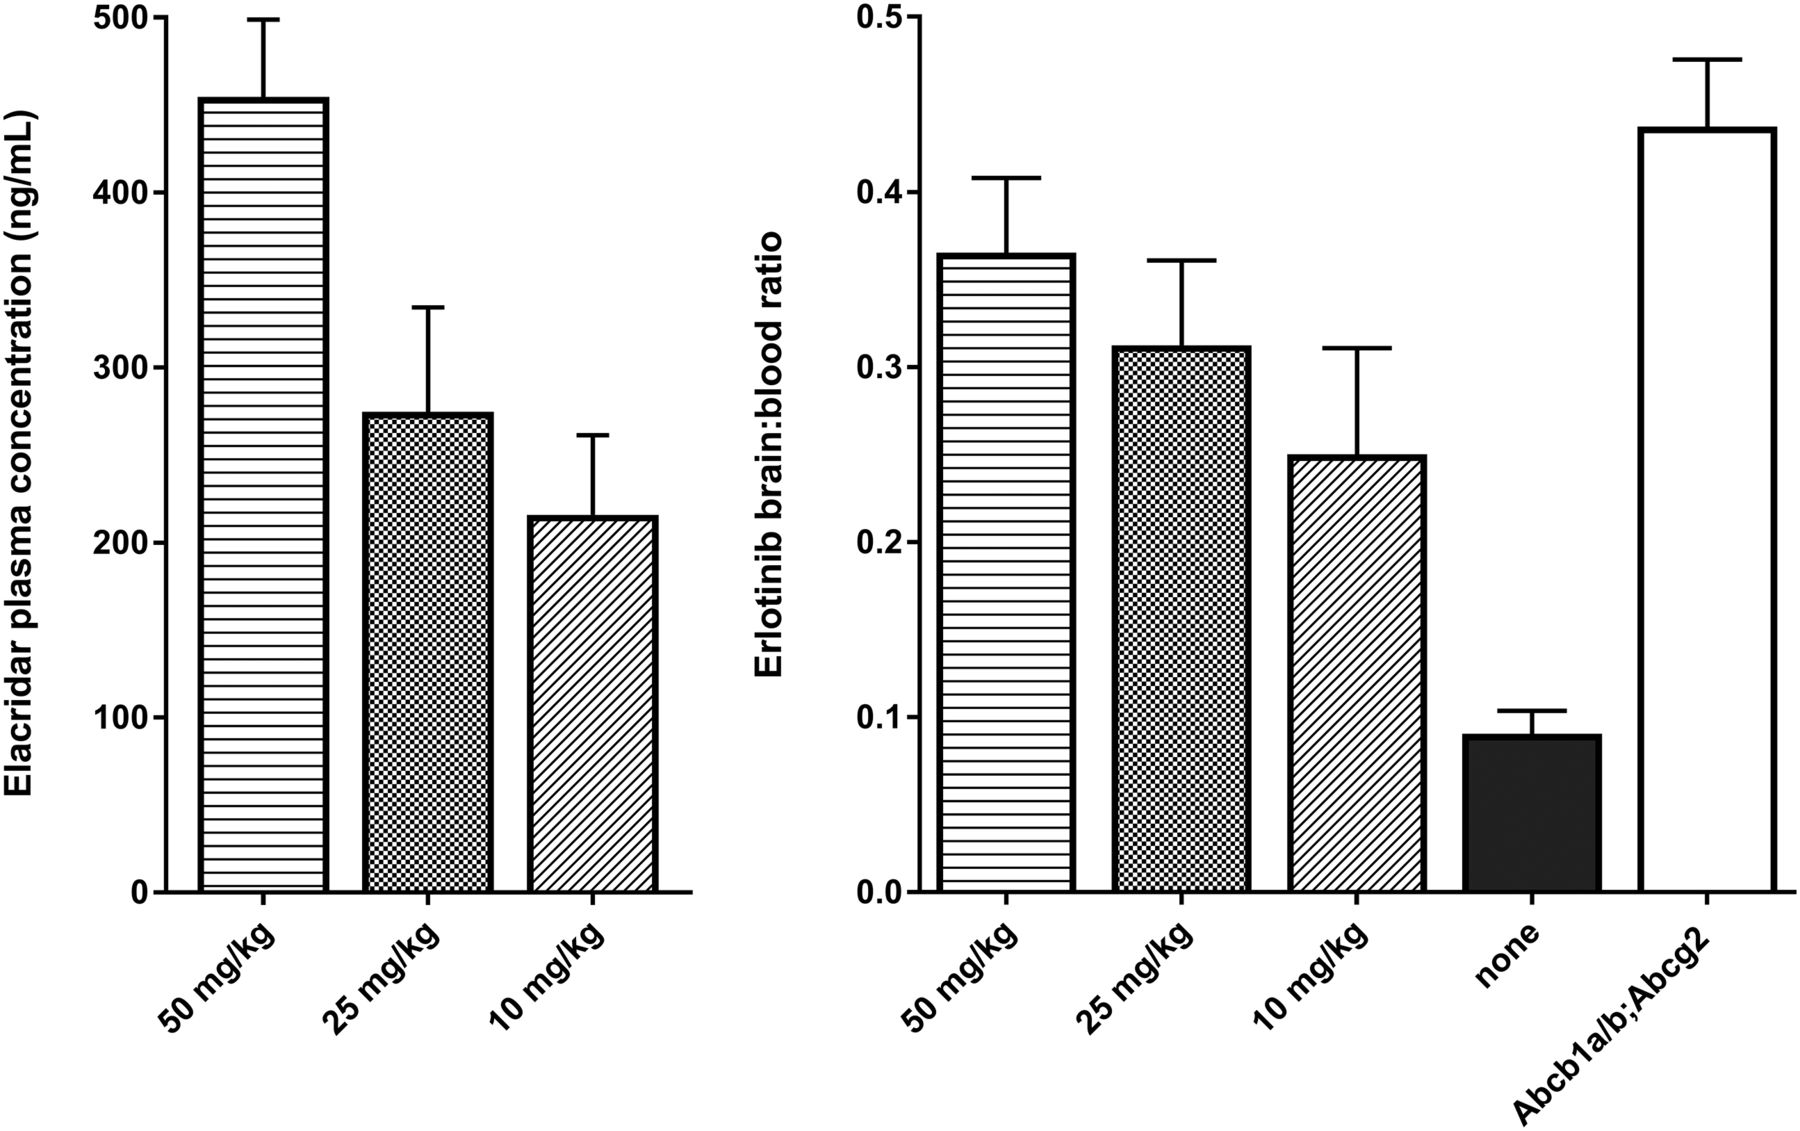
Increasing the dose of elacridar resulted in an increased elacridar plasma concentration (Fig. 2, left panel). At 4 h after dosing, the plasma elacridar concentrations were 216 ± 46, 275 ± 60, and 455 ± 44 ng/mL for the 10, 25, and 50 mg/kg dose, respectively. The erlotinib plasma concentration was 1,020 ± 350 in WT mice receiving elacridar vehicle and 2,610 ± 710, 2,610 ± 290, and 1,900 ± 830 ng/mL at the 10, 25, and 50 mg/kg elacridar dose. The erlotinib plasma concentration in knockout mice was 1,700 ± 120 ng/mL.

(Left) Elacridar plasma concentrations in ng/mL for increasing oral dose of elacridar (0, 10, 25, and 50 mg/kg). (Right) Erlotinib brain-to-plasma ratios at same increasing doses of elacridar in WT mice (n = 4). Group of Abcb1a/b;Abcg2 knockout mice was used as positive controls (n = 5).
Erlotinib brain-to-plasma ratios were 0.25 ± 0.06, 0.31 ± 0.05, and 0.37 ± 0.04 for the increasing doses of elacridar (Fig. 2, right panel). The ratio for untreated WT mice was 0.09 ± 0.01. Each dose was a significantly higher ratio than vehicle (P < 0.002 for each dose, independent-sample t tests). The Abcb1a/b;Abcg2 knockout mice had a brain-to-plasma ratio of 0.45 ± 0.02.
Preclinical Imaging
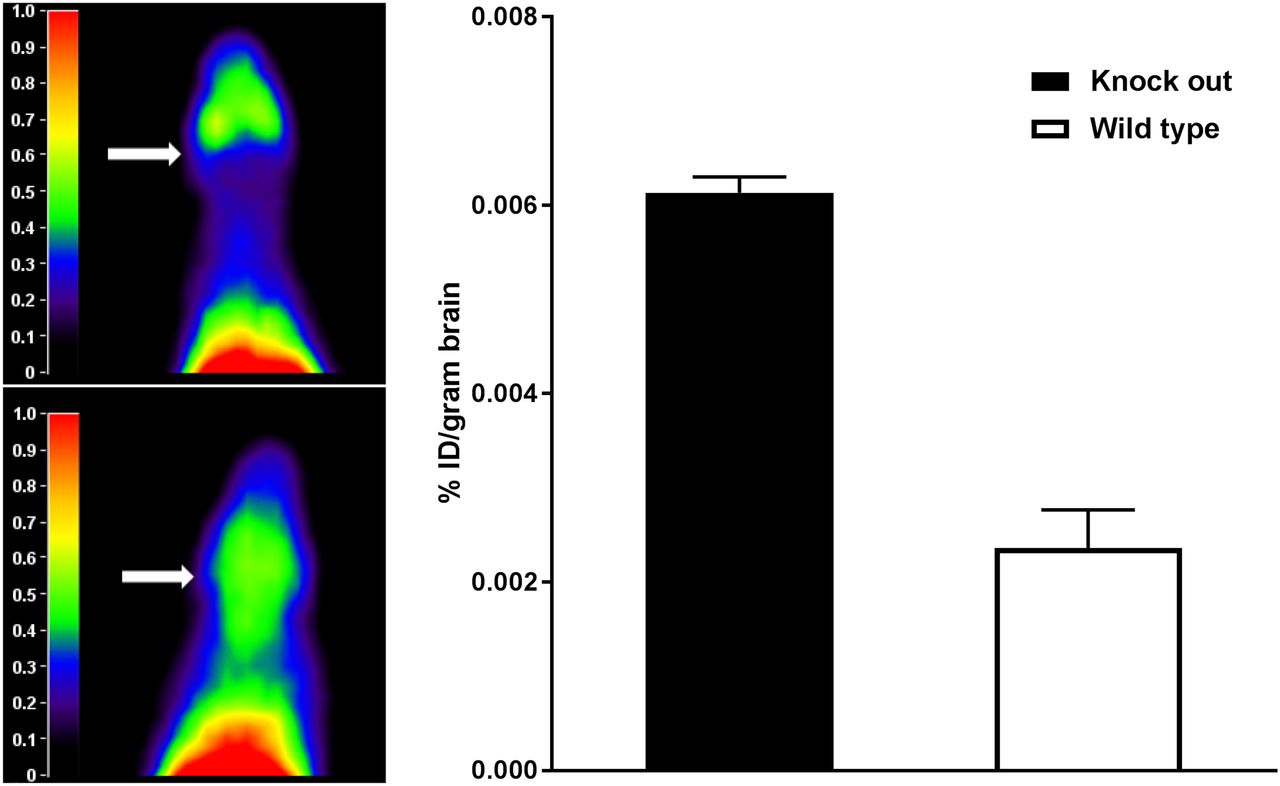
Representative summed images of a WT and a Abcb1a/b;Abcg2 knockout mouse are shown in Figure 3, left panel. 11C-erlotinib PET scans showed increased cerebral uptake in knockout mice compared with WT mice. The 11C-erlotinib percentage injected dose per gram of brain tissue was determined ex vivo in knockout and WT mice. 11C-erlotinib brain uptake was increased 2.6-fold in the knockout mice compared with the WT mice (P = 0.01, independent-sample t test), as shown in Figure 3, right panel.

(Left) Representative summation images of Abcb1a/b;Abcg2 knockout mouse (bottom) and WT mouse (top). Arrows indicate brain. (Right) 11C-erlotinib percentage injected dose (%ID) per gram of brain determined ex vivo in knockout and WT mice. Erlotinib brain penetration was significantly higher in knockout mice (n = 2 per group).
Clinical Trial Results
From September 2014 to March 2015, 7 patients gave written informed consent to participate. One patient dropped out before the first administration of 11C-erlotinib because of unsuccessful placement of the arterial catheter. The 6 remaining patients all underwent the entire protocol. Because of problems with the arterial sampling, no input function was available for one patient and the peak uptake was missed in the first scan of another patient. PET data from the remaining 4 patients were available for evaluation, in both scans. After analysis of the data of these patients, enrollment was terminated because of lack of effect.
The evaluable patients were all male, had a mean (±SD) age of 57 ± 8 y, and weighed 81 ± 14 kg. Four patients had a gastrointestinal stromal tumor and one had advanced colorectal cancer. In the patients with gastrointestinal stromal tumor, imatinib treatment was interrupted 3 d before inclusion and restarted after the trial. The colorectal cancer patient did not receive active treatment. All patients had undergone gastrointestinal surgery before enrollment.
None of the patients experienced adverse events related to the tracer dose of erlotinib. Two patients experienced adverse events related to elacridar. These were both grade 1 and included headache and taste alteration. No new safety signals were observed compared with previous trials with elacridar (26–28). Other adverse events observed from the moment informed consent was given until the last follow-up visits, considered to be unrelated to elacridar, included hypertension (grade 3), syncope (grade 3), dyspepsia, anxiety, nausea, and sneezing (all grade 1).
Clinical Imaging
Averaged 11C-erlotinib PET images (5–60 min, corrected for 11C-erlotinib dose) before and after a 1,000-mg dose of elacridar for the subject with the largest increase in VT are shown in Figure 4. 11C-erlotinib activity was markedly lower in the brain than in the surrounding tissues. The 11C-erlotinib dose did not significantly differ between the first and second scans, at 363 ± 37 versus 333 ± 55 MBq (P = 0.28, paired-sample t test). Moreover, no differences were observed in specific activity before (55.68 GBq/μmol) and after elacridar (50.65 GBq/μmol), resulting in comparable erlotinib doses of 2.54 and 2.61 μg, respectively.

11C-erlotinib PET before (top) and after (bottom) elacridar for subject 4.
The optimal plasma input model for fitting 11C-erlotinib data in the brain is the single-tissue model (89% preference) followed by the 2-tissue reversible model (11%), according to the Akaike criterion. Kinetic parameters for the single-tissue model are given in Table 1, and all of the following analyses were performed using this model. However, the fitted VT was highly correlated between the single- and 2-tissue reversible model (r2 = 0.9979). The VT of 11C-erlotinib did not increase after administration of elacridar (0.213 ± 0.123 vs. 0.205 ± 0.071; P = 0.91, paired-sample t test). 11C-erlotinib whole-brain activity curves as SUV versus time for patients before and after a 1,000-mg dose of elacridar are shown in Figure 5. The metabolism of erlotinib was unaffected by elacridar. The curves for the percentage parent erlotinib versus time during the scan before and after the elacridar dose are provided in Supplemental Figure 1 (supplemental materials are available at http://jnm.snmjournals.org).
K1, K2, and VT of Brain 11C-Erlotinib Before and After Elacridar Administration in Cancer Patients (n = 5)
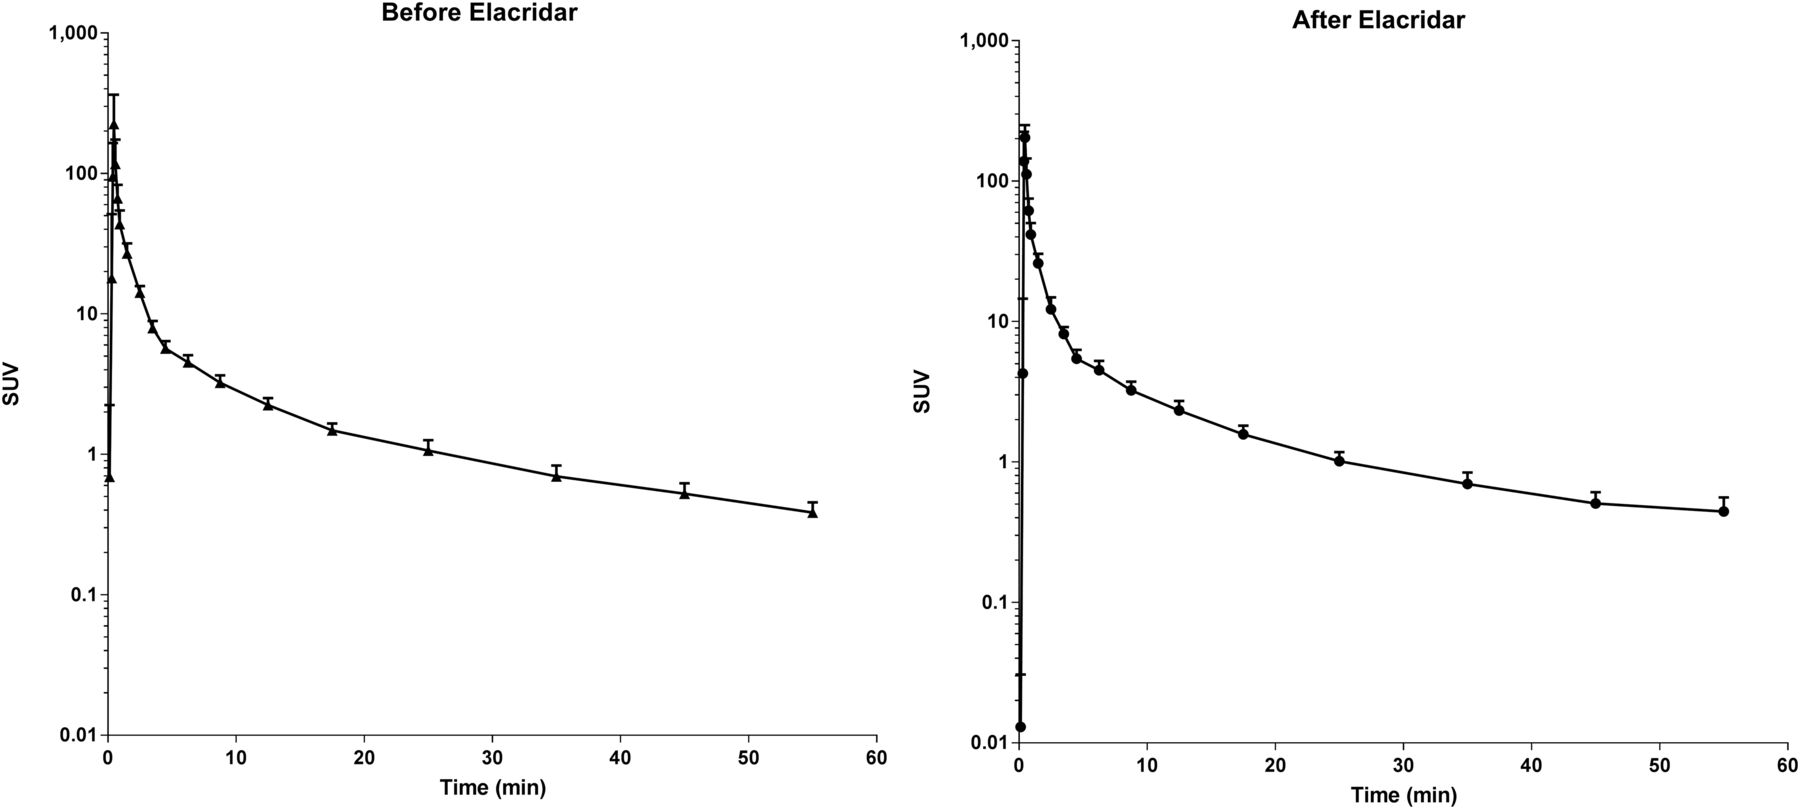
11C-erlotinib whole-brain activity as SUV vs. time (in minutes) for patients before and after administration of elacridar (n = 5).
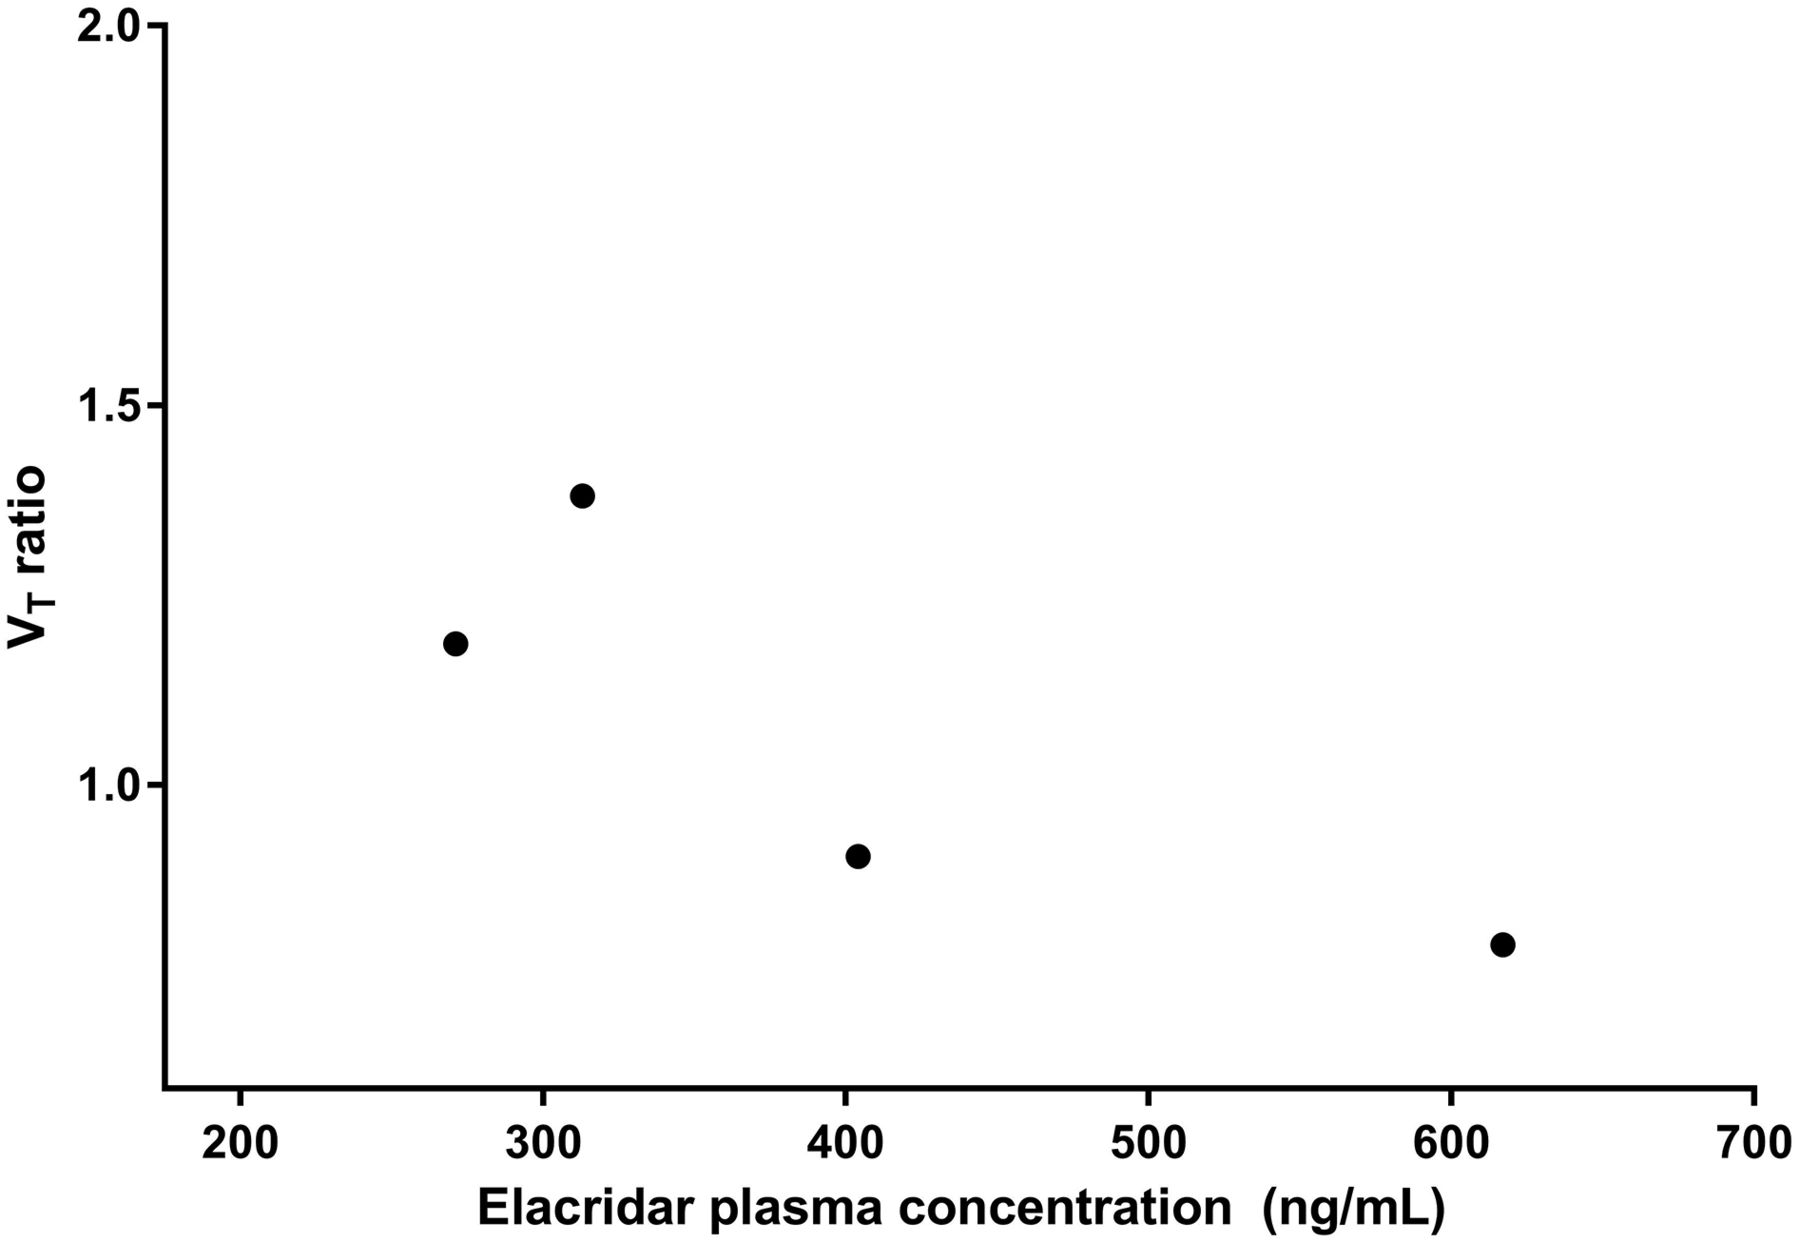
Cerebral blood flow was unaffected by administration of elacridar: 15O-H2O K1 was 0.48 ± 0.10 before and 0.44 ± 0.13 after the 1,000-mg dose of elacridar (P = 0.21, paired-sample t test). For patients evaluable in both scans, mean elacridar plasma concentrations on the day of the PET scan (the averages of the samples at the start and end of the scan) were 401 ± 154 ng/mL. The ratio of VT (after and before elacridar) versus elacridar plasma concentration is plotted in Figure 6. No increase in VT ratio with higher elacridar plasma concentration was found over the 271–619 ng/mL range.

11C-erlotinib brain VT ratio vs. elacridar exposure (n = 5).
DISCUSSION
It was hypothesized that inhibition of ABCB1 and ABCG2 by elacridar should result in increased erlotinib brain exposure in mice and in humans. In mice, we showed increased brain uptake at both a pharmacologic (Fig. 2) and a tracer (Fig. 3) erlotinib dose, in accordance with previous studies on mice and nonhuman primates (8,12,29). However, these preclinical data could not be reproduced in humans (Table 1; Figs. 4 and 5).
To our knowledge, this was the first study performed on human brain using 11C-erlotinb with dynamic images in combination with metabolite-corrected plasma input function. The optimal pharmacokinetic model for use in the brain was the single-tissue-compartment model, according to the Akaike criterion. However, the differences in the estimated VT between the 2-tissue-compartment model and the single-tissue-compartment model were small. Furthermore, it is expected that the 2-tissue model will perform better for regions with higher specific uptake. However, as uptake is expected to be low in patients without lesions in the brain, the single-tissue model is the preferred model to be used with 11C-erlotinib in this setting.
Previously the test–retest variability for 11C-erlotinib VT in tumor lesions was quantified at 12%. Variability in VT was relatively higher in this study than in previous trials (17,25), probably because the VT (<0.5) values for erlotinib VT in the brain were lower than in previously explored tumor images.
In patients, no effect of ABCB1 or ABCG2 inhibition on VT and no relationship between erlotinib VT ratio and elacridar exposure were seen, even though plasma concentrations of as high as 600 ng/mL were measured (Fig. 6). This finding could be due to several factors: insufficient elacridar exposure, nonlinear pharmacokinetics of erlotinib, or interspecies differences in the BBB.
Low free plasma concentrations of the inhibitor and nonlinearity of transporter inhibition could be suggested as possible explanations for the lack of effect (30). It is unlikely that this possibility applies to the combination of elacridar and erlotinib. Previously, Kuntner et al. performed a dose-finding study of elacridar using 11C-verapamil imaging as readout (31). Elacridar was found to increase brain uptake at concentrations at or above 200 ng/mL. Similarly, our preclinical data show an increased erlotinib brain exposure at elacridar plasma concentrations of 200–400 ng/mL (Fig. 2), and the plasma levels of elacridar in our clinical trial were similar, if not higher. Moreover, no trend toward an increasing VT ratio with increasing elacridar concentration was seen over the 94–619 ng/mL range. A species difference in free drug concentrations is also unlikely because protein binding of erlotinib and its major metabolite desmethyl erlotinib is similar in mice and humans (95% vs. 92% for erlotinib and 73% vs. 90% for desmethyl erlotinib) (32).
This seems to eliminate limited elacridar exposure as an explanation for the lack of increased brain exposure in the clinical study. Yet, inhibition by elacridar resulted in a 3.5-fold increase in 11C-erlotinib brain VT in primates (29). However, these results were achieved at an extremely high elacridar plasma concentration of maximally 10.0 ± 1.5 μg/mL, using an intravenous infusion. Although it is possible that such high elacridar levels in humans may also cause a better brain uptake of erlotinib, these levels will be hard to achieve via oral dosing given the unbeneficial pharmaceutical properties of elacridar. The concentrations observed in the current trial (401 ± 154 ng/mL, Fig. 6) were already higher than most of the peak serum concentrations in previous clinical trials (140–434 ng/mL) (22,26–28,33).
This clinical study used a tracer dose of erlotinib. Therefore, nonlinear pharmacokinetics of erlotinib could be an explanation for the absence of an effect on VT (as it could be argued that a higher dose of erlotinib would have shown an increase in brain uptake). However, given the fact that we showed increased brain uptake at both a pharmacologic (Fig. 2) and a tracer (Fig. 3) dose of erlotinib in preclinical studies, this explanation is unlikely.
Although a previous study of 11C-erlotinib on mice (8) suggested that erlotinib pharmacokinetics were nonlinear and that erlotinib itself may be an inhibitor of ABCB1 and ABCG2, inhibition of these transporters by erlotinib is unlikely at tracer doses and probably also at pharmacologic doses. This possibility also conflicts with our preclinical experiments and with clinical observations that erlotinib cerebral spinal fluid concentrations are markedly lower than levels in plasma (10,11).
A high dose of erlotinib did result in an increased erlotinib brain VT in primates, but this effect was markedly smaller than that of elacridar (only a 1.7-fold increase compared with 3.5-fold). In a previous clinical 11C-erlotinib study, addition of cold erlotinib resulted in markedly lower VT in tumor lesions of cancer patients (18), supporting the choice not to add a pharmacologic erlotinib dose in this trial.
The above leave interspecies differences as the most likely explanation for the discrepancy between the preclinical and clinical results. First, interspecies differences in drug transporter efficiency have been shown for various substrates even when corrected for protein expression levels (34). Second, Uchida et al. quantified absolute protein levels of ABCB1 and ABCG2 in mice and human brain tissue (35). ABCG2 expression was found to be 1.8-fold higher and ABCB1 expression was 2.33-fold lower in humans than in mice. If ABCG2 is thus more prominent in the human BBB or if human ABCG2 is an efficient transporter of erlotinib, insufficient inhibition of ABCG2 could explain the lack of effect. This hypothesis is supported by reports suggesting that elacridar inhibits ABCB1 at 50–100 nM but that 250 nM is required for inhibition of ABCG2 (6,7), albeit it is likely that the inhibitory potency will be different for each substrate.
Third, ABCG2 is known to compensate for ABCB1 inhibition for double substrates (35), as has also been shown for erlotinib in preclinical experiments (12). Here, the largest gain in the erlotinib brain accumulation was seen when ABCB1 was absent, with only a moderate further increase when both ABCB1 and ABCG2 were absent. Therefore, the increase of erlotinib in mice that occurs with elacridar is caused predominantly by the inhibition of ABCB1 by elacridar. This finding is also in line with human studies using 11C-verapamil (a substrate for ABCB1 but not ABCG2 (36,37)) showing statistically significant, albeit small, increases in brain uptake in ABCB1 and ABCG2 inhibition. Besides species differences in substrate affinities and transporter expression, other unknown factors may contribute to the observed differences. However, on the basis of these observations, we advise that future clinical trials aiming to increase brain exposure by administration of elacridar should try to avoid using strong ABCG2 substrates and focus primarily on ABCB1 or weak ABCG2 substrates.
CONCLUSION
To our knowledge, this was the first study investigating the effect of BBB transporter inhibition on 11C-erlotinib in the clinical setting. No increased brain VT was found in patients treated with elacridar. The more pronounced role that ABCG2 appears to play at the human BBB and the lower potency of elacridar to inhibit ABCG2 may be an explanation fpr these interspecies differences.
DISCLOSURE
This research was funded by a personal grant from the Netherlands Cancer Institute to Neeltje Steeghs. Olaf van Tellingen is coinventor on a patent application (Bunt and Van Tellingen, 2014; US 20140235631A1) dealing with development of an improved oral formulation for elacridar. No other potential conflict of interest relevant to this article was reported.
Acknowledgments
We thank all patients for their participation in the clinical trial.
Footnotes
Published online Nov. 24, 2017.
- © 2018 by the Society of Nuclear Medicine and Molecular Imaging.
REFERENCES
- Received for publication May 23, 2017.
- Accepted for publication November 10, 2017.


