


Abstract
Because a correlation between tau pathology and the clinical symptoms of Alzheimer disease (AD) has been hypothesized, there is increasing interest in developing PET tracers that bind specifically to tau protein. The aim of this study was to evaluate tracer kinetic models for quantitative analysis and generation of parametric images for the novel tau ligand (S)-18F-THK5117. Methods: Nine subjects (5 with AD, 4 with mild cognitive impairment) received a 90-min dynamic (S)-18F-THK5117 PET scan. Arterial blood was sampled for measurement of blood radioactivity and metabolite analysis. Volume-of-interest (VOI)–based analysis was performed using plasma-input models; single-tissue and 2-tissue (2TCM) compartment models and plasma-input Logan and reference tissue models; and simplified reference tissue model (SRTM), reference Logan, and SUV ratio (SUVr). Cerebellum gray matter was used as the reference region. Voxel-level analysis was performed using basis function implementations of SRTM, reference Logan, and SUVr. Regionally averaged voxel values were compared with VOI-based values from the optimal reference tissue model, and simulations were made to assess accuracy and precision. In addition to 90 min, initial 40- and 60-min data were analyzed. Results: Plasma-input Logan distribution volume ratio (DVR)-1 values agreed well with 2TCM DVR-1 values (R2 = 0.99, slope = 0.96). SRTM binding potential (BPND) and reference Logan DVR-1 values were highly correlated with plasma-input Logan DVR-1 (R2 = 1.00, slope ≈ 1.00) whereas SUVr70–90-1 values correlated less well and overestimated binding. Agreement between parametric methods and SRTM was best for reference Logan (R2 = 0.99, slope = 1.03). SUVr70–90-1 values were almost 3 times higher than BPND values in white matter and 1.5 times higher in gray matter. Simulations showed poorer accuracy and precision for SUVr70–90-1 values than for the other reference methods. SRTM BPND and reference Logan DVR-1 values were not affected by a shorter scan duration of 60 min. Conclusion: SRTM BPND and reference Logan DVR-1 values were highly correlated with plasma-input Logan DVR-1 values. VOI-based data analyses indicated robust results for scan durations of 60 min. Reference Logan generated quantitative (S)-18F-THK5117 DVR-1 parametric images with the greatest accuracy and precision and with a much lower white-matter signal than seen with SUVr70–90-1 images.
Alzheimer disease (AD) is the most common of the neurodegenerative disorders. It is characterized by a cascade of complex pathophysiologic processes including deposition of amyloid plaques, accumulation of neurofibrillary tangles, and neurodegeneration. The rapid development of molecular and structural imaging has provided valuable biomarkers for early detection and diagnosis of AD. The tracer 11C-Pittsburgh compound B (11C-PIB) (1), which binds to fibrillar amyloid (2), was initially introduced for imaging the amyloid plaque load in vivo and followed by development of several other amyloid tracers. Three of these, 18F-flutemetamol, 18F-florbetaben, and 18F-florbetapir, have recently been approved for assessing the presence of β-amyloid in a clinical setting. Access to these imaging methods allowed for more accurate and increasingly early diagnosis of AD and led to the proposal of new diagnostic criteria (3,4). The presence of β-amyloid in patients with mild cognitive impairment (MCI) suggests the presence of prodromal AD.
However, amyloid pathology, as imaged with PET, appeared not to correlate with the clinical symptoms of AD (5), because amyloid pathology plateaus quite quickly in the disease progression (6). It is important to increase the understanding of the connections between the pathologic processes and the clinical symptoms of AD and to develop biomarkers that will provide accurate information on disease progression. Because tau pathology is closely associated with neurodegeneration and cognitive impairment (7), there is increasing interest in the development of PET tracers that bind specifically to tau. The importance of reliable and early diagnosis in dementia cannot be overstated, and quantitative imaging that correlates disease progression with the presence of a suitable biomarker, such as tau, is needed.
Several tau tracers have recently been developed and are currently undergoing clinical assessment in AD patients, non-AD patients, and controls (7–10). 18F-THK5117 is a promising candidate in a series of tau tracers recently developed by Okamura et al. at Tohoku University, Sendai, Japan. It has been shown to have good affinity for tau protein aggregates, with fast uptake and clearance and no toxic effects (11). Because 18F-THK5117 is a racemic tracer, any differences in metabolism and kinetics between the S- and R-enantiomers would complicate quantification. Accurate assessment of tau expression thus requires an enantiomerically pure tracer, and (S)-18F-THK5117 was therefore used in this study.
The aim of the study was to evaluate several tracer kinetic models for quantitative analysis of (S)-18F-THK5117 binding to tau, based on plasma and reference tissue input data, and to validate methods to construct parametric images of tau pathology. The feasibility of using simplified methods of quantification, such as the SUV ratio (SUVr), was assessed by comparison with binding measures based on tracer kinetic analysis.
MATERIALS AND METHODS
Subjects
Nine subjects (5 AD patients and 4 MCI patients) were included in the study. Patient characteristics are shown in Table 1. The patients were recruited from the Memory Clinic, Karolinska University Hospital Huddinge. All AD patients fulfilled the new diagnostic criteria for AD (3), and the MCI patients fulfilled the Petersen criteria (12,13). Presence of β-amyloid was assessed using an 11C-PIB PET scan at most 1 wk before the (S)-18F-THK5117 scan. 11C-PIB scans were rated as positive if the average neocortical 11C-PIB retention was higher than 1.41 (14). All MCI patients were of the amnestic type. Each subject gave their written informed consent before inclusion, and the study was approved by the Regional Board of Medical Ethics in Stockholm (EPN 2014/268-31/4) and the Medical Radiation Ethics Committee at Uppsala University Hospital.
Patient Characteristics
Scanning Procedure
The radiosynthesis of (S)-18F-THK5117 is described in the supplemental material (available at http://jnm.snmjournals.org). All (S)-18F-THK5117 PET scans were obtained on an ECAT Exact HR+ (Siemens) stand-alone PET scanner. After a 10-min transmission scan with rotating 68Ge rod sources, (S)-18F-THK5117 (3 MBq/kg) was administered as a fast bolus, simultaneously with the start of a 90-min dynamic PET acquisition (6 × 10, 3 × 20, 2 × 30, 2 × 60, 2 × 150, 4 × 300, and 6 × 600 s). Images were reconstructed using normalization- and attenuation-weighted ordered-subset expectation maximization (6 iterations, 8 subsets) applying all appropriate corrections and a 4-mm Hanning postprocessing filter. In addition, all patients underwent a T1-weighted MRI scan, which was used for segmentation and volume-of-interest (VOI) definition. The AD patients and MCI patients underwent MRI scans on a Magnetom Symphony 1.5-T (Siemens; n = 2 and 1, respectively), Magnetom Trio 3-T (Siemens; n = 2 and 1, respectively), or Achieva 1.5-T (Philips; n = 1 and 2, respectively) scanner. The dynamic PET data were realigned to correct for interframe patient movement using Voiager software (GE Healthcare).
Blood Sampling and Metabolite Analysis
All subjects underwent online arterial blood sampling during the first 10 min of the scan (3 mL/min), using a radial artery cannula. Discrete blood samples (5 mL) were also taken at 5, 10, 15, 20, 30, 45, 60, 75, and 90 min after injection for measurement of whole-blood and plasma radioactivity and for metabolite analysis. The percentage of intact (S)-18F-THK5117 in plasma was then determined as described in the supplemental data. The arterial input function was obtained by multiplying the measured whole-blood data by a single exponential fit to plasma–to–whole-blood ratios and a sigmoid fit to the measured fraction of intact (S)-18F-THK5117 in plasma.
Tracer Kinetic Analysis
The T1-weighted MR images were segmented and coregistered to the PET images using SPM8 (Wellcome Trust Centre for Neuroimaging). Gray-matter VOIs, as well as a total-white-matter VOI, were defined on the MR images using an automatic probabilistic atlas (PVElab) (15) and projected over all frames of the dynamic PET scans, resulting in time–activity curves. Left- and right-side VOIs were averaged, and 11 VOIs were included in the data analysis: thalamus, putamen, hippocampus, amygdala, parietal cortex, frontal cortex, sensory motor cortex, occipital cortex, midbrain, entorhinal cortex, and temporal cortex. A cerebellum gray-matter VOI was used as the reference region.
Single-tissue (1TCM) and 2-tissue (2TCM) reversible plasma-input compartment models with blood volume as an additional fit parameter were applied to all time–activity curves using nonlinear regression (in-house–developed software in Matlab; The MathWorks). Binding potentials (BPND) were calculated both directly and indirectly as the ratio of the volumes of distribution in the target and reference regions minus 1 (DVR-1). The optimal plasma-input model was determined using Akaike (16) and Schwarz (17) criteria. In addition, DVR-1 was determined using plasma-input Logan (18) and reference Logan (19) on a time interval of 30–90 min. Reference Logan was calculated both with and without the efflux constant, k2, in the model, with k2 based on plasma-input Logan (19). BPND was calculated using the simplified reference tissue model (SRTM) (20), and SUVr was calculated as the ratio of the radioactivity concentrations in each VOI relative to cerebellum gray matter over the 70- to 90-min interval (SUVr70–90). Reference tissue methods were validated by comparison of BPND, DVR-1, or SUVr70–90-1 values, with DVR-1 values based on the optimal plasma-input compartment model and plasma-input Logan analyses using orthogonal regression, and by calculating the square of the correlation coefficient (R2).
Parametric Images
Voxel-level analyses were performed using a basis function implementation of SRTM (receptor parametric mapping [RPM]) (21) and of the 2-parameter version of SRTM (RPM2) (22). One hundred basis functions were predefined for each scan, with discrete values for the exponential variable ranging from 0.005 to 0.5 min−1. Reference Logan DVR-1 was also estimated on a voxel level at a time interval of 30–90 min, and SUVr70–90-1 images were calculated for the last 2 frames, 70–90 min, for each scan.
Each parametric method was quantitatively evaluated by retrieving regionally averaged voxel values from the generated BPND, DVR-1, and SUVr70–90-1 images by projecting the 11 VOIs onto the parametric images. Regionally averaged BPND, DVR-1, and SUVr70–90-1 values from the parametric images were compared with VOI-based values from the optimal reference model using orthogonal regression and by calculating R2.
Simulations
Simulations of the models were performed for assessment of accuracy and precision of BPND, DVR-1, and SUVr-1 estimates. Simulated target and reference time–activity curves were created using 2TCM with a plasma input function from 1 typical subject. The kinetic parameters and the blood volume fraction (Vb) were based on typical parameters from the clinical data. For the reference time–activity curve, they were set to K1′ = 0.43, k2′ = 0.13, k3′ = 0.02, k4′ = 0.075, and Vb = 0.06. Two sets of parameters were used for the target time–activity curve, with different k3 values to reflect high and low tau binding: K1 = 0.33, k2 = 0.09, k3 = 0.04 or 0.016, k4 = 0.05, and Vb = 0.06. The 2 k3 values correspond to BPND values of 0.8 and 0.32, respectively. One hundred time–activity curves were generated for each set of parameters, and random noise was added at a level of 2% to resemble the typical noise in cerebellum and temporal cortex VOI time–activity curves. Bias and coefficient of variation (COV) were calculated for DVR-1 values from 2TCM, plasma-input Logan and reference Logan and for BPND values from SRTM and RPM as well as SUVr70–90-1 values.
Scan Duration
In addition to the 90-min scan data, shortened datasets were also evaluated. The initial 40-min (20 frames) and 60-min (22 frames) data were extracted from the dynamic (S)-18F-THK5117 scans and analyzed using both plasma input and reference tissue models. Plasma-input Logan and reference Logan were performed at a time interval of 20–40 min and 30–60 min, and SUVr-1 were calculated for 20–40 min and 40–60 min. Absolute bias was calculated between BPND, DVR-1, and SUVr-1 values of the shorter scan durations and the 90-min scan.
RESULTS
Radiosynthesis
(S)-18F-THK5117 was obtained in a sterile solution ready for injection containing 4.6 ± 2.7 GBq. The product had a specific activity of 212 ± 120 GBq/μmol at the end of synthesis, the radiochemical purity was 98.3% ± 0.9%, and the enantiomeric purity was greater than 98%. The injection solution of (S)-18F-THK5117 was free from chemical impurities, with no sign of precursor or deprotected precursor.
Blood Sampling and Metabolite Analysis
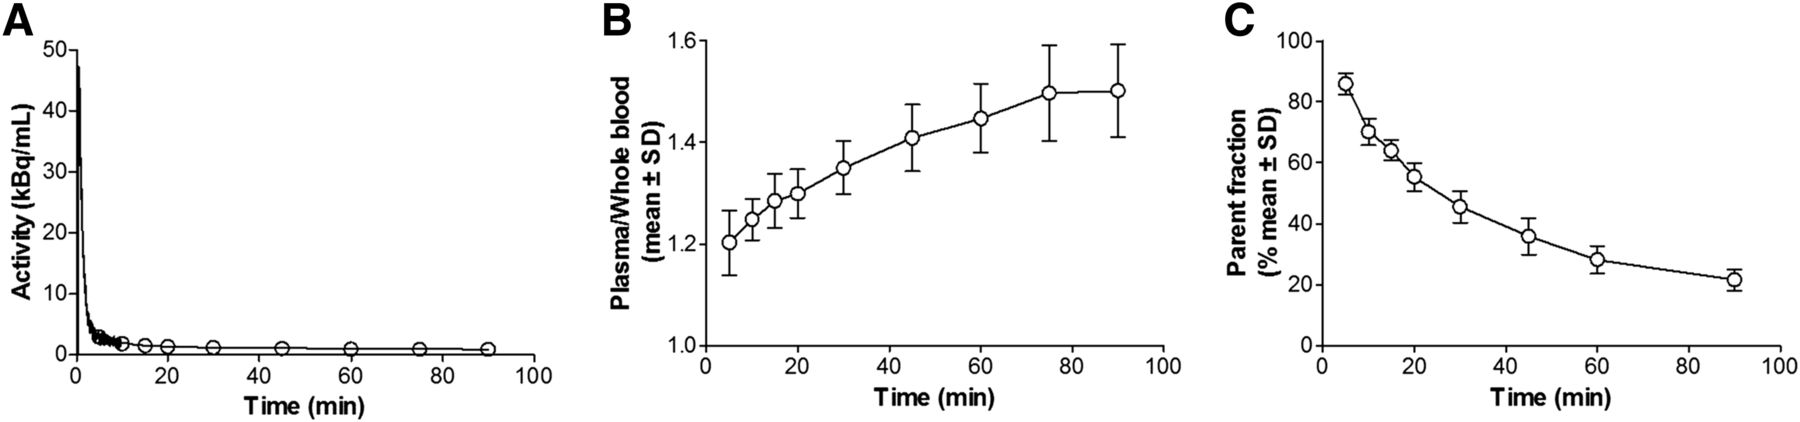
Figure 1 shows a typical whole-blood time–activity curve from 1 AD subject and mean plasma–to–whole-blood ratios and mean fraction of intact tracer for all 9 subjects. The plasma–to–whole-blood ratio increased from 1.2 to 1.5 during the course of the scan. The parent fraction decreased to approximately 25% at 90 min after injection, with limited variation among individuals.

(A) Typical whole-blood activity curve from 1 AD patient. (B) Plasma–to–whole-blood ratio (mean ± SD) for all 9 subjects. (C) Fraction of unmetabolized (S)-18F-THK5117 (mean ± SD) for all 9 subjects.
Tracer Kinetic Analysis
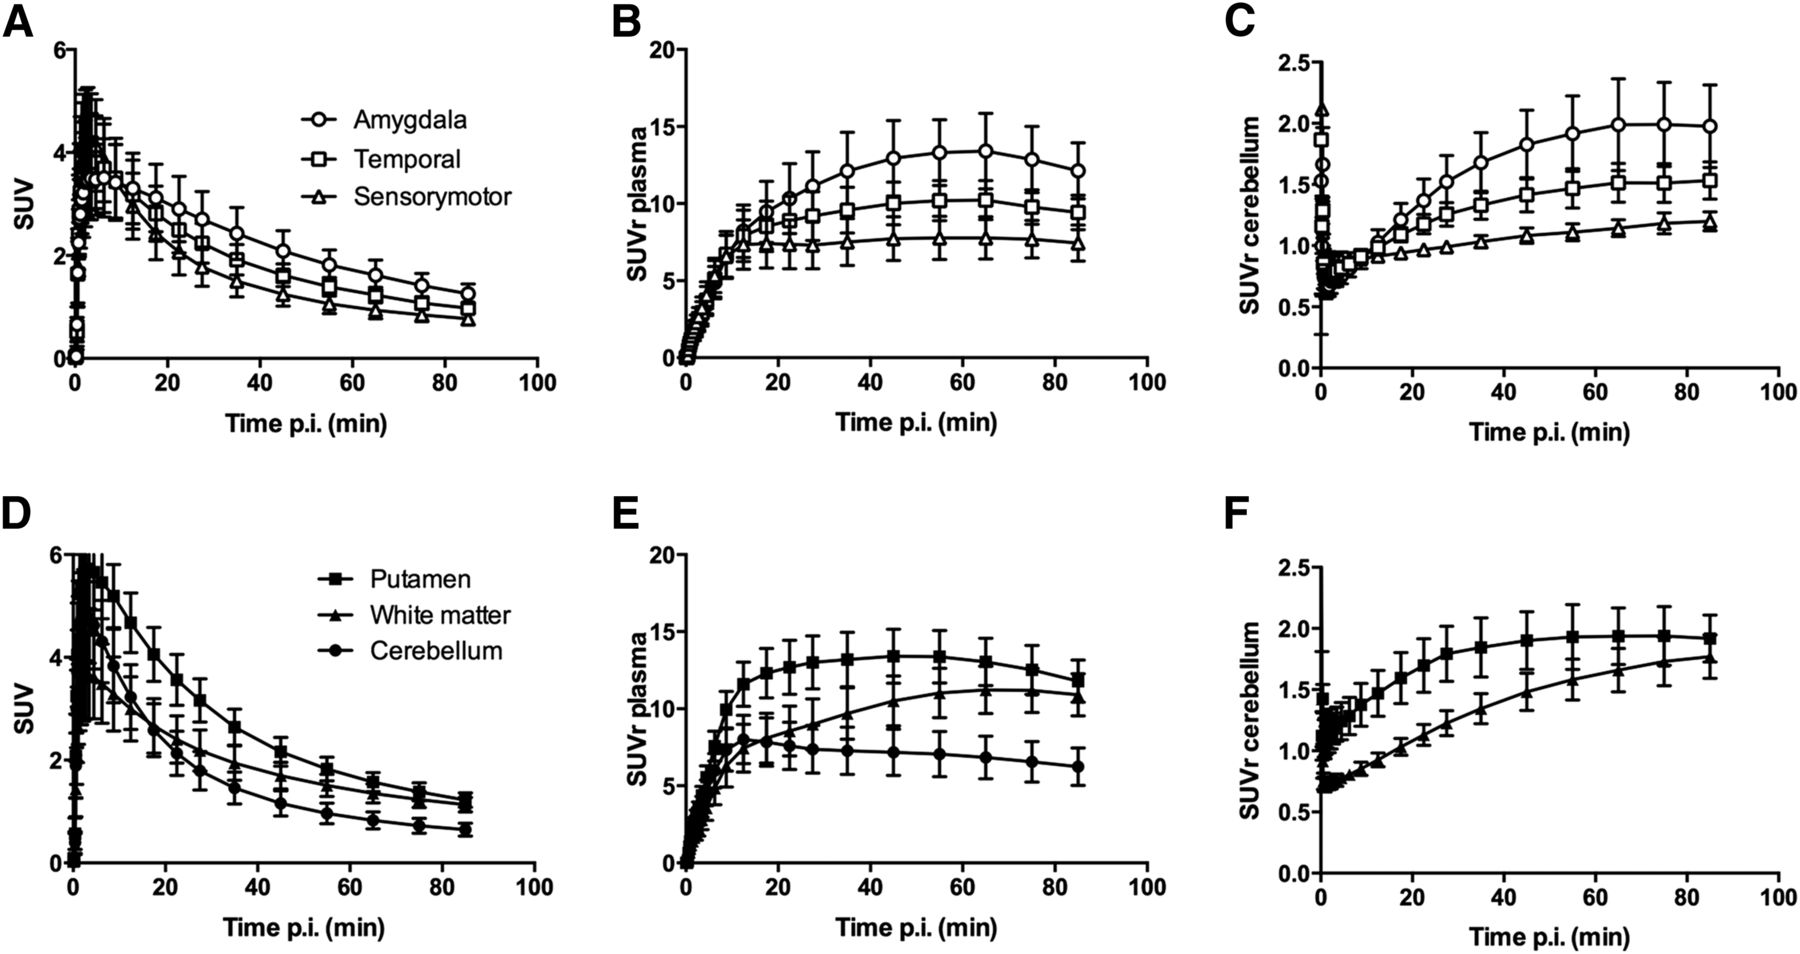
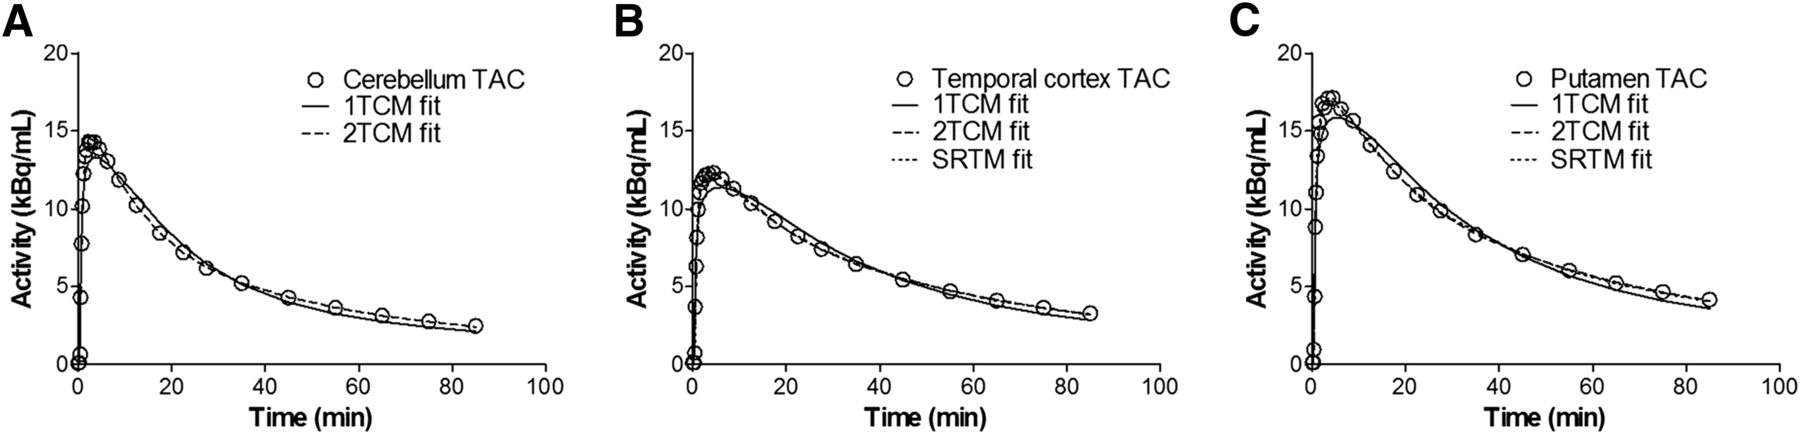
Figure 2 shows mean AD tissue time–activity curves (SUV vs. time), tissue–to–unmetabolized tracer in plasma ratio, and tissue-to-cerebellum ratio over time for the typical high-, intermediate-, and low-binding VOIs amygdala, temporal cortex, and sensory motor cortex, as well as for the cerebellum, putamen, and white matter. Cortical time–activity curves can be clustered into 4 different groups in terms of their shape: high binding in amygdala; intermediate binding in temporal, frontal, entorhinal, and cingulate cortex; low intermediate binding in parietal and occipital cortex; and low binding in sensory motor cortex. Midbrain time–activity curves behave similarly to the intermediate-binding cortical regions. Typical time–activity curves for the cerebellum, temporal cortex, and putamen from 1 AD patient are given in Figure 3, with fits of 1TCM and 2TCM for all 3 brain regions and SRTM for the temporal cortex and putamen. The 2TCM and SRTM were able to fit the data well whereas the 1TCM in general showed poor fits to the data. Both Akaike and Schwarz criteria gave preference to the 2TCM over the 1TCM in all cases except for the amygdala time–activity curves from 2 subjects. However, it was not possible to directly determine BPND with any robustness from 2TCM; the standard errors frequently exceeded 25% of the BPND value itself.

Time–activity curves (A and D), tissue–to–unmetabolized (S)-18F-THK5117 in plasma ratio (B and E), and tissue-to-cerebellum ratio (C and F) in regions with high, intermediate, and low tau binding (A–C) as well as cerebellum, putamen, and white matter (D–F). Mean for all 5 AD subjects. p.i. = after injection.

Typical time–activity curves (TACs) for cerebellum (A), temporal cortex (B), and putamen (C), from 1 AD patient, with fits of 1TCM, 2TCM, and SRTM. Observe that 2TCM and SRTM fits overlap in B and C.
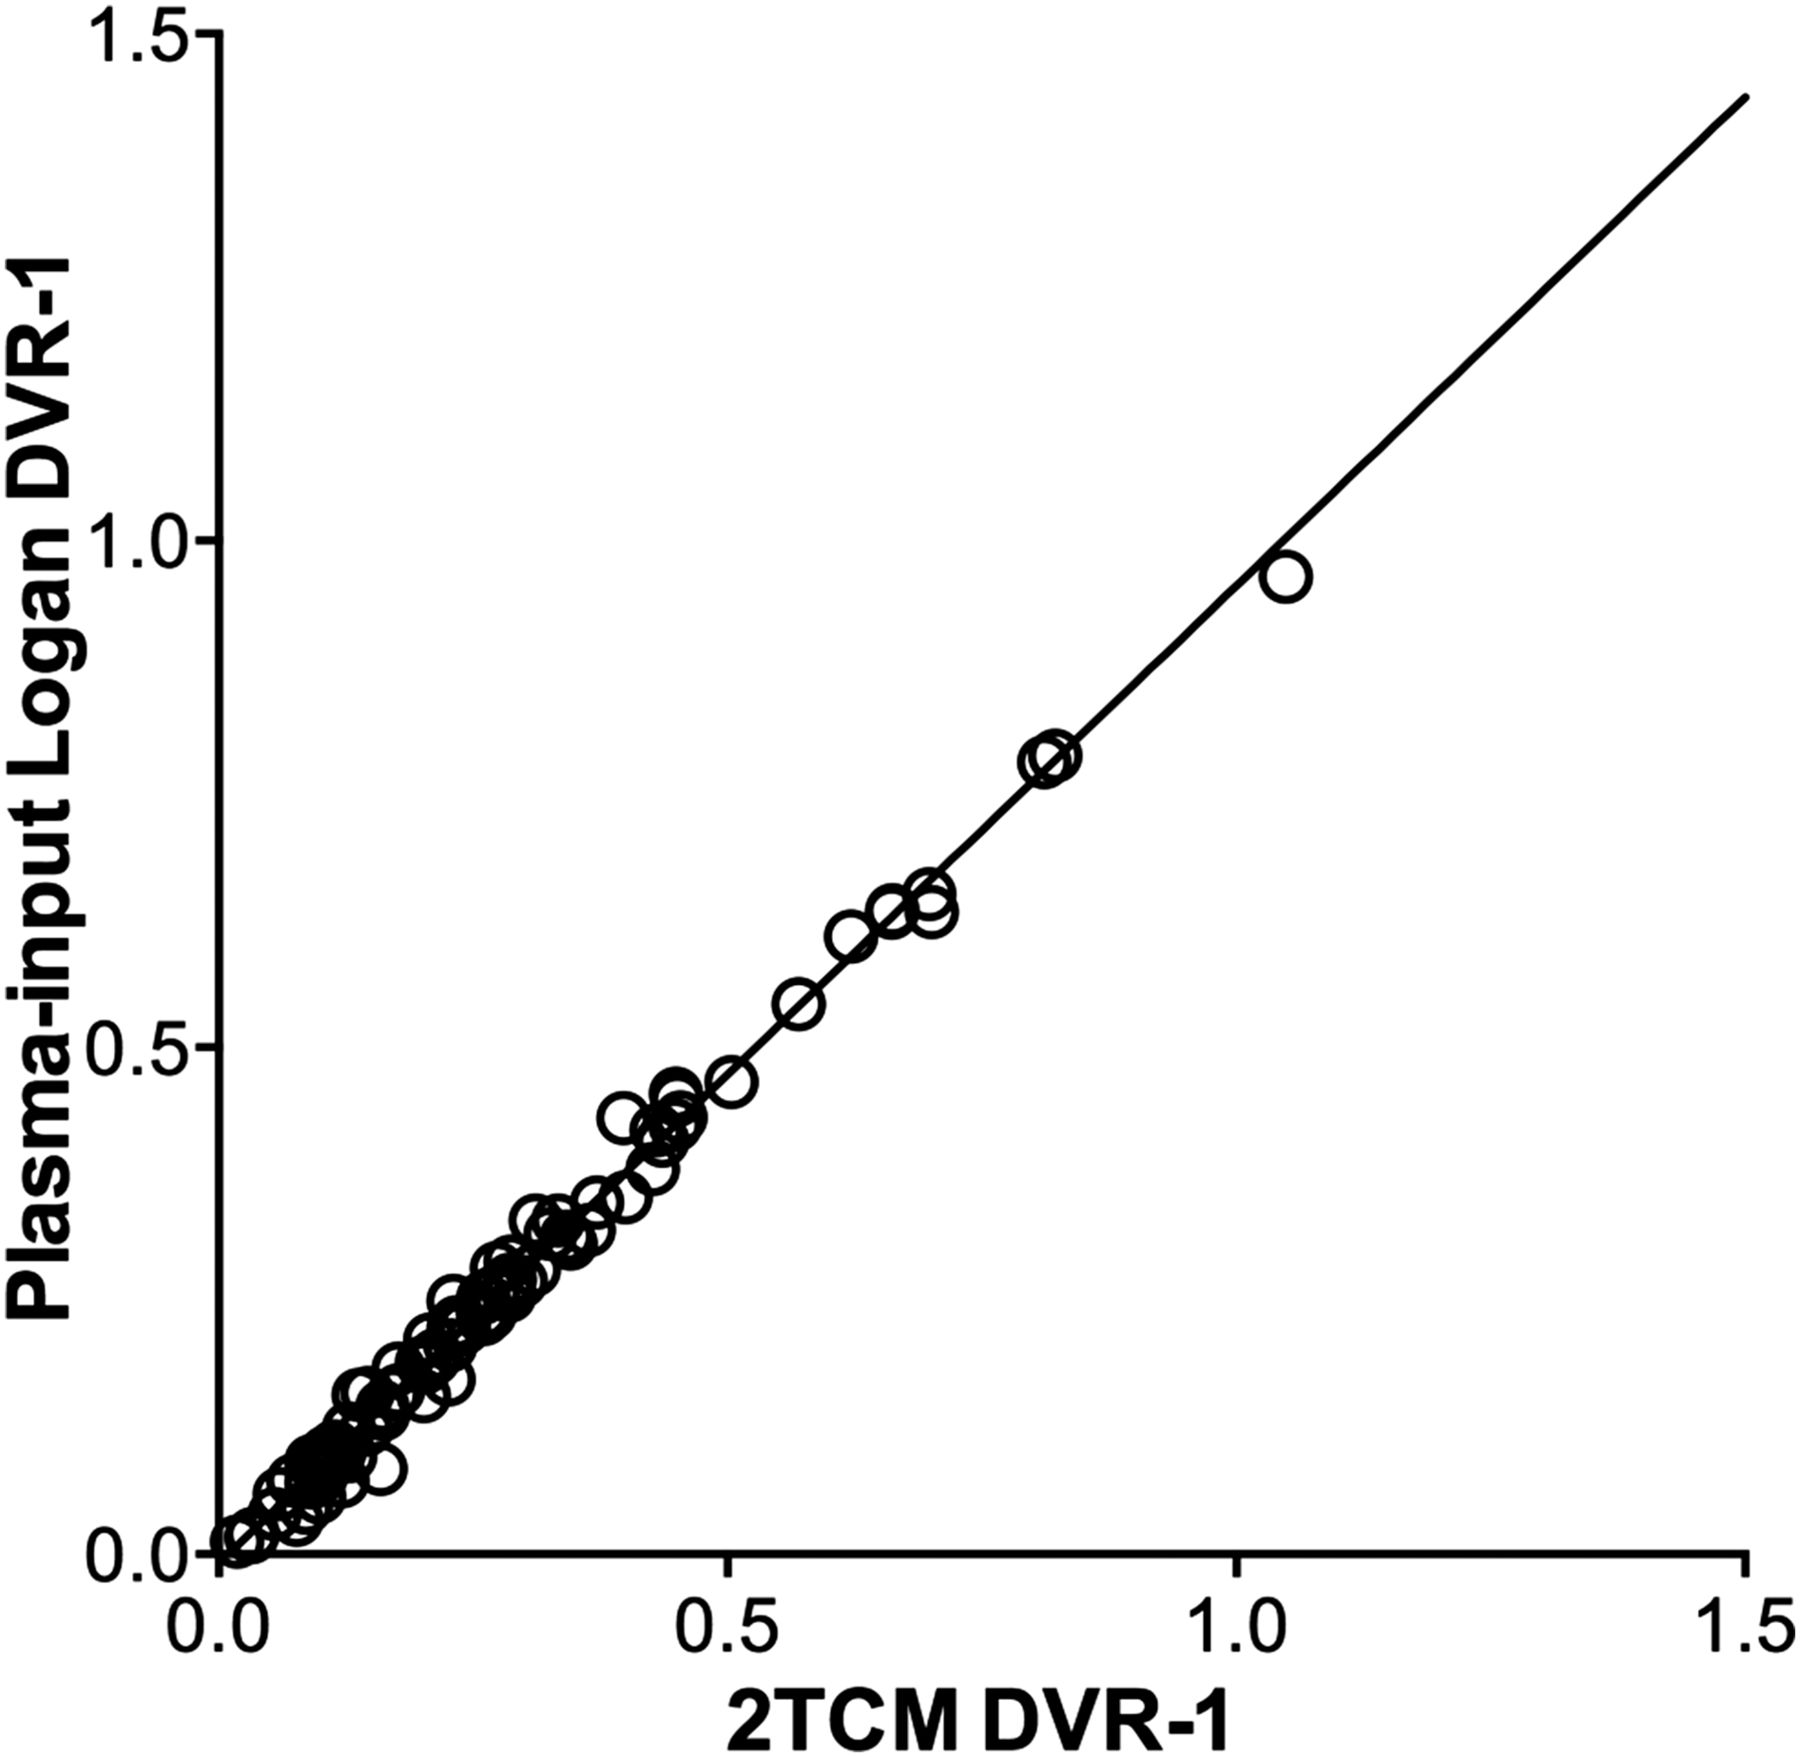
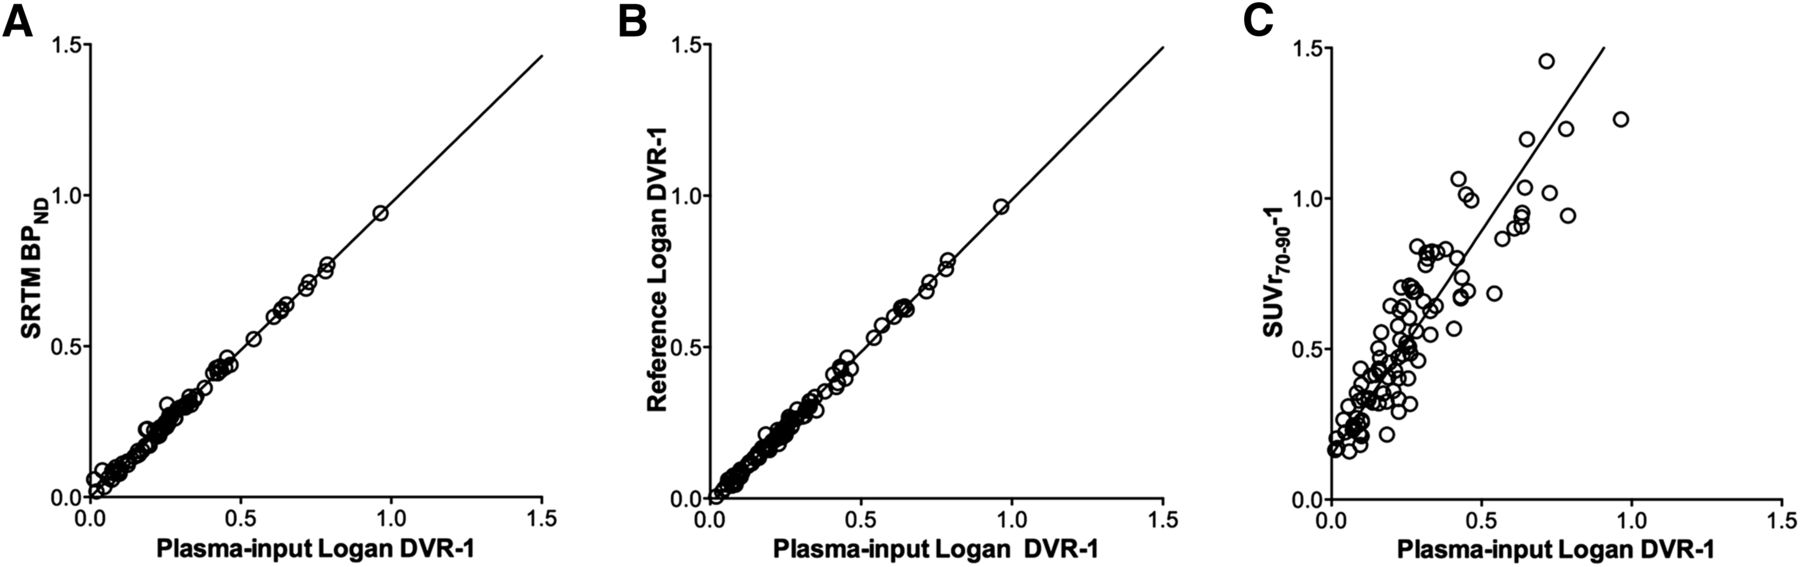
Plasma-input Logan DVR-1 values agreed well with the 2TCM DVR-1 values, as shown in Figure 4 (R2 = 0.99; slope = 0.96). As 13 of the 99 DVR-1 values were removed from the 2TCM analysis because of standard errors greater than 50% in the volumes of distribution value, plasma-input Logan was used as the standard for validating the reference tissue methods and SUVr70–90-1, as shown in Figure 5. The SRTM BPND and reference Logan DVR-1 values correlated well with plasma-input Logan DVR-1 values (R2 = 1; slope ≈ 1). The SUVr70–90-1 values were overestimated compared with plasma-input Logan DVR-1 values, correlating less well than the other reference tissue models. Because omission of the k2 term in the reference Logan method did not significantly change the DVR-1 values, only DVR-1 values obtained without the k2 term are reported for the remainder of the study. The slopes of the orthogonal regressions and R2 values for the comparisons are given in Table 2.

2TCM DVR-1 values versus plasma-input Logan DVR-1 values. Line is orthogonal regression with slope 0.96 (confidence interval, 0.94–0.98) and intercept −0.01 (confidence interval, −0.01–0.00). Correlation coefficient (R2) between 2TCM DVR-1 and plasma-input Logan DVR-1 was 0.99.

Plasma-input Logan DVR-1 values versus SRTM BPND (A), reference Logan DVR-1 (B), and SUVr-1 values (C). Lines are orthogonal regressions. Slopes and correlation coefficients are given in Table 1.
Regression Parameters of Reference Tissue Methods Relative to Plasma-Input Logan DVR-1 Values
Parametric Images
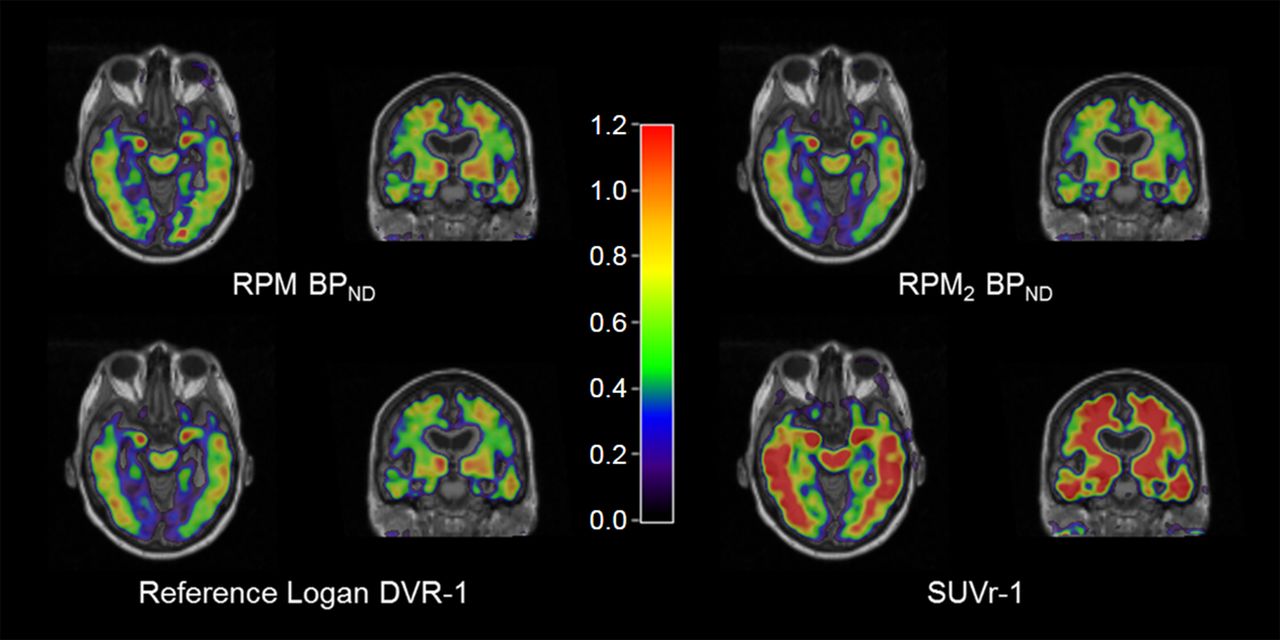
Parametric images from 1 AD patient, showing BPND computed with RPM and RPM2, reference Logan DVR-1, and SUVr70–90-1 values, are given in Figure 6. RPM2 and reference Logan provided similar parametric images. Images obtained with RPM had more noise than RPM2 and reference Logan, whereas SUVr70–90-1 images were overestimated compared with the other methods. The relationships between VOI-based SRTM BPND values and BPND values obtained from RPM and RPM2 as well as reference Logan DVR-1 and SUVr70–90-1 values extracted from the parametric images are given in Supplemental Figure 1. Related slopes of the orthogonal regressions and R2 for the comparisons are given in Table 3. RPM BPND, RPM2 BPND, and reference Logan DVR-1 values correlated well with SRTM BPND values (R2 = 0.98–0.99; slope ≈ 1), whereas SUVr70–90-1 values were less well correlated (R2 = 0.80). Agreement between parametric methods and SRTM was best for the reference Logan method, as indicated by the slope of the orthogonal regression (1.03).

Parametric (S)-18F-THK5117 images of RPM and RPM2 BPND, reference Logan DVR-1, and SUVr70–90-1, from 1 AD patient.
Regression Parameters of Parametric Methods Relative to VOI-Based SRTM BPND Values
Simulations
Accuracy and precision of the simulated DVR-1, BPND, and SUVr70–90-1 values for the different models are given in Table 4 for high and low BPND values. In general, bias and COV were higher for the lower BPND value. Among the reference tissue methods, reference Logan performed best in the simulations, with a small negative bias for the DVR-1 values and high precision (COV = 0.7%–0.8%). A negative bias was also found for the SRTM and RPM BPND values, as well as reasonable precision. SUVr70–90-1 values were the least accurate, with biases exceeding 100% for both high and low binding.
Simulations: Accuracy and Precision
Scan Duration
In addition to the 90-min data, 60- and 40-min datasets were analyzed for all subjects, and the results were compared with the 90-min values. The relationship between 90- and 60- or 40-min based SRTM BPND, reference Logan DVR-1, and SUVr-1 is given in Supplemental Figures 2 and 3. The related slopes and R2 values for the comparisons are given in Table 5. SRTM BPND and reference Logan DVR-1 values were not notably affected by the decrease in scan duration to 60 min, whereas 40- to 60-min SUVr-1 values were slightly lower than 70- to 90-min values. The correlation was poorer for all models with the 40-min dataset than 90 min, with a negative intercept. As shown in Supplemental Figure 3 and also indicated by Figure 2, the differences between BPND, DVR-1, and SUVr-1 based on 40-, 60-, and 90-min datasets varied between regions; the effect of the shortened scan duration was smallest in regions with relatively high BPND values, such as the putamen.
Regression Parameters and Bias Relative to 90-Minute Data
DISCUSSION
(S)-18F-THK5117 time–activity curves were best described by a 2-tissue compartment model, with tau binding estimated as DVR-1, using nonlinear regression of plasma-input models. Results from both SRTM and reference Logan agreed well with indirect plasma-input binding results. In the present work, we performed no correction for clearance from the reference tissue in the reference Logan method. As previously shown (19), omission of this correction results only in a minor underestimation for tracers with fast reference tissue clearance. The excellent agreement between reference Logan and plasma-input Logan DVR-1 values, as shown in Figure 5 and Table 2, confirm that the k2 term can be omitted for (S)-18F-THK5117. Correlation and agreement between SUVr70–90-1 and SRTM BPND was moderate, with SUVr70–90-1 overestimating binding in gray-matter regions by 50%. SRTM BPND and reference Logan DVR-1 values were constant for scan durations of 60 min or more in tau-expressing regions, indicating that a scan duration of 60 min is sufficient for accurate quantification in these regions. However, shortened scan data should be evaluated cautiously in low-binding regions, because equilibrium is not reached even within 90 min (Fig. 2C) in these regions, and binding potential values are underestimated as a consequence. This might also affect the discriminative power of (S)-18F-THK5117 when comparing AD patients with healthy controls as well as its accuracy for monitoring of disease progression or treatment effects, which will be the subject of further studies.
The parametric images resulting from the reference Logan method agreed best with VOI-based SRTM values, as shown in Supplemental Figure 1C. SUVr70–90-1 images significantly overestimated tau binding as shown in Figure 5C. In addition, Figure 6 suggests that the white-matter signal was considerably higher in SUVr70–90-1 images than in parametric BPND images. This higher white-matter signal is confirmed when the relationship between SUVr-1 and SRTM BPND values, as shown in Figure 7, is compared with the relationship in Figure 5C. The SUVr70–90-1 versus BPND slope is significantly steeper in white-matter than in gray-matter regions (2.82 compared with 1.54). This is primarily because the clearance rate in white-matter is significantly lower than in gray-matter regions. As seen both in the parametric images and in Figure 2, the region showing the highest binding of (S)-18F-THK5117 was the putamen. This high (S)-18F-THK5117 accumulation has also been noted for other tau tracers, but cannot be related to tau pathology, which is not present to any large extent in the putamen. To our knowledge, no explanation for this accumulation has yet been presented.

Relationship between SRTM BPND and SUVr70–90-1 values in whole-brain white matter. Line is orthogonal regression.
To our knowledge, thus far no data on tracer kinetics, including arterial plasma data, have been published for any other tau tracer. A recently presented abstract on 18F-T807 (also known as 18F-AV1451) showed a similar distribution pattern of tracer uptake, including a high putamen uptake, with a considerably longer time to equilibrium than (S)-18F-THK5117 (23). The results presented in the present work were based on data from AD and MCI patients only, because we did not perform arterial sampling in healthy control subjects. Hence, no healthy control data were included, although this might have been interesting because the amount of tau in tissue affects the kinetics of the tracer, as shown in Figure 2. However, the range of BPND values also within the present patient group is considerable, because also in AD and MCI patients there are many areas in the brain with little or no tau pathology. Therefore, the results of the present study may be extendable to healthy control data as well, but this will have to be validated in future studies.
Partial-volume correction to account for white-matter spill-over could improve the quantitative accuracy for tracers such as (S)-18F-THK5117 with high white-matter uptake. In addition, partial-volume correction can be used to correct for the increased cerebral spinal fluid volume due to atrophy in AD patients. In this respect, a limitation of the present work is that patients were scanned on a variety of different MRI scanners with different field strengths, which would affect MRI-based partial-volume correction. However, partial-volume correction is outside the scope of the present work and will be assessed in future studies. Nonetheless, the use of parametric images showing BPND or DVR-1 considerably reduces the white-matter signal compared with the SUVr70–90-1 images. When combined with the relatively poor correlation and agreement between SUVr70–90-1 and BPND and the fact that SRTM BPND and reference Logan DVR-1 values are relatively stable over time for scan durations of 60 min or more whereas SUVr-1 values are not, this would suggest that a 60-min dynamic scan can be highly recommended over a single-time-point scan for the quantitative assessment of (S)-18F-THK5117 binding to tau. Moreover, a dynamic scan can not only result in a parametric image of tau binding but also give a relative cerebral blood flow (R1) image, which may be used for the assessment of overall brain function (24,25).
CONCLUSION
The BPND and DVR-1 values obtained with the reference tissue methods, SRTM, and reference Logan, respectively, correlated well with plasma-input Logan DVR-1 values, whereas the SUVr70–90-1 values were only moderately correlated and overestimated (S)-18F-THK5117 binding to tau. Quantitatively accurate DVR-1 parametric images were generated using reference Logan, and these were highly correlated with the VOI-based SRTM BPND values. The results of region-based SRTM BPND and reference Logan DVR-1 values in tau-accumulating regions were stable for scan durations of 60 min. Reference Logan was also the most accurate, with the highest precision in the simulations of the reference tissue methods, and is the method of choice for future quantitative studies with (S)-18F-THK5117.
DISCLOSURE
The costs of publication of this article were defrayed in part by the payment of page charges. Therefore, and solely to indicate this fact, this article is hereby marked “advertisement” in accordance with 18 USC section 1734. This study was financially supported by the Swedish Research Council (project 05817), Swedish Brain Power, the regional agreement on medical training and clinical research (ALF) between Stockholm County Council and Karolinska Institutet and between Uppsala County Council and Uppsala University Hospital, The Strategic Research Program in Neuroscience at Karolinska Institutet, the Foundation for Old Servants, Gun and Bertil Stohne's Foundation, KI foundations, The Swedish Brain Foundation, the Alzheimer Foundation in Sweden, the Swedish Foundation for Strategic Research, and the EU FW7 large-scale integrating project INMiND. No other potential conflict of interest relevant to this article was reported.
Acknowledgments
We thank Dr. Okamura, Tohoku University, Sendai, Japan, for generously supplying the precursor for (S)-18F-THK5117, and the staff at the PET centre, Uppsala University Hospital, for their assistance.
Footnotes
Published online Jan. 21, 2016.
- © 2016 by the Society of Nuclear Medicine and Molecular Imaging, Inc.
REFERENCES
- Received for publication April 1, 2015.
- Accepted for publication November 19, 2015.


Jump to section
Related Articles
Cited By...
- In vivo characterization and quantification of neurofibrillary tau PET radioligand [18F]MK-6240 in humans from Alzheimers disease dementia to young controls
- In Vivo Characterization and Quantification of Neurofibrillary Tau PET Radioligand 18F-MK-6240 in Humans from Alzheimer Disease Dementia to Young Controls
- Evaluation of 18F-RO-948 PET for Quantitative Assessment of Tau Accumulation in the Human Brain
- Cerebrospinal Fluid Clearance in Alzheimer Disease Measured with Dynamic PET
- In Vivo Comparison of Tau Radioligands 18F-THK-5351 and 18F-THK-5317