


Abstract
Adequate suppression of cardiac glucose metabolism increases the interpretability and diagnostic reliability of 18F-FDG PET studies performed to detect cardiac inflammation and infection. There are no standardized guidelines, though prolonged fasting (>6 h), carbohydrate-restricted diets, fatty meals, and heparin loading all have been proposed. The aim of this study was to compare the 3 preparatory protocols used in our institution. Methods: 18F-FDG PET scans were selected and grouped according to 3 preparatory protocols (50 consecutive scans per group): 6-h fast (group 1), low-carbohydrate diet plus 12-h fast (group 2), and low-carbohydrate diet plus 12-h fast plus intravenous heparin preadministration (50 IU/kg) (group 3). Consecutive scans were retrospectively included from time frames during which the particular protocol was used. Group 1 included oncologic indications, and groups 2 and 3 infection or inflammation detection. Cardiac segments for which inflammation or infection foci had been confirmed on other imaging modalities were excluded from the analysis. 18F-FDG uptake in normal myocardium was scored according to a scale ranging from 0 (uptake less than that in left ventricle blood pool) to 4 (diffuse uptake greater than that in liver). Adequate suppression was defined as uptake less than that in liver and without any focus (scores 0–2). Results: Adequate suppression differed significantly between groups: 28% in group 1, 54% in group 2, and 88% in group 3 (P < 0.0001 for all comparisons). Conclusion: Single-dose heparin administration before 18F-FDG PET in addition to a low-carbohydrate diet significantly outperforms a low-carbohydrate diet alone in adequately suppressing cardiac glucose metabolism.
For detecting cardiac infection and cardiac involvement in sarcoidosis, 18F-FDG PET with CT attenuation correction (PET/CT) has been proposed as an important imaging modality (1–3), most notably diagnosing pacemaker lead and prosthetic heart valve infection (4–7). These disease entities are associated with high morbidity and mortality rates, and adequate diagnosis is of the utmost importance in guiding therapeutic decisions.
When 18F-FDG PET is used to diagnose cardiac and pericardiac inflammation or infection, it is important to differentiate between pathologic uptake of 18F-FDG in lesions and physiologic uptake of 18F-FDG in normal myocardium. Uptake in normal myocardium is dependent mainly on insulin, blood glucose levels, and blood free fatty acid (FFA) levels in accordance with the Randle cycle (8). Elevated insulin and blood glucose levels and decreased FFA levels lead to a relative rise in myocardial glucose consumption, whereas during fasting, an increase in FFA levels and a decrease in insulin and glucose levels shifts myocardial energy consumption away from glucose and toward FFA. Type 4 cellular glucose transporter (GLUT4) mediates the latter inhibitory effect, whereas it is mainly GLUT1 and GLUT3 that mediate the increased glucose consumption of inflammatory cell responses. By manipulating the GLUT4 response, it is possible to suppress physiologic myocardial glucose consumption independently of inflammatory processes.
Several methods to suppress cardiac glucose metabolism have been reported: prolonged intervals of fasting (leading to a decrease in blood glucose and insulin levels and, eventually, an increase in blood FFA levels), low-carbohydrate diets (minimizing blood glucose and insulin levels), fat-rich meals (elevating blood FFA levels), heparin administration (inducing lipolysis in vivo and up to a 5-fold increase in blood FFA levels (9)), and combinations of these methods (10–19). To date, no standard protocol has been adopted, although combination protocols have been advocated by some studies and recent reviews (2,3).
The aim of this study was to compare the efficacy of 3 methods of cardiac suppression: the standard oncologic preparation (≥6-h fast, group 1), a low-carbohydrate diet alone (group 2), and a low-carbohydrate diet with heparin preadministration (group 3).
MATERIALS AND METHODS
Patient Selection
In our hospital, a low-carbohydrate diet including prolonged fasting (≥12 h) was applied as the protocol of choice for cardiac suppression from 2008 to early 2013. Because of a relatively high number of scans with unsatisfactory cardiac suppression, heparin preadministration (50 IU/kg of body weight intravenously 15 min before administration of 18F-FDG) was added to the protocol in 2013.
At the time of analysis, 50 scans had been performed with heparin preadministration and were included as group 3. For comparison with group 3, each of groups 1 and 2 included 50 consecutive scans from among those most recently performed. In group 1 all scans were performed for oncologic indications; in groups 2 and 3 the indications were either sarcoidosis or fever of unknown origin with possible cardiac involvement. Weight, body mass index, and body surface area were measured before the 18F-FDG PET/CT scan (Table 1). Because all data were retrospectively gathered from standard clinical procedures, review was not deemed necessary by the local ethics committee.
Group Characteristics
Imaging
Groups 2 and 3 followed the same carbohydrate-restricted, fat- and protein-allowed diet for at least 12 h before a fast of at least 12 h. Fifteen minutes before 18F-FDG administration (2 MBq/kg), group 3 additionally received a 50 IU/kg intravenous dose of heparin. All scans were performed at the University Medical Center Utrecht on the same 18F-FDG PET/CT system (Biograph mCT; Siemens) approximately 60 min after administration of 18F-FDG. Before the PET acquisition, unenhanced CT images were obtained for attenuation correction. PET was performed using 3-dimensional acquisition, a field of view of 216 mm, and a scanning time of 3 min/bed position; low-dose CT for attenuation correction was performed using a 1.0 pitch, a 10-mm slice thickness, 120 kV, and 40 mAs. The PET/CT data were reconstructed using iterative ordered-subsets expectation maximization (gaussian filter, 4 iterations, 21 subsets).
Scoring
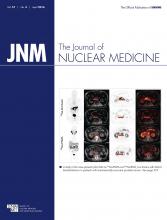
Figure 1 shows a flowchart of the scoring process. To measure the effects on normal myocardium alone, cardiac areas with proven or highly probable sarcoidosis or infectious lesions based on elevated 18F-FDG uptake and correlation with lesions on MRI, contrast-enhanced CT, or transesophageal echocardiography were excluded from the analysis. The number excluded was only 12 of a possible 2,550 segments (0.5%) (0 scans in group 1, 4 scans in group 2 [6 excluded segments total], and 5 scans in group 3 [6 excluded segments total]).

Visual scoring flowchart.
Scoring was performed by a nuclear medicine specialist with 8 y of experience in cardiac imaging and a nuclear medicine physician in training, both of whom were masked to the patient preparation method but had full access to the entire scan. In cases of disagreement, the two interpreters reached a consensus to produce the final score used in the analysis.
First, uptake in the heart as a whole was scored according to a visual scale (Table 2). Scores of 0, 1, and 2 signified cardiac suppression adequate for clinical evaluation. A score of 3, signifying partially inadequate cardiac suppression (focal uptake difficult to distinguish from cardiac inflammation), was additionally scored according to the 17-segment model to analyze uptake patterns. In this additional scoring model, because the distinction between diffuse and focal distribution does not apply to a segmental model, scores of 3 and 4 were conflated and the segmental score was adjusted to one of the following: 0 (uptake < ventricular blood pool uptake), 1 (uptake = ventricular blood pool uptake), 2 (uptake > ventricular blood pool uptake but < liver uptake), and 3 (uptake > liver uptake).
Scoring Scale
Statistics
Continuous variables were compared between groups using 1-way ANOVA with post hoc Bonferroni analysis. Categoric visual scores were compared between groups using the Pearson χ2 test. P values below 0.05 were considered statistically significant, except in the Bonferroni analysis, for which P values below 0.0167 (0.05/3) were considered significant.
RESULTS
Age and mean blood glucose level did not differ significantly between groups (Table 1). Weight was moderately but significantly lower in group 1 than in groups 2 and 3, with body mass index and body surface area being significantly different or trending toward a significant difference accordingly. There were no significant differences between groups 2 and 3. The scores for the 3 groups are shown in Table 3 and Figure 2.
Visual Assessment Scores per Group

Visual score distribution per group.
There was little disagreement between the 2 interpreters, with only 6 of 150 scans scored differently in terms of adequate versus inadequate suppression. Four of these 6 scans showed diffuse myocardial activity nearly equal to liver activity, leading the first interpreter to score them as 2 and the second interpreter as 4. The other 2 scans had very small focal lesions that were missed by one of the interpreters, changing the scores from 1 to 4.
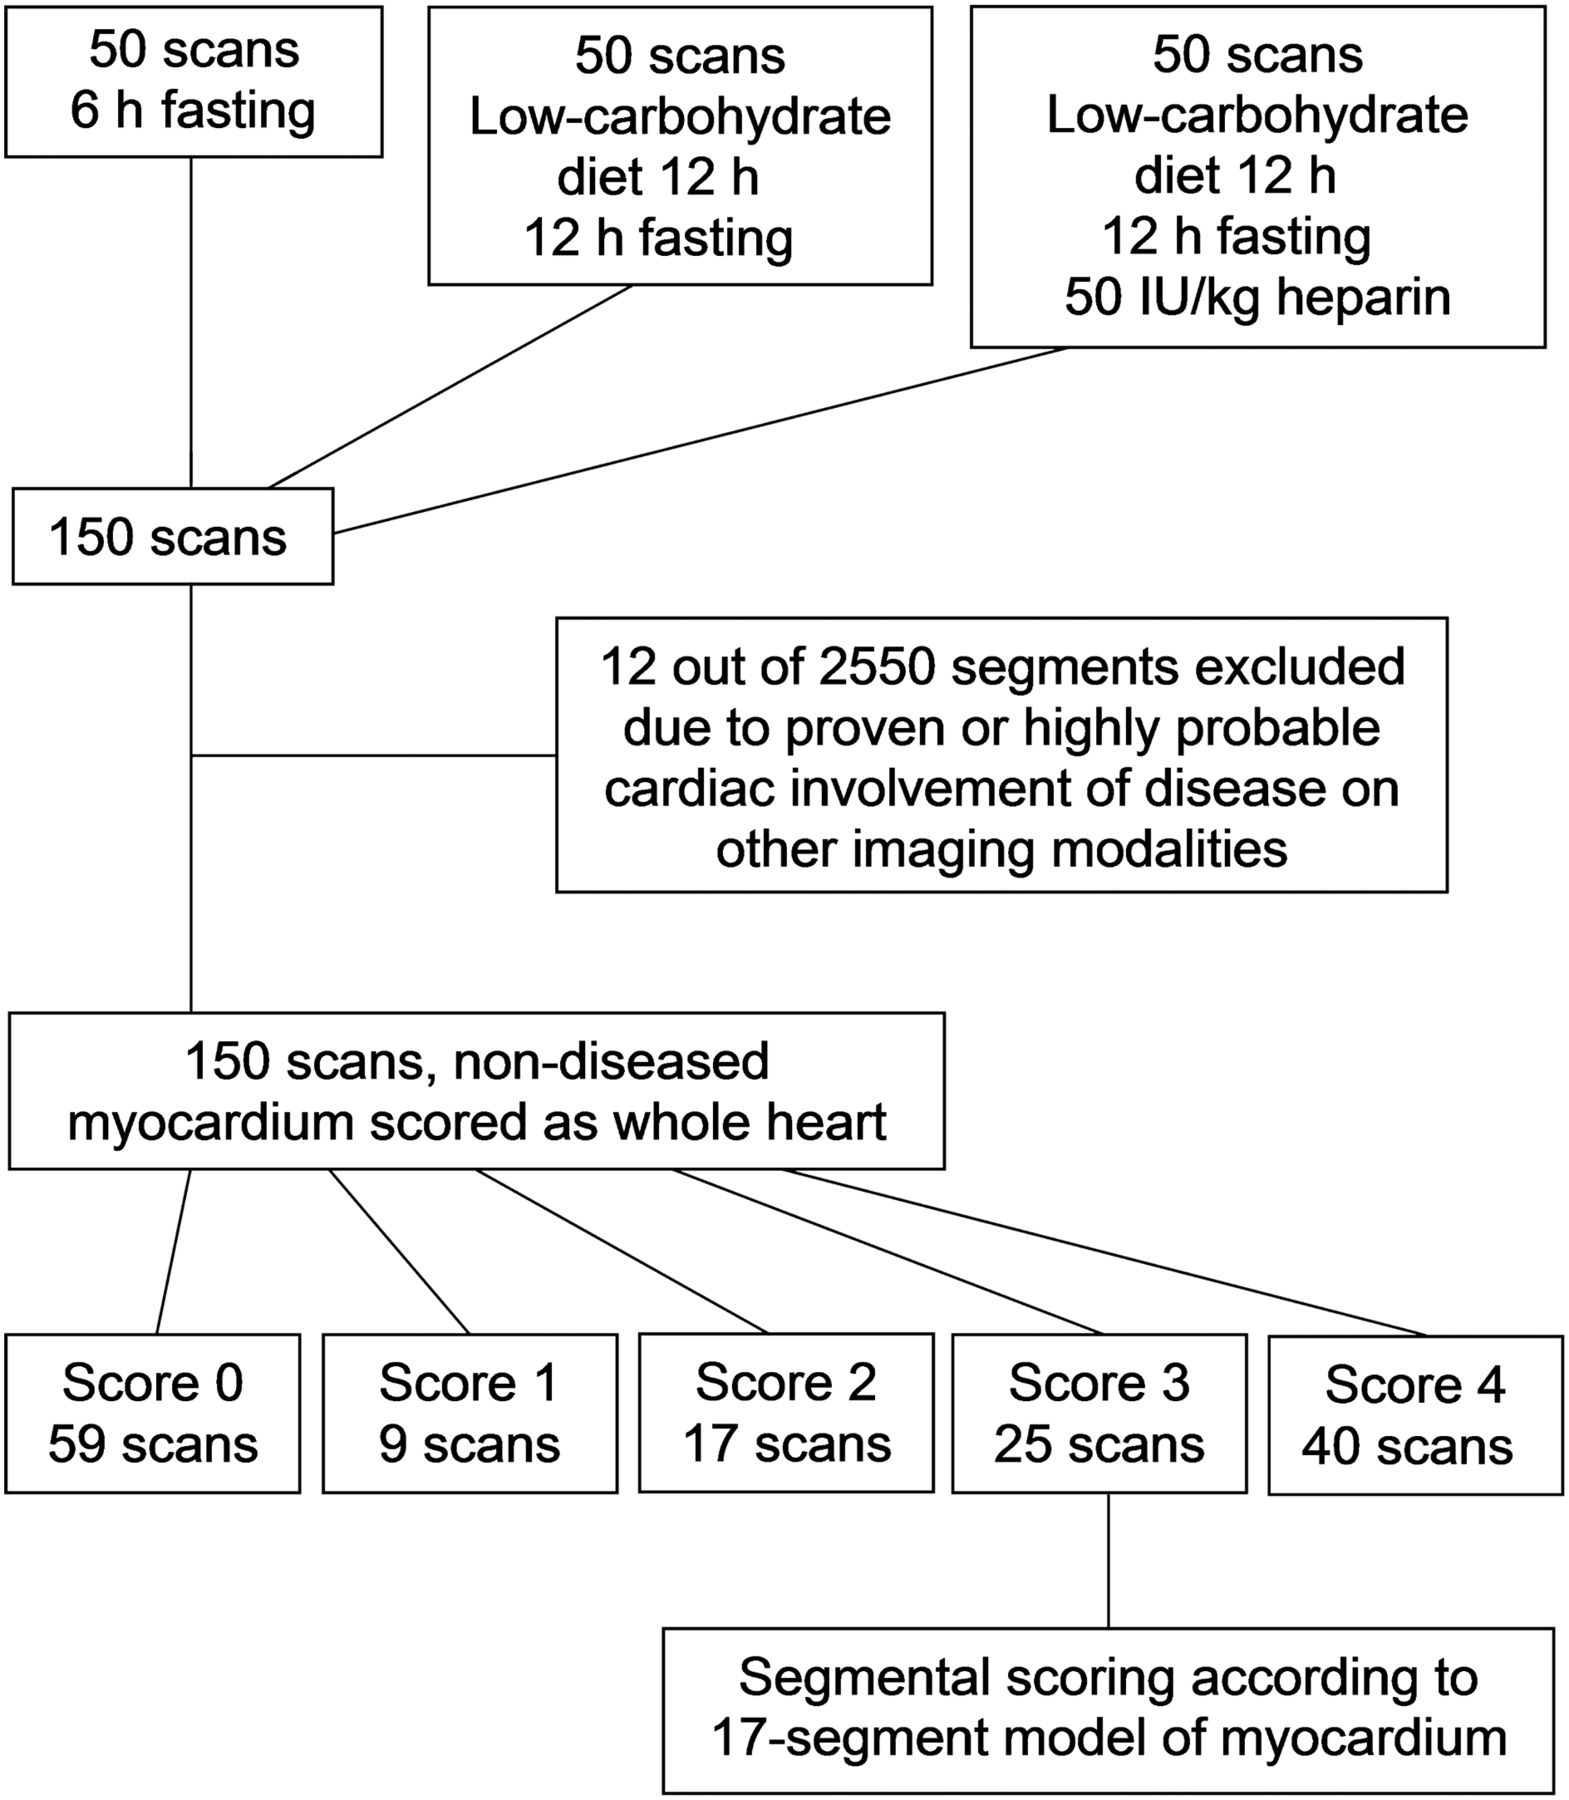
Twenty-five representative axial images for each group are compared in Figure 3, revealing the significant decrease in the number of scans showing intense cardiac uptake. Although the low-carbohydrate diet with prolonged fasting statistically improved cardiac suppression compared with the standard preparation (P < 0.0001), the improvement in cardiac suppression in the heparin group was significantly larger not only compared with the standard preparation (P < 0.0001) but also compared with diet alone (P < 0.0001). Adequate cardiac suppression (score ≤ 2) rose from 54% after diet alone to 88% after diet with heparin preadministration.

Representative distribution of findings in each group.
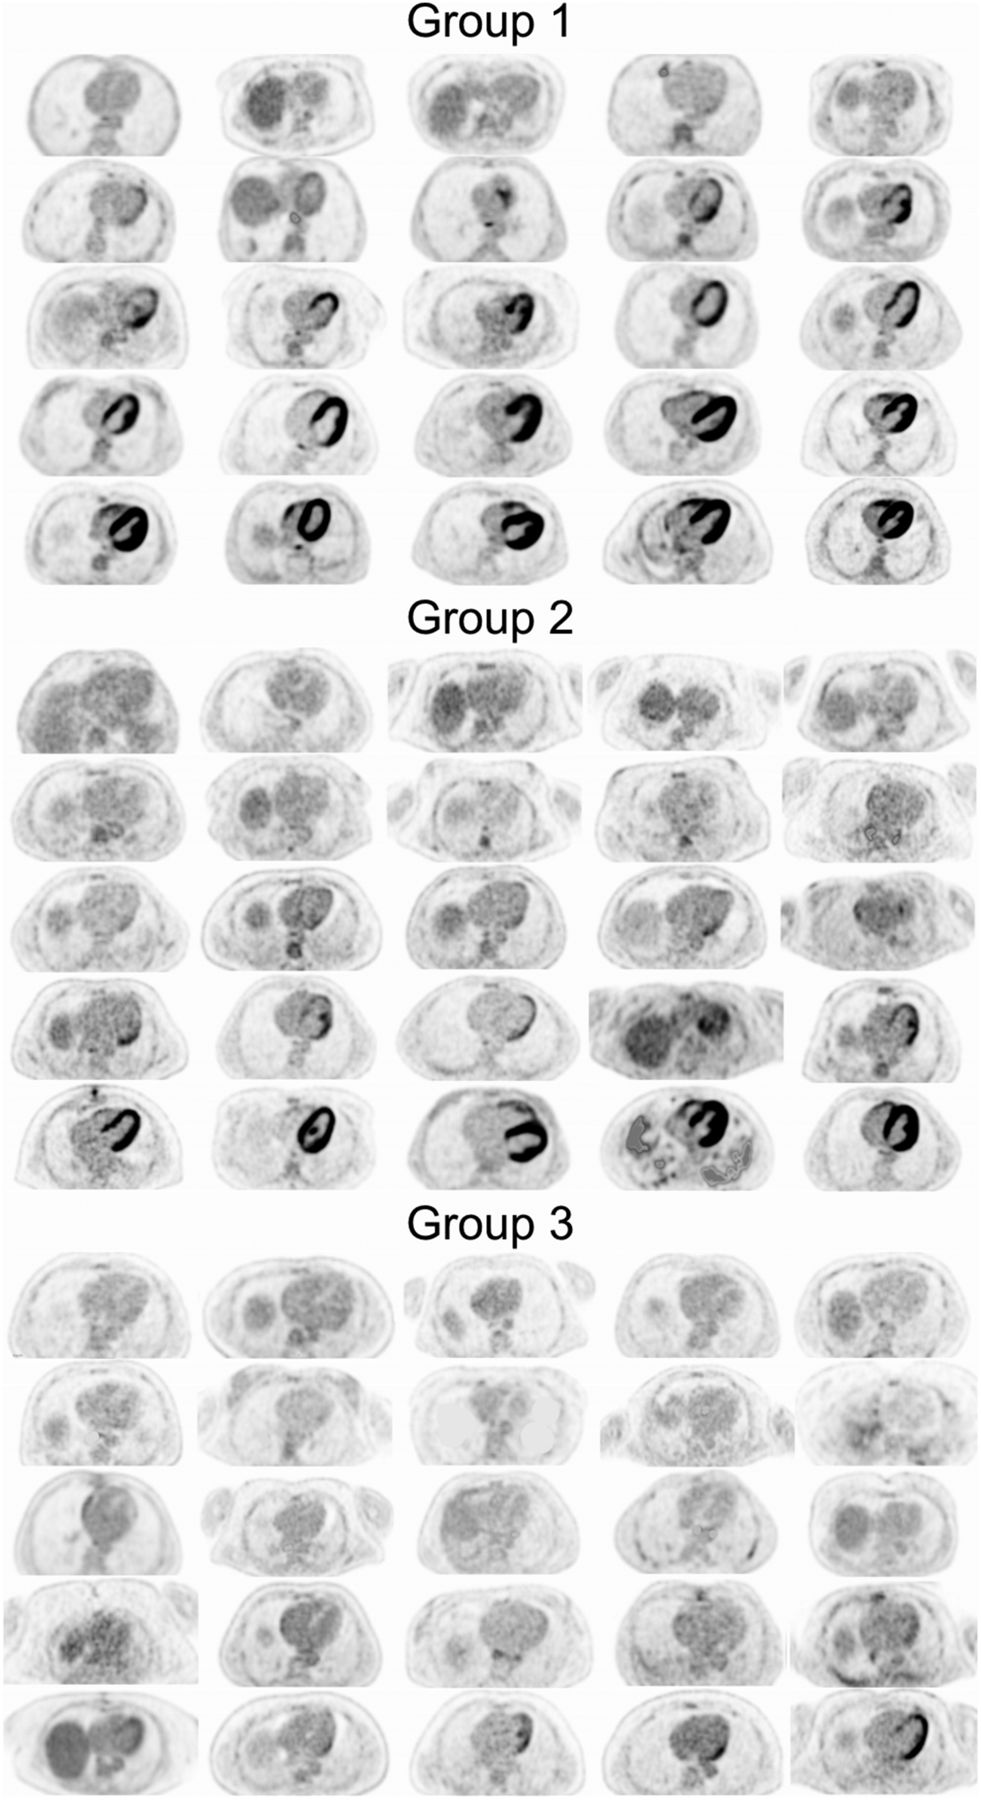
In scans showing a nondiffuse distribution of myocardial uptake (25/150), the most common uptake patterns in descending order of frequency were lateral wall including apex, mid-to-basal lateral wall alone, and basal ring. Mean and median scores per segment are shown in Figure 4, confirming these patterns.

Mean (A) and median (B) uptake scores per segment in scans with nondiffuse uptake.
DISCUSSION
To the best of our knowledge, this is the first study to compare a low-carbohydrate diet plus a fast of at least 12 h with and without heparin preadministration to a standard 6-h fast without dietary modifications. In our analysis, the addition of a 50 IU/kg intravenous dose of heparin 15 min before administration of 18F-FDG significantly increased cardiac suppression compared with both the standard protocol and the low-carbohydrate-diet-alone protocols.
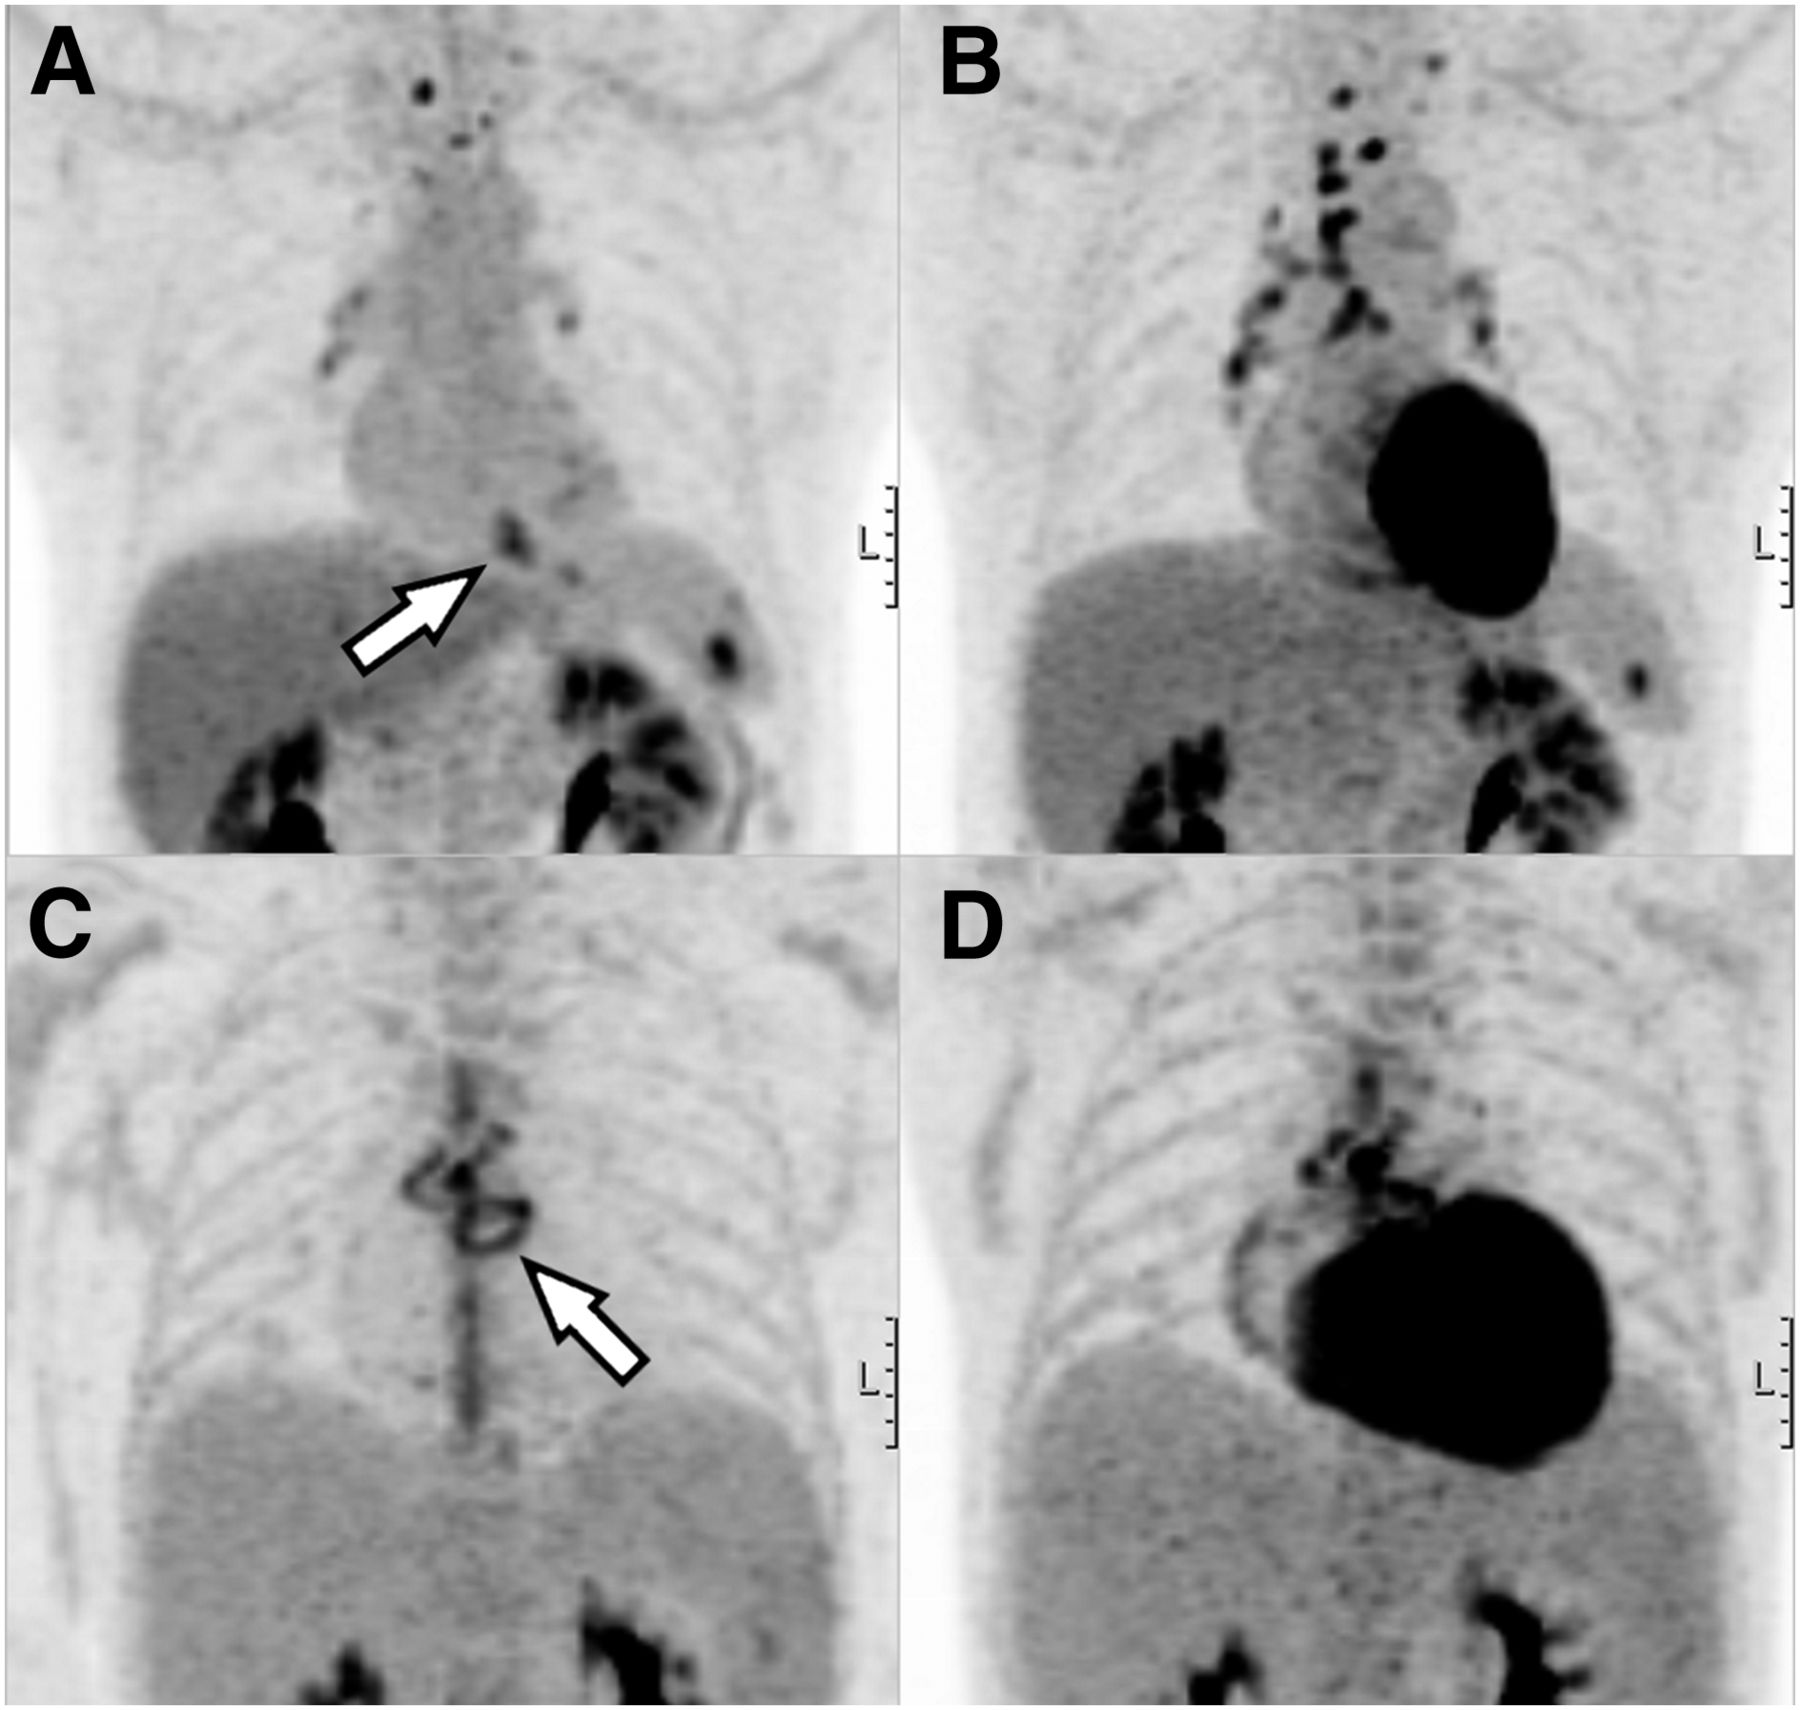
In general, scans with diffusely intense myocardial uptake should be considered nondiagnostic for cardiac inflammatory disease because physiologic uptake effectively masks any possible foci of pathologic uptake, as shown in Figure 5. Conversely, scans with focal or focal-on-diffuse physiologic uptake may be falsely interpreted as indicating cardiac disease. By minimizing the number of scans with these uptake patterns, the heparin preadministration protocol probably improves the accuracy of 18F-FDG PET/CT for detection of pericardiac or cardiac infection and inflammation. Additionally, because the absence of cardiac uptake may be interpreted as an absence of active myocardial inflammatory disease, a more consistently adequate method of cardiac suppression could diminish the need for additional studies such as myocardial perfusion scintigraphy or cardiac MRI to rule out cardiac involvement. An important exception to this approach is the detection of cardiac-valve infectious vegetations, which reports indicate are not detected by 18F-FDG PET (4,5). Care should be taken not to exclude the presence of infectious vegetations on the basis of negative 18F-FDG PET findings alone.

Consecutive maximum-intensity projections of patient with cardiac sarcoidosis (A and B) and patient with prosthetic heart valve endocarditis (C and D). In both patients, inflammatory foci (arrows) are almost completely masked (right) unless physiologic myocardial 18F-FDG uptake is adequately suppressed (left).
Although heparin preadministration improved cardiac suppression, a minority of scans still showed suboptimal suppression. Because adherence to the protocol was self-reported, we cannot exclude the possibility that some patients did not adhere to their diet as well as they reported. However, it may be hypothesized that any lack of adherence to the diet will be equally distributed over the groups. It therefore seems unlikely that differences in adherence alone explain the differences found in this study.
Other factors known to influence cardiac glucose uptake are the presence of myocardial ischemia and heart failure. Ischemia leads to locally enhanced glucose consumption due to several factors: glucose oxidation yields a greater amount of adenosine triphosphate per mole of oxygen than FFA does; a small amount of adenosine triphosphate is generated through glycolysis independently of oxygen supply; and glucose transport is enhanced in oxygen-deprived tissue (20). In heart failure, a generic shift occurs from FFA toward glucose as the preferred fuel (21). However, none of the patients in this study had clinically suspected myocardial ischemia or were known to have heart failure at the time of the scan. Although the presence of these factors should be accounted for when cardiac 18F-FDG PET is interpreted, it is unlikely that they played a significant role in our analysis.
Although body weight was significantly lower in group 1 than in groups 2 and 3 (likely because of the cachectic effects of malignancy), possibly leading to differences in glucose metabolism, lowered body weight would theoretically lead to lower available serum glucose, which in turn would shift cardiac metabolism toward FFA consumption and does not explain the higher prevalence of unsuppressed myocardium in this group.
Our findings on analyzing the patterns of 18F-FDG distribution in physiologically nondiffuse cardiac uptake (score of 3) are in keeping with earlier publications (22–24). Knowledge of these variable patterns of nonpathologic uptake is important in the interpretation of 18F-FDG PET scans for cardiac inflammatory or infectious disease when cardiac suppression may not be adequate.
Limitations
Although the retrospective nature of this study and the relatively low number of patients per group limits statistical power, the differences between groups were still highly significant. Nevertheless, our findings should ideally be validated in a larger, prospective trial.
SUV analysis was not performed, as we believe such an analysis would provide no added benefit to the assessment of normal myocardium and the effects of these preparatory protocols. Reporting a mean or median SUV for each group does not incorporate the high variability in uptake, both with regard to intensity and with regard to location, among subjects (Fig. 2). Also, it may be difficult to delineate the true uptake in adequately suppressed myocardium, leaving such measurements relatively prone to error. We believe the visual uptake score is the most reliable and important variable for this analysis.
We did not perform an in-depth analysis of the medications used by the different patient groups. Although differences in medication could theoretically influence cardiac glucose metabolism, this influence is likely limited when protocols are strictly adhered to and is unlikely to explain the highly statistically significant differences among the 3 groups of this study.
Safety Considerations
Because unfractionated heparin is an anticoagulant, the major safety consideration is the risk of bleeding disorders. In a metaanalysis on thromboprophylaxis by Martel et al., the risk of heparin-induced thrombocytopenia from unfractionated heparin was calculated at 2.6%, but the durations of heparin therapy (range, 6–30 d) were far beyond the single bolus administered in our protocol (25). Although carrying a lower risk of heparin-induced thrombocytopenia, low-molecular-weight heparin has been shown to produce a rise in FFA levels inferior to that of unfractionated heparin, probably making it less suitable for cardiac suppression (9).
A study evaluating prophylactic anticoagulation during peripheral intervention (with a heparin dose more closely approximating our protocol) found major and minor bleeding complications of 0.9% and 9.0%, respectively (26), but all complications were related to the arterial access site and therefore not applicable to our protocol, in which no arterial puncture was performed. In our patient group, no bleeding complications were reported.
Although special attention should be given to patients who already receive anticoagulant therapy or have a history of bleeding disorders, the added value for cardiac suppression of a single bolus of unfractionated heparin certainly appears to outweigh the low associated risk of bleeding disorders in most patients. It is possible that this risk can be minimized further, as intravenous administration of heparin has been shown to induce a rise in serum FFA levels at doses below the threshold for anticoagulant effects. In one study, 15 IU/kg more than doubled the FFA concentration while having hardly any effect on the partial thromboplastin time in 5 healthy volunteers (27). In that study, FFA levels plateaued at 15–25 IU/kg, the latter being the highest dose tested. It is unknown whether this plateau is maintained at 50 IU/kg or whether FFA levels rise further. If a dose of 15 IU/kg does indeed elicit a rise in serum FFA levels adequate to suppress myocardial glucose metabolism to the same extent as 50 IU/kg did in our data, heparin preadministration can be incorporated into the protocol without adding any risk of bleeding disorders. Future studies comparing these two doses are needed.
CONCLUSION
A low-carbohydrate diet and prolonged fasting combined with heparin preadministration suppresses cardiac glucose metabolism significantly better than diet and prolonged fasting alone, leading to improved interpretability of 18F-FDG PET scans performed for the detection of cardiac inflammation or infection.
DISCLOSURE
The costs of publication of this article were defrayed in part by the payment of page charges. Therefore, and solely to indicate this fact, this article is hereby marked “advertisement” in accordance with 18 USC section 1734. No potential conflict of interest relevant to this article was reported.
Acknowledgments
We thank Dr. Ties Mulders for serving as the second interpreter.
Footnotes
Published online Dec. 10, 2015.
- © 2016 by the Society of Nuclear Medicine and Molecular Imaging, Inc.
REFERENCES
- Received for publication September 15, 2015.
- Accepted for publication November 10, 2015.


Jump to section
Related Articles
Cited By...
- 18F-FDG Myocardial Uptake Related to Continuous Venovenous Hemodialysis: The Importance of Eliminating All Things Sweet
- PET/MRI Assessment of Acute Cardiac Inflammation 1 Month After Left-Sided Breast Cancer Radiation Therapy
- PET/MRI Assessment of Acute Cardiac Inflammation 1 Month After Left-Sided Breast Cancer Radiation Therapy
- Diagnostic Uncertainty in Prosthetic Valve Endocarditis: Value of 18F-FDG PET/CT and the Need for Standardization
- Prognostic Impact of FDG-PET/CT Images in Patients With Suspected Cardiac Sarcoidosis: Optimal Patient Preparation, Not Complex Unconventional Analytics, Is Key to Meaningful Data
- 18F-Fluorodeoxyglucose Imaging of Inflammation: Ready to Represent a Standard in Diagnosing Endocarditis?
- Confounders in FDG-PET/CT Imaging of Suspected Prosthetic Valve Endocarditis
- Diagnostic Accuracy of 18F-FDG PET/CT in Infective Endocarditis and Implantable Cardiac Electronic Device Infection: A Cross-Sectional Study
- 18F-FDG PET/CT in the Diagnostic Workup of Infective Endocarditis and Related Intracardiac Prosthetic Material: A Clear Message
- Multimodality Cardiac Imaging for the Assessment of Left Atrial Function and the Association With Atrial Arrhythmias