


Abstract
Our aim was to determine the feasibility of 18F-florbetaben PET in diagnosing cardiac amyloidosis. Methods: 18F-florbetaben PET was performed on 14 patients: 5 amyloid light chain, 5 amyloid transthyretin, and 4 control with hypertensive heart disease. Qualitative and quantitative assessments of 18F-florbetaben activity were performed using the SUVmean of the left ventricular myocardium and blood pool and calculation of target-to-background SUV ratio. Myocardial 18F-forbetaben retention was also calculated as the percentage mean myocardial SUV change between 0 and 5 min and 15 and 20 min after radiotracer injection. Global left ventricular longitudinal and right ventricular free wall longitudinal strain were calculated using 2-dimensional speckle-tracking echocardiography. Results: Target-to-background SUV ratio and percentage myocardial 18F-forbetaben retention were higher in amyloid patients than in hypertensive controls. A cutoff of 40% was able to differentiate between cardiac amyloid patients and hypertensive controls. Percentage myocardial 18F-forbetaben retention was an independent determinant of both global left ventricular longitudinal and right ventricular free wall longitudinal strain via an inverse curve relationship. Conclusion: 18F-florbetaben PET imaging can accurately identify and differentiate between cardiac amyloidosis and hypertensive heart disease. Percentage myocardial 18F-florbetaben retention was an independent determinant of myocardial dysfunction in cardiac amyloidosis.
Amyloidosis is a heterogeneous group of disorders that results from the extracellular deposition of insoluble proteins with a unique β-pleated-sheet secondary structure, leading to dysfunction of the affected organ (1). Although many types of amyloid proteins can deposit in the heart, it is predominantly the amyloid light chain (AL) subtype and the senile wild-type/hereditary mutant amyloid transthyretin (ATTR) subtype that cause clinical cardiac disease. Cardiac amyloidosis is often not diagnosed until late in the course of the disease, as the typical appearance of the infiltrated myocardium, impaired left ventricular (LV) function, and reduced myocardial Doppler velocities is usually mistaken for more prevalent causes of concentric LV hypertrophy such as hypertensive heart disease (1). By the time congestive heart failure is clinically manifest, cardiac amyloidosis portends an extremely poor prognosis and is the main cause of morbidity and mortality. Advanced echocardiographic techniques such as 2-dimensional (2D) speckle-tracking strain imaging are useful in demonstrating impaired longitudinal function with apical sparing (2). However, this technique is not pathognomonic for cardiac amyloidosis and cannot differentiate it from other causes of LV hypertrophy with 100% accuracy (2).
PET imaging with 18F-labeled florbetaben has been shown to accurately detect β-amyloid neuritic plaques in the brain in patients with Alzheimer disease (3). This agent specifically binds to the amyloid β-pleated-sheet structure (4). However, its feasibility and accuracy in diagnosing cardiac amyloidosis are unknown. Furthermore, early detection of subclinical cardiac amyloidosis before clinical manifestation of heart failure may permit early initiation of appropriate therapy. Finally, the agent may also permit quantification and monitoring of the burden of amyloid plaque deposition. Therefore, the aims of the present study were to determine the feasibility of 18F-flobetaben PET imaging in diagnosing cardiac amyloidosis compared with a control group of patients with hypertensive heart disease and to correlate the extent of 18F-florbetaben myocardial retention with biventricular myocardial dysfunction on 2D speckle-tracking echocardiography.
MATERIALS AND METHODS
Patient Population and Study Protocol
Ten patients with cardiac amyloidosis (5 AL and 5 ATTR) were prospectively recruited to undergo PET imaging and transthoracic echocardiography. All amyloid patients (both AL and ATTR) had echocardiographic features consistent with cardiac amyloidosis. All ATTR patients had endomyocardial biopsy–proven cardiac amyloid and wild-type ATTR, otherwise known as senile cardiac amyloidosis. Patients with the AL subtype had biopsy from other organs (kidney, bone marrow, prostate, rectum) and met the consensus criteria of the International Society of Amyloidosis for cardiac involvement (5). The subtype of amyloidosis was determined by tandem mass spectrometry in 6 patients and immunohistochemistry or immunofluorescence in 4 patients. Genetic testing for transthyretin gene mutations was negative in all ATTR cases.
As per guidelines, echocardiographic definition of cardiac amyloidosis included LV wall thickness greater than 12 mm, granular sparkling of the myocardium, right ventricular (RV) free wall thickness greater than 5 mm, increased atrioventricular valve or interatrial septal thickness, pericardial effusion, and LV diastolic dysfunction (based on mitral inflow, pulmonary venous flow, and tissue Doppler imaging of septal and lateral mitral annulus) (5).
Because LV hypertrophy due to hypertensive heart disease is a frequent differential diagnosis for cardiac amyloidosis, 4 hypertensive controls with echocardiographic evidence of concentric LV hypertrophy were also prospectively recruited.
None of the patients had echocardiographic or cardiac MRI features that would suggest hypertrophic cardiomyopathy or variants.
Laboratory examinations included glomerular filtration rates calculated by the “Modification of Diet in Renal Disease” formula (6), cardiac troponin-I, and B-type natriuretic peptide.
Exclusion criteria for all amyloidosis and hypertensive control patients included the presence of moderate or severe valvular heart disease, congenital heart disease, severe claustrophobia, or pregnancy or an inability to lie flat for 80 min. Additional exclusion criteria for the hypertensive controls included previously known congestive cardiac failure, myocardial infarction, and an LV ejection fraction of less than 50%.
The study was approved by the institutional ethics committee, and all patients provided written informed consent.
Cardiac PET Data Acquisition
Cardiac PET (Biograph mCT, 128-slice; Siemens) was performed in list mode for 80 min. As the distribution of 18F-florbetaben in the heart has not been previously reported, a long acquisition time was required to enable selection of the optimal imaging protocol for future studies. Low-dose CT (tube current, 40 mA⋅s; tube voltage, 120 kV) was performed through the heart during tidal respiration for attenuation correction and to aid in anatomic localization of radiotracer activity. The PET acquisition commenced at the same time as injection of a single intravenous 4 MBq/kg (0.1 mCi/kg) bolus of 18F-florbetaben, without any observed hemodynamic effects. The average activity received by the patients was 259 MBq (7 mCi), with an SD of 41 MBq (1.1 mCi). Dynamic images were reconstructed from the list-mode data using 80 frames of 1 min each, with a matrix of 200 × 200, using ordered-subset expectation maximization iterative technique (3 iterations and 21 subsets). Static images were reconstructed with a matrix of 400 × 400 and a slice thickness of 3 mm. The estimated whole-body effective radiation dose to each patient was 5.8 mSv.
Cardiac PET Analyses
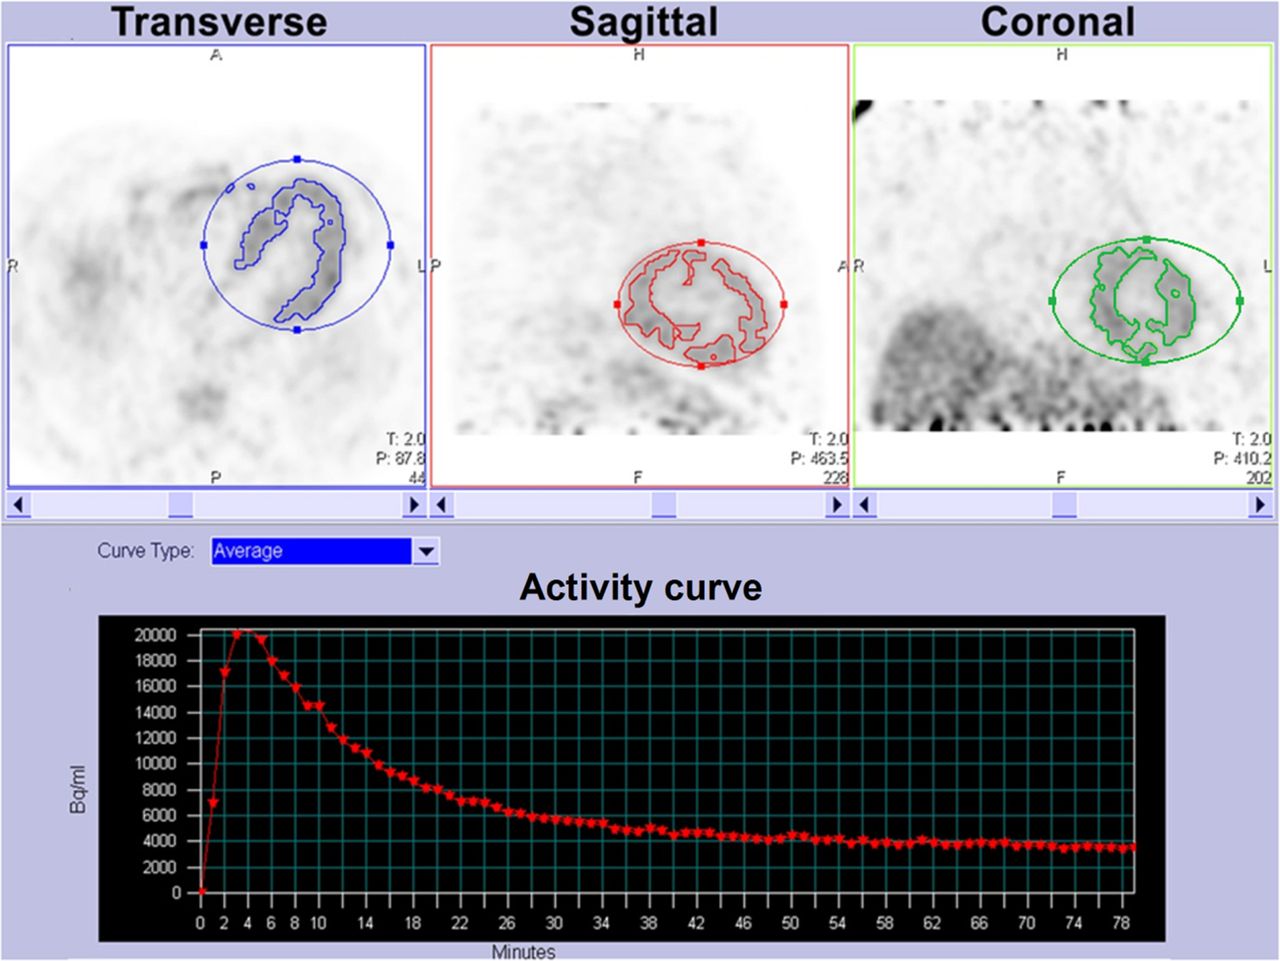
Qualitative assessment of myocardial 18F-florbetaben uptake was performed visually using static images reconstructed from PET data acquired between 15 and 75 min after the injection of 18F-florbetaben. To further assess contrast between myocardial 18F-florbetaben uptake and the background blood pool over time (the target-to-background ratio), the SUVmean in the LV myocardium and blood pool was plotted every minute and displayed graphically. Therefore, a higher target-to-background ratio is represented by a greater separation between the myocardial SUV curve and the blood-pool SUV curve over time. LV myocardial SUV was calculated by placing a volume of interest around the heart on summed images between 5 and 10 min after radiotracer injection, when there was a maximal difference between myocardial and ventricular luminal blood-pool SUV (Fig. 1). Using an automated isocontour function in commercially available software (syngo.via; Siemens Healthcare), we transposed the obtained myocardial contour to the remainder of the frames for dynamic analysis (Supplemental Fig. 1; supplemental materials are available at http://jnm.snmjournals.org). We used the default isocontour threshold of 40% SUVmax because it corresponded best with the actual boundaries of the myocardium, as is generally the case with PET tumor imaging as recommended by guidelines (7). Blood-pool SUV was measured using a 1-cm-diameter region of interest in the mid descending thoracic aorta (extended over 2 cm in the z-axis). This region of interest can also be generated automatically using the PET analysis software, providing the benefits of reproducibility, ease of performance, and accuracy of localization of blood-pool activity.

Example of software-automated volume-of-interest isocontouring performed on 5- to 10-min postflorbetaben images of patient with cardiac amyloidosis.
To quantify myocardial accumulation of 18F-florbetaben, both 18F-florbetaben retention index (RI) and percentage myocardial 18F-florbetaben retention were calculated. 18F-florbetaben RI was calculated as the mean myocardial 18F-florbetaben SUV between 15 and 20 min after injection divided by the integral of the arterial time–activity curve between 0 and 17.5 min after injection, the midpoint of 15–20 min (8). Calculation of percentage myocardial 18F-florbetaben retention was based on the change in SUVmean on summed-framed images of the LV myocardium between 0 and 5 min and 15 and 20 min after radiotracer injection using the following formula: where SUV0–5 is mean myocardial SUV between 0 and 5 min and SUV15–20 is mean myocardial SUV between 15 and 20 min.
Echocardiography
With the patients at rest, a transthoracic echocardiogram was obtained using a commercially available ultrasound system (Vivid E9, 4V probe; GE Healthcare) and digitally stored for offline analysis (EchoPAC, version 113; GE Healthcare). A complete 2D, color, pulsed, continuous-wave Doppler echocardiogram was obtained using standard techniques (9,10).
LV mass index was calculated (7) and corrected for body surface area (11). Relative wall thickness was calculated (10). LV end-diastolic volume index and end-systolic volume index were calculated using the biplane Simpson method of disks and corrected for body surface area. LV ejection fraction was derived. Stroke volume was calculated from LV outflow tract cross-sectional area and the velocity–time integral and indexed to body surface area. Cardiac output was derived from the calculated stroke volume and heart rate.
RV free wall thickness was measured at the level of the tricuspid annulus in the 2D subcostal view (12). Changes in RV end-diastolic area, end-systolic area, and fractional area were measured (12).
Mitral inflow early (E wave) and late (A wave) diastolic velocities and pulmonary venous peak systolic and diastolic velocities were recorded using pulsed-wave Doppler echocardiography in the apical 4-chamber view.
Pulsed-wave tissue Doppler velocities were recorded at the septal and lateral mitral annulus in the apical 4-chamber view; mitral annular systolic (s′) and early diastolic (e′) velocities were obtained (13). LV filling pressure (E/e′) was calculated as the ratio of transmitral E wave to average mitral annular e′ velocity. Tricuspid annular s′ and e′ velocities were also recorded.
2D speckle-tracking analyses were performed on standard gray-scale images in the apical 2-, 3-, and 4-chamber views. LV global longitudinal strain was calculated from the 3 individual apical global longitudinal strain curves, whereas RV free wall longitudinal strain was obtained from the apical 4-chamber view (13).
Analysis of all PET results was masked to the echocardiographic results. As the PET analyses were automated, there were no intra- or interobserver measurement variabilities for myocardial SUV, background blood-pool SUV, or myocardial 18F-florbetaben RI. Analysis of all echocardiographic results was also masked to the PET results. Previous work has reported intra- and interobserver measurement variabilities of 1.2% ± 0.5% and 0.9% ± 1.0%, respectively, for longitudinal strain, expressed as mean absolute difference (14). Using a similar methodology, the intra- and interobserver variabilities for measurement of global longitudinal strain in the present study were 0.8% ± 0.3% and 1.0% ± 0.5%, respectively, expressed as mean absolute difference ± SD.
Statistical Analysis
Continuous variables are presented as mean ± SD, and categoric variables as frequencies and percentages. When comparing categoric variables, we used the exact χ2 test using the Monte Carlo method with 99% confidence interval and 10,000 samples to calculate the P value. The Kruskal–Wallis test was used to compare 3 groups of continuous variables, and the Mann–Whitney U test was used to compare 2 groups of continuous variables. For significant results, post hoc multiple comparisons were performed using Bonferroni adjustments. Pearson correlation was used to determine the association between 2 continuous variables. To determine the correlation between myocardial 18F-florbetaben RI and biventricular strain, myocardial 18F-florbetaben RI was first inverse-transformed. Multiple linear regression analyses were then used to determine the independent association between the inverse transformed myocardial 18F-florbetaben RI and global LV/RV free wall longitudinal strain. To prevent overfitting of the data, no more than two of the most significant univariable predictors were sequentially entered into the multiple linear regression models. In addition, a tolerance of less than 0.5 (equating to model R > 0.7) was set to avoid multicolinearity. To determine the relative contribution of each predictor in the multivariable analyses, standardized β-values are presented. A 2-tailed P value of less than 0.05 was considered significant. All statistical analyses were performed using SPSS Statistics (version 22.0; IBM) for Windows (Microsoft).
RESULTS
The baseline clinical, echocardiographic, and PET characteristics of all the patients are presented in Supplemental Table 1. There were no significant differences in age or body mass index among the 3 groups of patients, and there was a trend toward lower renal function in amyloid patients.
Amyloid patients had a significantly higher relative wall thickness than the hypertensive controls, but there was no significant difference in LV mass index among the 3 groups. Although there were no differences in indexed LV volume and LV ejection fraction, amyloid patients had a significantly lower stroke volume index and cardiac index. On tissue Doppler imaging, amyloid patients had significantly lower myocardial systolic and early diastolic velocities and higher LV filling pressures than hypertensive controls.
PET Qualitative Image Assessment
The overall quality of 18F-florbetaben PET static images was excellent in all patients. Diffusely increased myocardial radiotracer uptake was observed in all AL and ATTR patients, and none was observed in the hypertensive controls (Fig. 2). All amyloid patients and hypertensive controls showed intense 18F-florbetaben uptake in the liver and the imaged bowel loops, in keeping with hepatobiliary excretion of 18F-florbetaben. This uptake did not interfere with visualization of myocardial 18F-florbetaben uptake. 18F-florbetaben uptake was also seen in the skeleton, particularly the vertebrae and to a lesser extent the ribs and sternum—the mechanism and significance of which were uncertain.
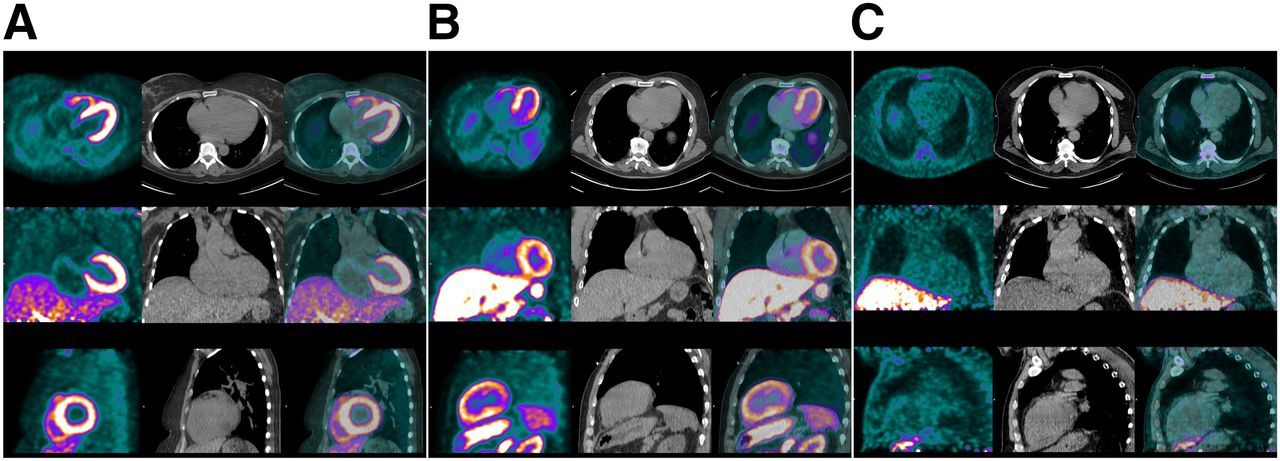
18F-florbetaben PET (left column in each panel), low-dose CT (middle column), and PET/CT images (right column) of representative AL patient (A), ATTR patient (B), and hypertensive control (C). There was diffuse avid 18F-florbetaben myocardial uptake in both AL and ATTR patients but little radiotracer uptake in myocardium of hypertensive control. PET images were windowed to display myocardial boundaries.
18F-Florbetaben Target-to-Background Ratio
Quantitative assessment of myocardial 18F-florbetaben uptake against the background blood pool was performed on all 3 groups of patients and is shown in Figure 3.
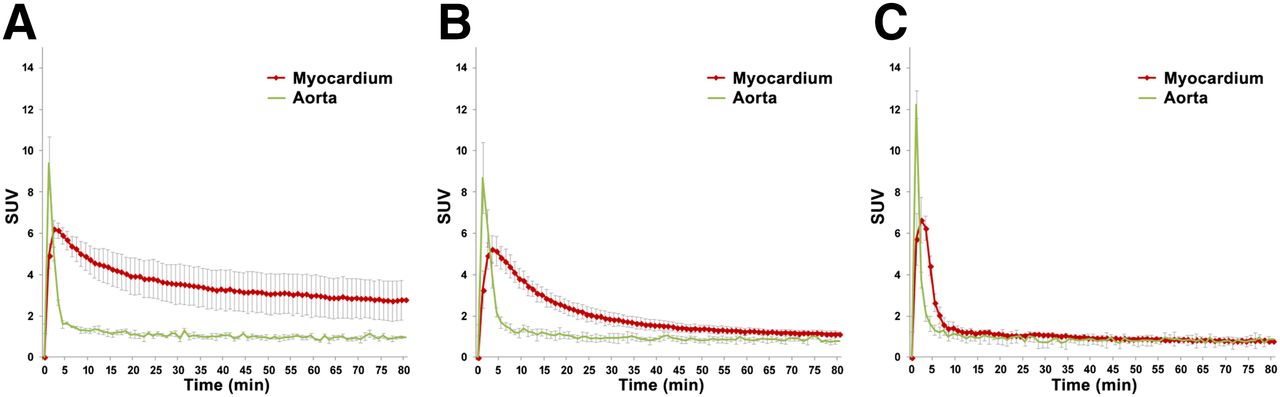
18F-florbetaben time–activity curves in AL patients (A), ATTR patients (B), and controls (C). Data points are mean SUVs in LV myocardium and blood-pool peak at 2−3 min after radiotracer injection; error bars represent SDs. Target-to-background ratios were significantly higher in AL and ATTR patients than in hypertensive controls after the initial 10 min and persisted until end of image acquisition. There was a trend toward higher myocardial SUV in AL than ATTR patients. There was also greater variability in myocardial SUV in AL than ATTR patients.
Peak blood-pool 18F-florbetaben activity was observed within the first 2 min after injection in all amyloid and hypertensive control patients, whereas peak LV myocardial 18F-florbetaben activity occurred at the same time as or slightly later than (within 1 min) peak blood-pool activity (Fig. 3). The target-to-background ratios were significantly higher in both AL and ATTR patients than in hypertensive controls from about 10 min after radiotracer injection until the end of the 80-min image acquisition (Figs. 2 and 3).
Target-to-background ratios were higher in AL patients than in ATTR patients, as represented by the greater separation between the myocardial SUV curve and the blood-pool SUV curve throughout the acquisition (Fig. 3). However, variability in myocardial 18F-florbetaben SUV was significantly higher in AL patients than in ATTR patients.
The blood-pool SUV curves were of similar shape and variability for all 3 groups.
Myocardial 18F-Florbetaben RI
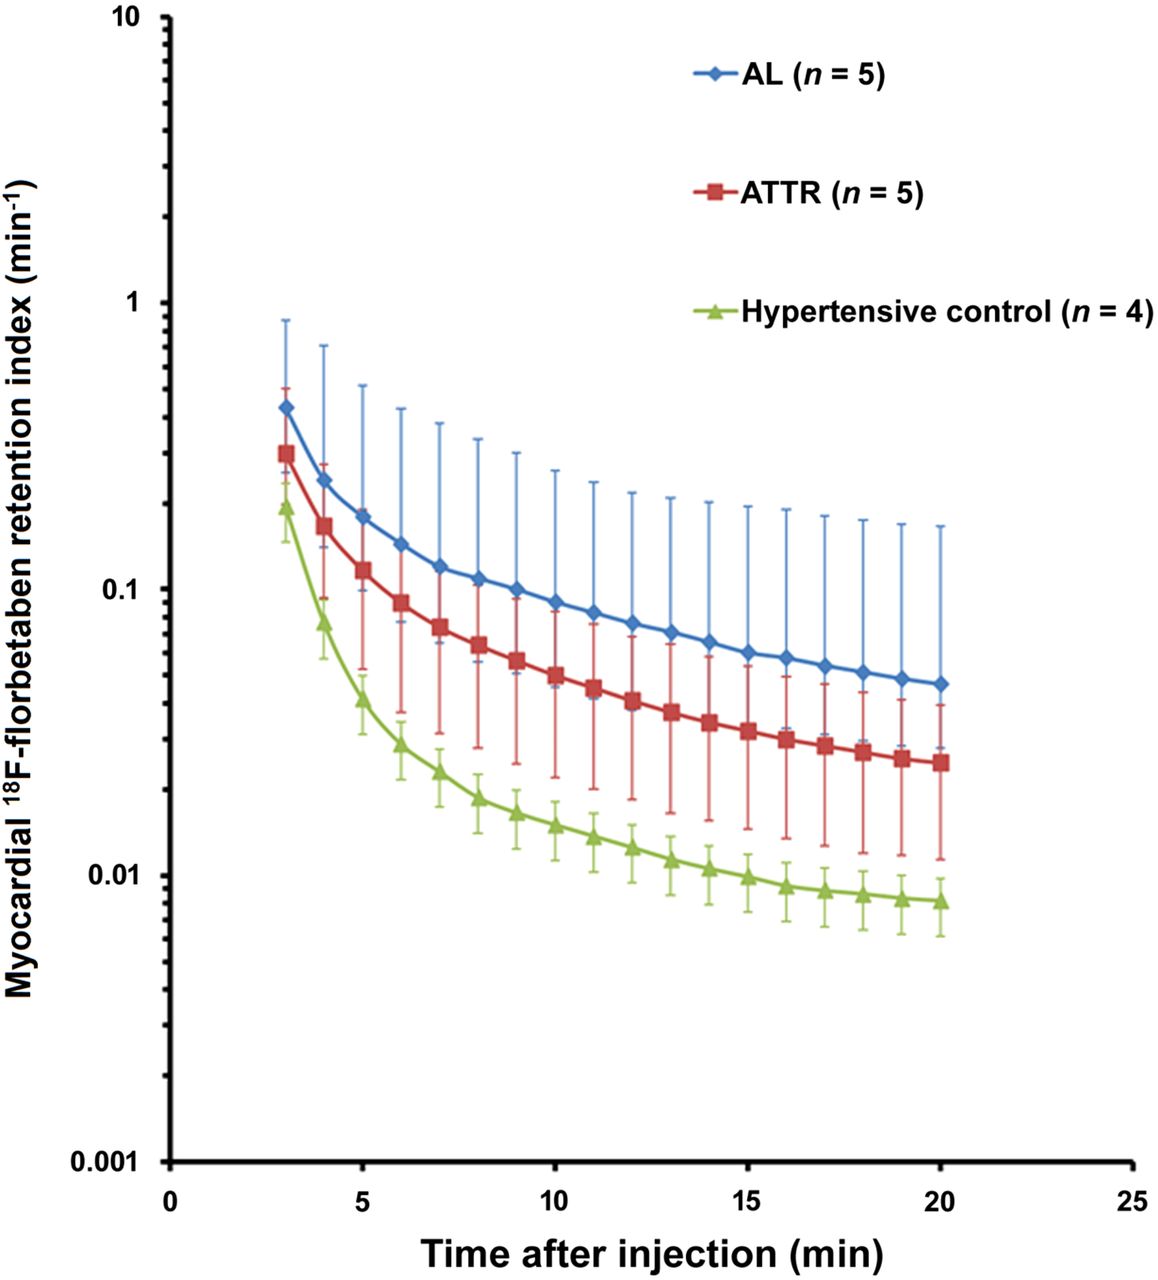
Figure 4 shows the time course of 18F-florbetaben RI for all 3 groups. Figure 5 shows that the median myocardial 18F-florbetaben RI was 0.043 min−1 (range, 0.032–0.065 min−1) in AL patients, 0.035 min−1 (range, 0.022−0.042 min−1) in ATTR patients, and 0.010 min−1 (range, 0.008−0.015 min−1) in hypertensive controls. A myocardial RI of greater than 0.020 min−1 identified all amyloid patients and no controls (Fig. 5).

18F-florbetaben RI over time in AL patients, ATTR patients, and controls. Mean myocardial retention of 18F-florbetaben was higher in both AL and ATTR patients than in controls. Error bars represent ranges.
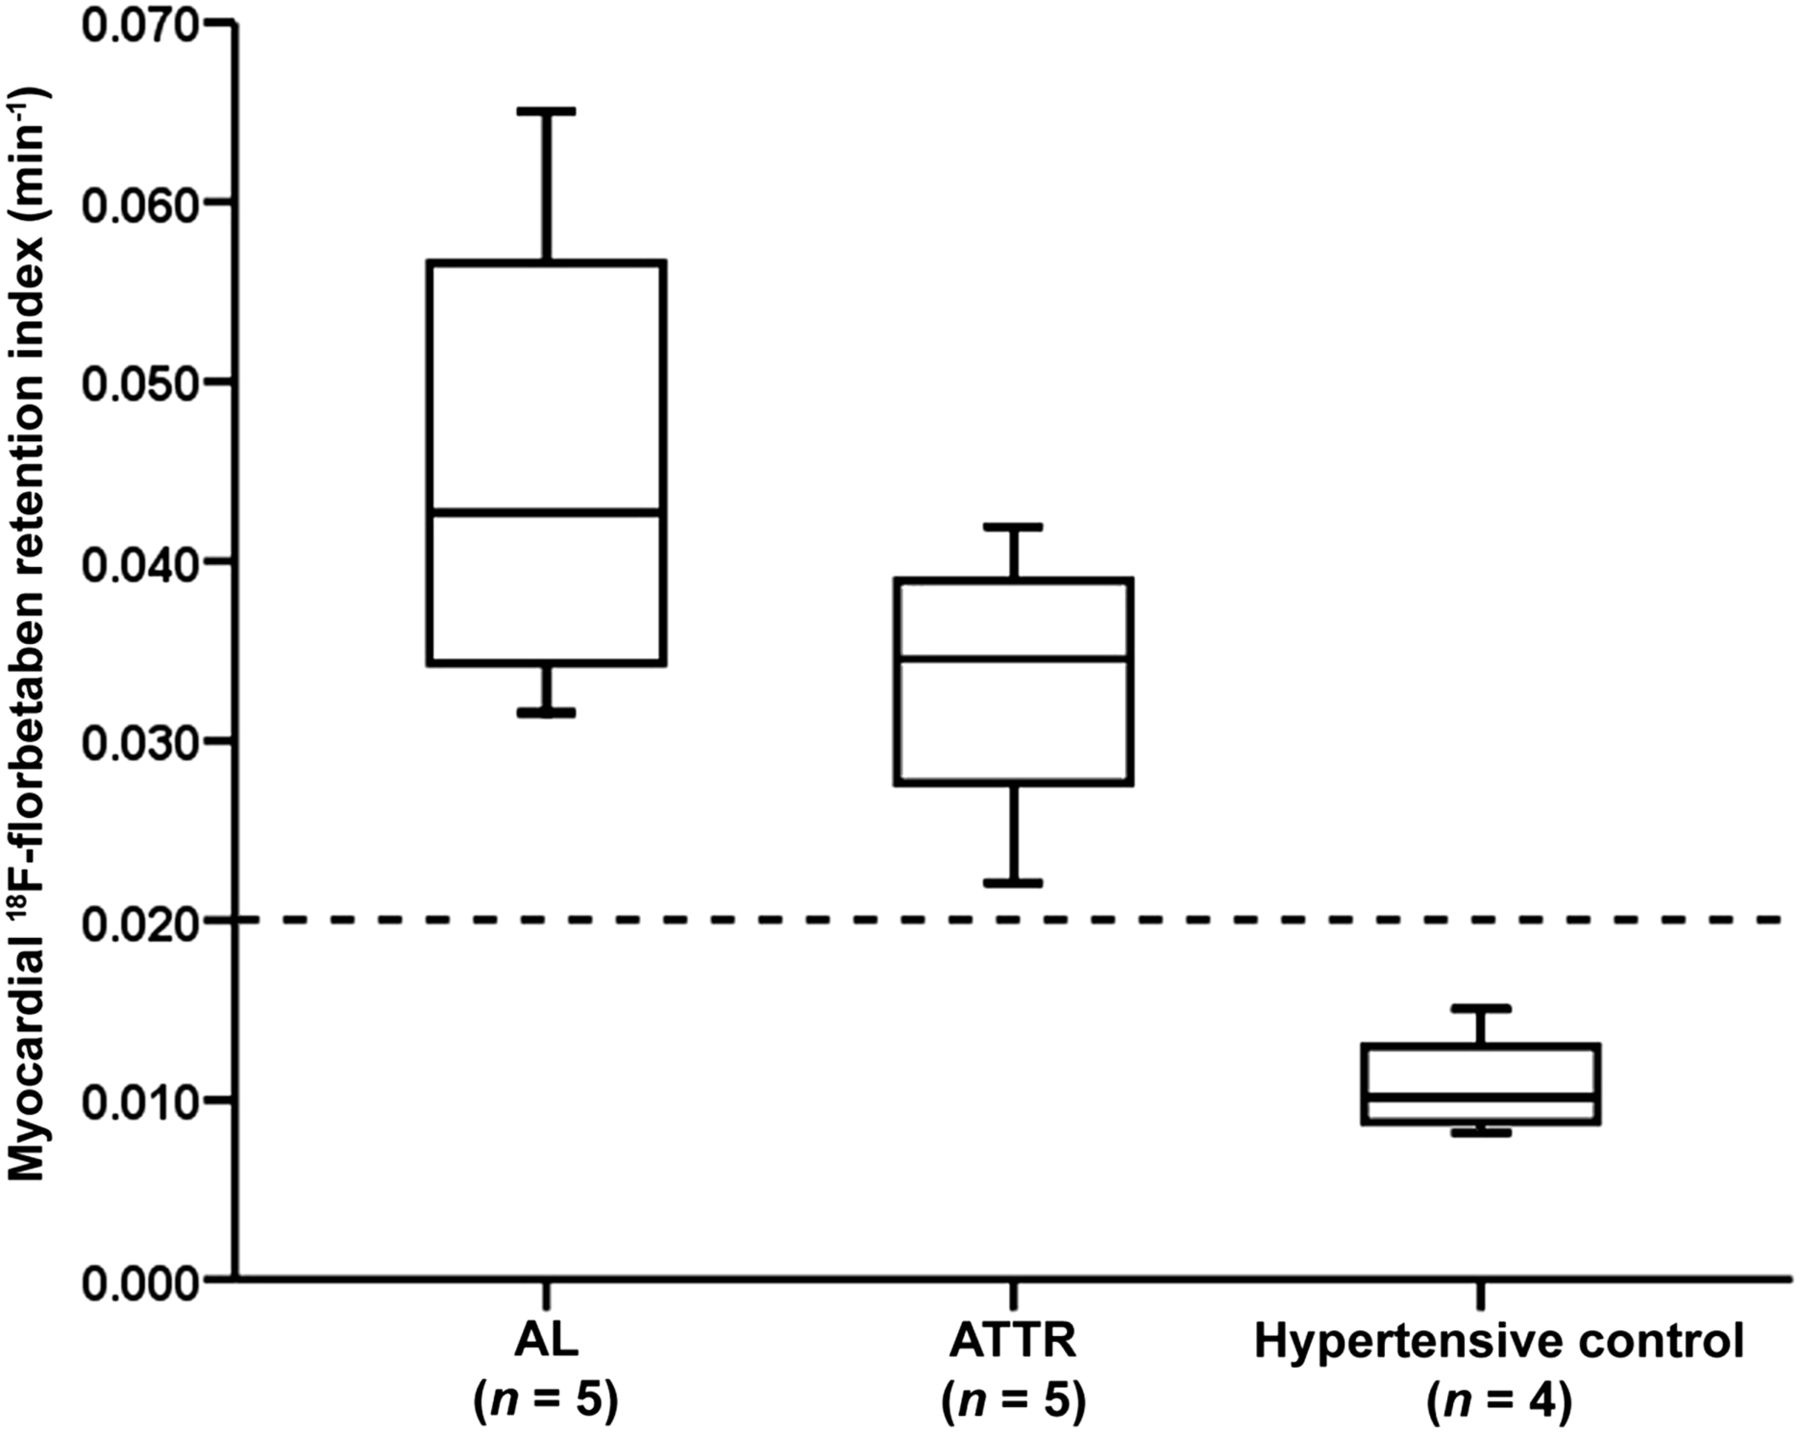
Box plots for myocardial 18F-florbetaben RI in AL patients, ATTR patients, and controls. Myocardial 18F-florbetaben RI was significantly higher in AL and ATTR patients. All cardiac amyloid patients and no hypertensive controls had myocardial 18F-florbetaben RI greater than 0.020 min−1.
Percentage Myocardial 18F-Florbetaben Retention
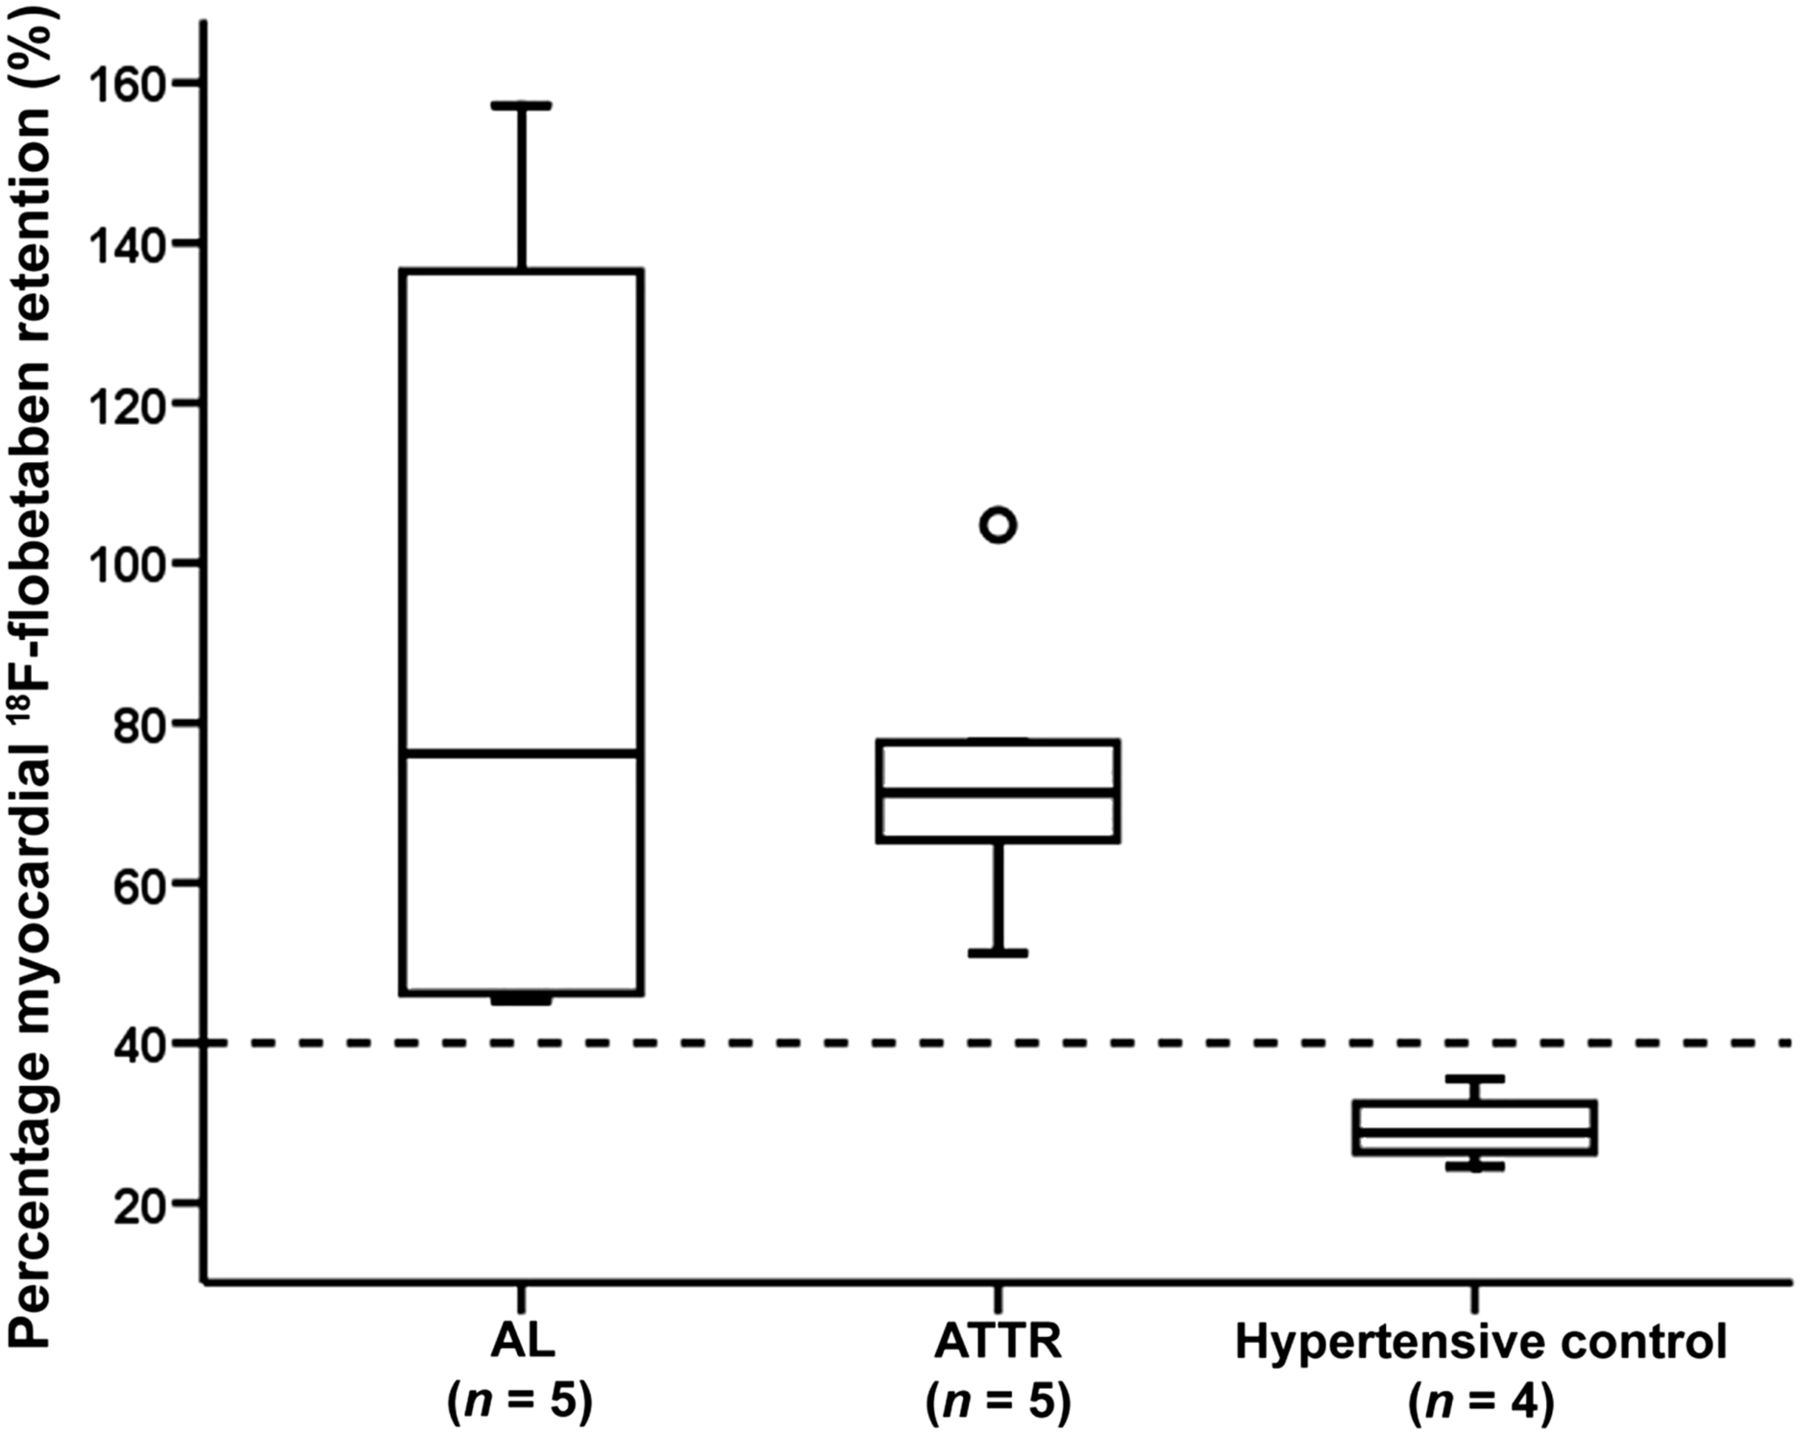
The median myocardial 18F-florbetaben retention for AL, ATTR, and hypertensive control patients was 76.2% (range, 45.3%−157.2%), 71.2% (range, 51.3%−104.7%), and 28.8% (range, 24.5%−35.4%), respectively (P = 0.018). There were significant differences in percentage myocardial 18F-florbetaben retention between AL patients and hypertensive controls (P = 0.042 with Bonferroni adjustment) and between ATTR patients and hypertensive controls (P = 0.042 with Bonferroni adjustment) but not between AL and ATTR patients (P > 0.99 with Bonferroni adjustment).
Figure 6 shows the box plots for percentage myocardial 18F-florbetaben retention for the 3 groups of patients. There was a clear separation between the AL or ATTR patients and the hypertensive controls. A 40% cutoff could differentiate between AL or ATTR patients and hypertensive controls.

Box plots for percentage myocardial 18F-florbetaben retention for AL patients, ATTR patients, and controls. Percentage myocardial 18F-florbetaben retention was significantly higher in AL and ATTR patients. All cardiac amyloid patients and no hypertensive controls had myocardial retention greater than 40%.
Biventricular Myocardial Contractile Function
On 2D speckle tracking, amyloid patients had significantly more impaired LV global longitudinal strain, and a trend toward more impaired RV free wall longitudinal strain. Figure 7 shows that the relationships among percentage myocardial 18F-florbetaben retention, LV global longitudinal strain, and RV free wall longitudinal strain can be expressed by an inverse curve (i.e., y = a + 1/x, where a = constant). Therefore, to evaluate the correlation between percentage myocardial 18F-florbetaben retention and biventricular longitudinal strain, the percentage myocardial 18F-florbetaben retention was first inverse-transformed. On univariable analyses, the inverse percentage myocardial 18F-florbetaben retention correlated significantly with LV global longitudinal strain (r = −0.91, P < 0.001) and RV free wall longitudinal strain (r = −0.80, P = 0.001). Similarly, when the hypertensive controls were excluded from the analyses, inverse percentage myocardial 18F-florbetaben retention still correlated significantly with LV global longitudinal strain (r = −0.84, P = 0.003) and RV free wall longitudinal strain (r = −0.74, P = 0.015).

Scatterplots for percentage myocardial 18F-florbetaben retention vs. LV global longitudinal strain (A) and RV free wall longitudinal strain (B), as expressed by inverse curve relationship. Scatterplots in C and D show inverse transformed percentage myocardial 18F-florbetaben retention. Triangles indicate AL patients, crosses indicate ATTR patients, and circles indicate hypertensive controls.
There were no correlations between inverse percentage myocardial 18F-florbetaben retention and B-type natriuretic peptide (r = −0.15, P = 0.69), cardiac troponin-I (r = −0.26, P = 0.46), interventricular septal wall thickness (r = −0.46, P = 0.10), posterior wall thickness (r = −0.53, P = 0.054), or LV mass index (r = −0.08, P = 0.78). However, inverse percentage myocardial 18F-florbetaben retention correlated significantly with LV relative wall thickness (r = −0.54, P = 0.045) and RV free wall thickness (r = −0.66, P = 0.01). When hypertensive controls were excluded, there were no correlations among inverse percentage myocardial 18F-florbetaben retention, LV relative wall thickness, and RV free wall thickness (all P > 0.05).
Supplemental Table 2 outlines the significant univariable determinants of LV global longitudinal strain. There were significant colinearities between systolic blood pressure, diastolic blood pressure, interventricular septal wall thickness, and posterior wall thickness. Therefore, only inverse percentage myocardial 18F-florbetaben retention and posterior wall thickness were sequentially entered into the multiple linear regression model. On multivariable analysis, inverse percentage myocardial 18F-florbetaben retention was the only—and a significant—independent determinant of LV global longitudinal strain (standardized β = −0.804, P < 0.001; model R = 0.929). Similar results were obtained when hypertensive controls were excluded from the analysis (standardized β = −0.845, P = 0.002; model R = 0.893). In addition, similar multivariable analysis results were obtained using inverse 18F-florbetaben RI (standardized β = −0.725, P = 0.001; model R = 0.877).
Supplemental Table 2 also depicts the significant univariable determinants of RV free wall longitudinal strain. There was significant colinearity between RV free wall thickness and interventricular septal wall thickness. Therefore, only inverse percentage myocardial 18F-florbetaben retention and RV free wall thickness were sequentially entered into the multiple linear regression model. On multivariable analysis, only inverse percentage myocardial 18F-florbetaben retention was an independent determinant of RV free wall longitudinal strain (standardized β = −0.607, P = 0.021; model R = 0.829). Likewise, when hypertensive controls were excluded from the analysis, inverse percentage myocardial 18F-florbetaben retention was still an independent determinant of RV free wall longitudinal strain (standardized β = −0.686, P = 0.024).
DISCUSSION
The present study demonstrated that 18F-florbetaben PET can accurately identify cardiac amyloidosis and appears promising for the differentiation of myocardial thickening secondary to amyloid deposition from hypertensive heart disease. Furthermore, there was an inverse curve relationship between percentage myocardial 18F-florbetaben retention and biventricular myocardial contractile function. However, on the basis of the current protocol, 18F-florbetaben PET cannot be said to readily differentiate between AL and ATTR subtypes.
18F-Florbetaben PET Imaging and Diagnosis of Cardiac Amyloidosis
In a recent pilot study, Dorbala et al. showed that 18F-florbetapir can accurately differentiate cardiac amyloidosis patients from healthy controls (15). However, the main diagnostic dilemma is differentiating cardiac amyloidosis from other more common causes of LV hypertrophy such as hypertensive heart disease (16). As cardiac amyloidosis confers a significantly worse long-term prognosis, diagnosis requires a plethora of tests, including physical examination, cardiac troponin, B-type natriuretic peptide, electrocardiogram, echocardiogram, and cardiac MRI (16). Although the results of these tests may be suggestive of cardiac amyloidosis, no single finding is pathognomonic of the disease. Consequently, an invasive endomyocardial biopsy may often be required, especially when common coexisting cardiac diseases that cause LV hypertrophy are present, such as severe hypertensive or aortic stenosis (16). Therefore, developing a new noninvasive diagnostic test for cardiac amyloidosis demands high sensitivity and specificity. One of the major strengths of the present study was inclusion of hypertensive controls with evidence of LV hypertrophy on echocardiography. 18F-florbetaben appears promising for differentiation of cardiac amyloidosis from hypertensive heart disease. Future studies investigating the pattern of 18F-florbetaben uptake in other (nonamyloid, nonhypertensive) causes of myocardial thickening would further clarify the specificity of 18F-florbetaben.
18F-florbetaben PET imaging also offers additional advantages over cardiac MRI. Although cardiac MRI has an established role in diagnosing cardiac amyloidosis—from determining patterns of delayed enhancement to allowing T1 mapping for increased interstitial space (16–18)—patients often have coexisting renal dysfunction that prevents the use of intravenous gadolinium. Furthermore, MRI-incompatible devices such as pacemakers will limit the role of cardiac MRI. Finally, unlike 18F-florbetaben, which specifically binds to amyloid plaques, diagnosis of cardiac amyloidosis by MRI frequently depends on patterns of late gadolinium enhancement. As such, a recent study reported a more than 5% false-positive rate in cardiac MRI based on late gadolinium enhancement (18).
It will also be interesting to see if measurements of clinical disease activity such as troponin I and B-type natriuretic peptide, as well as free light chains and ATTR circulating levels, correlate with 18F-florbetaben retention in larger patient cohorts, as the small patient numbers in the present study would not be expected to show a significant correlation even if one truly existed.
Myocardial 18F-Florbetaben Retention and Biventricular Contractile Function
Beyond just diagnosing cardiac amyloid involvement with high accuracy, 18F-florbetaben PET may have a role in monitoring amyloid plaque burden and correlating it with the extent of myocardial dysfunction, potentially as part of assessing response to therapy. To our knowledge, the present study is the first to demonstrate that percentage myocardial 18F-florbetaben retention correlates significantly with biventricular contractile function via an inverse curve relationship (Fig. 7). Thus, small initial increases in myocardial 18F-florbetaben RI result in rapid deterioration in myocardial contractile function. This finding suggests that early detection and treatment of cardiac amyloidosis are important to prevent disproportionate and potentially irreversible myocardial dysfunction. Future studies with larger sample sizes are required to confirm the interpretative significance of the multivariate analysis.
Although there was no significant difference in percentage myocardial 18F-florbetaben retention between AL and ATTR subtypes, there was significantly higher myocardial SUV variability for AL patients (Fig. 3). It is unclear if this observation indicates greater variability in amyloid plaque burden in AL patients, as these patients did not undergo endomyocardial biopsy for quantification of amyloid plaque burden. However, a recent MRI study demonstrated that in comparison with AL patients, ATTR patients had concomitant cellular hypertrophy in addition to increased extracellular volume (19). Therefore, in the present study, in which AL and ATTR patients had comparable LV mass indices, it is likely that the AL patients had a correspondingly larger extracellular volume and more amyloid deposition than the ATTR patients, as was consequently reflected in a higher myocardial SUV. This finding supports the hypothesis that because of the slower pace of amyloid accumulation, patients with ATTR have time to develop compensatory ventricular muscle hypertrophy, possibly explaining why AL patients have more rapidly progressive heart failure and worse survival than ATTR patients despite relatively less LV mass (20).
CONCLUSION
In this pilot study, which included a selected cohort of amyloid patients and hypertensive controls, 18F-florbetaben appeared promising for the identification of cardiac amyloidosis, and percentage myocardial 18F-florbetaben retention correlated with the extent of biventricular myocardial dysfunction. These are, however, preliminary findings based on a small number of patients and, although encouraging, require validation in larger populations with a greater heterogeneity of both amyloid patients and patients with nonamyloid myocardial thickening. Future studies should also include patients with early disease who have yet to fulfil the diagnostic criteria for cardiac amyloidosis, correlate percentage myocardial 18F-florbetaben retention with histologic amyloid plaque burden, and determine the feasibility of 18F-florbetaben PET in monitoring response to therapy. Tailored molecular imaging with PET using 18F-florbetaben may significantly simplify the diagnostic algorithm for cardiac amyloidosis.
DISCLOSURE
The costs of publication of this article were defrayed in part by the payment of page charges. Therefore, and solely to indicate this fact, this article is hereby marked “advertisement” in accordance with 18 USC section 1734. Dr. Law is supported by a Princess Alexandra Hospital Research Foundation grant. Dr. Ng is supported by the National Health and Medical Research Council early career fellowship. No other potential conflict of interest relevant to this article was reported.
Acknowledgments
We are grateful for the assistance of our colleagues in the Medical Imaging, Cardiology, and Haematology Departments of the Princess Alexandra Hospital, University of Queensland. We also thank Drs. Dariusz Korczyk, Mark Strudwick, and Lisa Gillinder for assisting with the study; Cyclotek for production and delivery of the radiotracer; and Piramal for its support of the project
Footnotes
Published online Jun. 15, 2016.
- © 2016 by the Society of Nuclear Medicine and Molecular Imaging, Inc.
REFERENCES
- Received for publication November 16, 2015.
- Accepted for publication May 16, 2016.


Jump to section
Related Articles
Cited By...
- Head-to-head comparison of [18F]florbetapir and [18F]FDG PET for the early detection of amyloidosis in systemic amyloidosis and plasma cell dyscrasias
- Molecular Imaging of Systemic and Cardiac Amyloidosis: Recent Advances and Focus on the Future
- Prognostic Value of Left Ventricular 18F-Florbetapir Uptake in Systemic Light-Chain Amyloidosis
- Novel Tracers for the Imaging of Cardiac Amyloidosis
- Novel Tracers for the Imaging of Cardiac Amyloidosis
- 18F-Florbetaben and PET/CT Holds Promise for the Identification and Differentiation Among Cardiac Amyloidosis Entities
- [18F]-Florbetaben PET/CT for Differential Diagnosis Among Cardiac Immunoglobulin Light Chain, Transthyretin Amyloidosis, and Mimicking Conditions
- Molecular Imaging of Cardiac Amyloidosis
- Improved Quantification of Cardiac Amyloid Burden in Systemic Light Chain Amyloidosis: Redefining Early Disease?
- Myocardial Amyloidosis: The Exemplar Interstitial Disease
- Transthyretin amyloidosis: an under-recognized neuropathy and cardiomyopathy